. 2024 Jul 11;5(4):zqae013.
doi: 10.1093/function/zqae013.

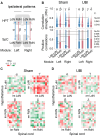
The Left-Right Side-Specific Neuroendocrine Signaling from Injured Brain: An Organizational Principle

Affiliations

The Left-Right Side-Specific Neuroendocrine Signaling from Injured Brain: An Organizational Principle

Hiroyuki Watanabe et al. Function (Oxf). .

Abstract

A neurological dogma is that the contralateral effects of brain injury are set through crossed descending neural tracts. We have recently identified a novel topographic neuroendocrine system (T-NES) that operates via a humoral pathway and mediates the left-right side-specific effects of unilateral brain lesions. In rats with completely transected thoracic spinal cords, unilateral injury to the sensorimotor cortex produced contralateral hindlimb flexion, a proxy for neurological deficit. Here, we investigated in acute experiments whether T-NES consists of left and right counterparts and whether they differ in neural and molecular mechanisms. We demonstrated that left- and right-sided hormonal signaling is differentially blocked by the δ-, κ- and µ-opioid antagonists. Left and right neurohormonal signaling differed in targeting the afferent spinal mechanisms. Bilateral deafferentation of the lumbar spinal cord abolished the hormone-mediated effects of the left-brain injury but not the right-sided lesion. The sympathetic nervous system was ruled out as a brain-to-spinal cord-signaling pathway since hindlimb responses were induced in rats with cervical spinal cord transections that were rostral to the preganglionic sympathetic neurons. Analysis of gene-gene co-expression patterns identified the left- and right-side-specific gene co-expression networks that were coordinated via the humoral pathway across the hypothalamus and lumbar spinal cord. The coordination was ipsilateral and disrupted by brain injury. These findings suggest that T-NES is bipartite and that its left and right counterparts contribute to contralateral neurological deficits through distinct neural mechanisms, and may enable ipsilateral regulation of molecular and neural processes across distant neural areas along the neuraxis.

Keywords: brain injury; contralateral effects; gene co-expression networks; humoral signaling; left-right patterns; motor deficits; neuroendocrine system; postural asymmetry.


Conflict of interest statement

V.G. is affiliated with Evotec International GmbH, and has no other competing interests to declare. G.H.M. and N.L. are affiliated with Medibrain, Vila do Conde, Portugal, and have no other competing interests to declare. M.H.O. is affiliated with Evidera, Bethesda, MD, United States, and has no competing interests to declare. The other authors declare that no competing interests exist.

Figures

Graphical Abstract
Graphical Abstract
Figure 1.
Figure 1.
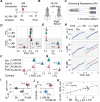
Asymmetry in hindlimb posture (HL-PA) and stretching resistance (SR) induced by the unilateral ablation of the hindlimb representation area of sensorimotor cortex (UBI) in rats with completely transected cervical spinal cords. (A) Experimental design. The spinal cord was transected at the C6-7 level and then followed by either a left UBI (L-UBI; n = 10), right UBI (R-UBI; n = 12), or sham surgery (Sh; n = 7). The asymmetry levels were measured before (pre) and 3 h after (post) UBI or sham surgery. (B) The UBI-induced HL-PA was manifested as flexion of the left or right hindlimb. (C) The stretching resistance was analyzed as the amount of mechanical work W required to stretch a hindlimb, calculated as the integral of stretching force over a distance of 0–10 mm. The force was measured using a micromanipulator-controlled force meter consisting of 2 digital force gauges fixed on a movable platform. (D) The size of postural asymmetry (PAS) measured in millimeters (mm), and (E) the probability to develop HL-PA (PA) above a 1 mm threshold (indicated in D by vertical dotted lines). Negative and positive PAS values are assigned to rats with left and right hindlimb flexion, respectively. (F and G) The contrasts in PAS and PA between the UBI groups and the sham surgery group are denoted as ΔPAS and ΔPA, respectively, and were computed for the pre and post time points separately. (H) Representative traces of the stretching force recorded from the left and right hindlimbs before the UBI and sham surgery and 3 h after these surgeries. (I) Differences in stretching force between the left and right hindlimbs WL-R in gm × mm analyzed 3 h after UBI or sham surgery. (J) The contrast between animal groups in WL-R denoted as ΔWL-R 3 h after UBI or sham surgery. (K) Pearson correlation between the magnitude of postural asymmetry (MPA) and the difference in work between the hindlimbs contralateral and ipsilateral to UBI and expressed as ΔWC-I in gm × mm. The data presented are for left and right UBI groups analyzed 3 h after brain surgery. The median (represented as circles), 95% HPD (lines), and posterior density (distribution) from Bayesian regression are used to plot the PAS, PA, WL-R, and contrasts. Asymmetry and contrasts among the groups were deemed significant, with a 95% HPD not encompassing zero and adjusted P-values of ≤.05. Adjusted P-values are presented numerically on the plots. The PAS and WL-R values for individual rats are indicated by crosses in D and I. Source data: The EXCEL source data file “masterfile-210807.xlsx” and source data folder “/HL-PA/data/SF/.”
Figure 2.
Figure 2.
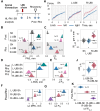
Effects of bilateral deafferentation of lumbar spinal cord on HL-PA and hindlimb asymmetry in stretching resistance (SR) induced by left UBI (L-UBI) and right UBI (R-UBI) in rats with completely transected cervical spinal cords. (A) Experimental design. The spinal cord was transected at the C6-7 level, followed by either a left UBI (n = 8), right UBI (n = 11), or sham surgery (Sh; n = 7). The asymmetries were analyzed 3 h after UBI or sham surgery (post) and in the same rats after bilateral rhizotomy performed from the L1 to S2 spinal levels (Rhz). (B) The HL-PA size (PAS) in millimeters (mm) and (C) the probability to develop HL-PA (PA) above the 1 mm threshold (denoted in B by dotted vertical lines). (D and E) The contrasts in PAS and PA between the UBI groups and the sham surgery group are denoted as ΔPAS and ΔPA, respectively, and computed for the post and Rhz time points separately. (F and G) The effects of rhizotomy on differences in the MPA (or PA) between L-UBI, R-UBI, and sham surgery (Sh) analyzed as contrast of contrasts between (i) L-UBI and sham surgery: ΔΔMPA (or ΔΔPA) = [(L-UBIPost – ShPost) – (L-UBIRhz – ShRhz)]; (ii) R-UBI and sham surgery: ΔΔMPA (or ΔΔPA) = [(R-UBIPost – ShPost) – (R-UBIRhz – ShRhz)]; and (iii) R-UBI and L-UBI: ΔΔMPA (or ΔΔPA) = [(R-UBIPost – L-UBIPost) – (R-UBIRhz – L-UBIRhz)]. (H) Representative traces of the stretching force recorded from the left and right hindlimbs of rats with UBI or sham surgery after rhizotomy. (I) Differences in stretching force between the left and right hindlimbs WL-R in gm × mm in rats with UBI or sham surgery after rhizotomy. (J) The contrasts in WL-R between the UBI and sham surgery groups denoted as ΔWL-R in rats after rhizotomy. (K) The effects of rhizotomy on differences between contralesional hindlimb and ipsilesional hindlimb WC-I = (WContraWIpsi) analyzed as contrast of contrasts between (i) L-UBI and sham surgery: ΔΔWC-I = [(L-UBIPost – ShPost) – (L-UBIRhz – ShRhz)]; (ii) R-UBI and sham surgery: ΔΔWC-I = [(R-UBIPost – ShPost) – (R-UBIRhz – ShRhz)]; and (iii) R-UBI and L-UBI: ΔΔWC-I = [(R-UBIPost – L-UBIPost) – (R-UBIRhz – L-UBIRhz)]. The PAS, PA, MPA, WL-R, WC-I, and contrasts are plotted as median (circles), 95% HPD (lines), and posterior density (distribution) from Bayesian regression. Asymmetry and contrasts among the groups were deemed significant, with a 95% HPD not encompassing zero and adjusted P-values of ≤.05. Adjusted P-values are presented numerically on the plots. Crosses in (B) and (I) denote the PAS and WL-R values for individual rats, respectively. Source data: The EXCEL source data file “masterfile-210807.xlsx” and source data folder “/HL-PA/data/SF/.”
Figure 3.
Figure 3.
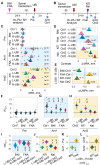
Effects of nor-binaltorphimine (BNI), β-funaltrexamine (FNA), and naltrindole (NTI), the selective κ-, µ-, and δ-opioid antagonists, respectively, and naloxone (Nal), the general opioid antagonist, on HL-PA and hindlimb asymmetry in stretching resistance (SR) induced by left UBI (L-UBI) and right UBI (R-UBI) in rats with completely transected cervical spinal cords. The spinal cord was transected at the C6-7 level, and then left or right UBI was performed. (A) Experimental design 1. BNI and FNA were administered 24 h before the transection (Ant1). The asymmetries were analyzed after the transection before the UBI (pre), and then 3 h after the UBI (Ant1). The control group Ctrl1 consisted of rats with UBI that were not treated with drugs. (B) Experimental design 2. The asymmetries were assessed 3 h after UBI (Post). The rats with MPA greater than 1.5 mm were selected for further analysis and treated with NTI or Nal (Ant2) or used as controls after saline treatment, or left untreated (Ctrl2). Asymmetries were analyzed 1 h later. Group design and the number of rats in the groups are given in Figure 3—figure supplement S1. The direction of PAS in all animals in each group was the same; the left and right UBI rats exhibited positive and negative PAS values, respectively. (C) The antagonist effects on the MPA. (D) Contrasts in the MPA between the respective control groups and the groups treated with antagonists. Time points: 3 h after transection for BNI and FNA (Ant1), and 4 h after transection for NTI and Nal, which was 1 h after their administration (Ant2). (E) Contrast of contrasts between the L-UBI and R-UBI groups in the effects of antagonists on the MPA: ΔΔMPA = [(L-UBIAnt1 – Ctrl1) – (R-UBIAnt1 – Ctrl1)] for BNI and FNA; and ΔΔMPA = [(L-UBIAnt2 – Ctrl2) – (R-UBIAnt2 – Ctrl2)] for NTI and Nal. The time points are the same as those in the (D). (F–H) Differences in stretching force between the contra- and ipsilesional hindlimbs WC-I in gm × mm. (I and J) Contrasts in the WC-I between the UBI groups treated with the antagonists and respective control groups. The time points are the same as those in (D). (K and L) Contrast of contrasts between the L-UBI and R-UBI groups in the effects of antagonists on the WC-I; K: ΔΔWC-I = [(L-UBIAnt1 – Pre1) – (R-UBIAnt1 – Pre1)] and L: ΔΔWC-I = [(L-UBIAnt2 – Ctrl2) – (R-UBIAnt2 – Ctrl2)]. Crosses denote the MPA and the WC-I values for individual rats. The median (represented as black circles), 95% HPD (black lines), and posterior density (colored distribution) from Bayesian regression are used to plot the MPA, WC-I, and contrasts. Asymmetry and contrasts among the groups were deemed significant, with a 95% HPD not encompassing zero and adjusted P-values of ≤.05. Adjusted P-values are presented numerically on the plots. Source data: the EXCEL source data file “SDU-RDPA-Stat_v2.xlsx” and source data folder/HL-PA-opioid-antagonists/data/SF/.”
Figure 4.
Figure 4.
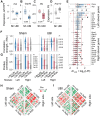
The UBI effects on gene expression patterns in the hypothalamus and pituitary gland. Analysis of the left (LdN) and right (RdN) dominant gene co-expression networks in the hypothalamus. (A–D) Gene expression levels in the left hypothalamus (HPT) and the pituitary gland (Pit) collected 3 h after left sham surgery (Sh: n = 11 rats) or left UBI (n = 12 rats) that were performed in the spinalized rats. The expression levels in the log2 scale and the Bonferroni adjusted P-values determined by Mann–Whitney test are shown. (E) The asymmetry index AIL/R = log2[L/R], where L and R are the median expression levels in the left and right hypothalamus, is shown for each gene analyzed. There were no differences in the AIL/R between sham surgery and UBI groups; therefore, they were combined (n = 22) for statistical analysis. Wilcoxon signed-rank test followed by Bonferroni multiple testing correction: *, P-adj < .05; **, P-adj < .01; #, P ≤ .05 (not adjusted). Boxes denote genes with AIL/R > 0 or AIL/R < 0 that were defined as the LdN and RdN genes. In (A–E), data are presented as boxplots with median and hinges representing the first and third quartiles, and whiskers extending from the hinge to the highest/lowest value that lies within the 1.5 interquartile range of the hinge. (F and G) Patterns of intra-modular correlations internal for each the LdN (LdN–LdN) and RdN (RdN–RdN), and between the networks (LdN–RdN) are shown for the left and right modules of sham surgery and left UBI groups. In (F), correlation strengths |Rho| (absolute value of each pairwise correlation) are presented as violin plots with white line indicating mean coordination strength. The proportion of positive correlations is shown as horizontal lines in (G). The 3 correlation patterns were compared within each (ie, left and right) module. Each pattern was compared between the modules and between UBI and sham surgery groups (for details, see Figure 4—figure supplement S10A). P-values were determined by permutation testing with Benjamini–Hochberg family wise multiple test correction. Significance for contrasts was determined by analysis of 3 AIL/R categorization variants (Figure 4—figure supplement S9); P-values are shown for the categorization variant with the median AIL/R of the combined sham surgery and UBI group. (H and I) Heatmaps for Spearman’s rank coefficients for pairwise gene–gene correlations in the left- (lm) and right- (rm) modules of sham surgery and UBI groups. Source data: the EXCEL source data files “Hypoth_SO_UBI.xlsx; RD Hypophis_ Master file.xlsx; Table III-S6 23 05 10.xlsx; raw_groups.xlsx.”
Figure 5.
Figure 5.
Gene co-expression patterns in the left and right lumbar spinal cord of the sham surgery and UBI rats. Analysis of the LdN and RdN gene networks. Expression of the neurohormonal and neuroplasticity-related genes was analyzed in the left and right halves of the spinal cord that were isolated 3 h after the left sham surgery (n = 11) or left UBI (n = 12) in spinalized rats. (A) Gene categorization using the AIL/R = log2[L/R], where L and R are the median expression levels in the left and right spinal cord into the LdN (AIL/R > 0) and RdN (AIL/R < 0). The median AIL/R is shown for the combined sham surgery and the left UBI group. There were no differences in the AIL/R between sham surgery and UBI groups; therefore, they were combined (n = 22) for statistical analysis (for details, see Figure 5—figure supplement S1). Wilcoxon signed-rank test followed by Bonferroni multiple testing correction: *, P-adj < .05; #, P ≤ .05 (not adjusted). Data are presented as boxplots with median and hinges representing the first and third quartiles, and whiskers extending from the hinge to the highest/lowest value that lies within the 1.5 interquartile range of the hinge. (B and C) Patterns of intra-modular correlations internal for each the LdN (LdN–LdN) and RdN (RdN–RdN), and between the networks (LdN–RdN). A violin plot for absolute Rho values of pairwise correlations, with horizontal line indicating overall coordination strength (defined as an average of these absolute values) in (B) and the proportion of positive correlations in (C) for the left and right modules are shown for the sham surgery and UBI groups. The 3 correlation patterns were compared within each (ie, left and right) module. Each pattern was compared between the modules, and between UBI and sham surgery groups (for details, see Figure 4—figure supplement S10B). P-values were determined by permutation testing with Benjamini–Hochberg family wise multiple test correction. Significance for contrasts was determined by analysis of 3 AIL/R categorization variants (Figure 5—figure supplement S1); P-values are shown for the categorization variant with the median AIL/R of the combined sham surgery and UBI group. (D and E) Heatmaps for Spearman’s rank coefficients for pairwise gene–gene correlations in the left- (lm) and right- (rm) modules of sham surgery and UBI groups. Source data: the EXCEL source data file “SpinalC_SO_UBI_Ctrl_RD_DD.xlsx; Table III-S6 23 05 10.xlsx; raw_groups.xlsx.”
Figure 6.
Figure 6.
Ipsilateral coordination of the LdN and RdN between the hypothalamus and lumbar spinal cord. The effects of UBI. The experimental design and computation of LdN and RdN are described in Figures 4 and 5. (A) Analyzed patterns of the ipsilateral pairwise gene–gene Spearman rank correlations between the hypothalamus (HPT) and spinal cord (SpC) on the left side (α and β) and on the right side (γ and δ). (B) The coordination strength and the proportion of positive correlations for the correlation patterns depicted in (A). The correlation patterns were compared between the LdN and RdN (α vs. β; γ vs. δ); each of them between the left and right modules (α vs. γ; β vs. δ), and all 4 patterns individually between UBI and sham surgery groups. P-values were determined by permutation testing with Benjamini–Hochberg family wise multiple test correction. Significance for contrasts was determined by analysis of 3 AIL/R categorization variants (Figure 4—figure supplement S9; Figure 5—figure supplement S1); P-values are shown for the categorization variant with the median AIL/R of the combined sham surgery and UBI group. (C and D) Heatmaps for Spearman’s rank coefficients for pairwise gene–gene correlations for the left- (lm) and right- (rm) modules in sham surgery and UBI groups. Source data: the EXCEL source data file “Hypoth_SO_UBI.xlsx; SpinalC_SO_UBI_Ctrl_RD_DD.xlsx; Table III-S6 23 05 10.xlsx; raw_groups.xlsx.”
Figure 7.
Figure 7.
A model of the bipartite asymmetric T-NES that enables the left-right side-specific signaling from the brain to the lumbar spinal cord (SpC) through the humoral pathway. The left (A) and right (B) T-NES counterparts mediate the contralateral effects of the left-side and right-side brain injury. A unilateral brain lesion stimulates the release of side-specific neurohormones from the hypothalamus (HPT) and pituitary gland (Pit) into the blood, they bind to neuronal receptors that are lateralized in the spinal cord, or peripheral neuronal endings, and induce contralateral responses, e.g., hindlimb flexion. The δ- and κ-opioid receptors may control signaling from the brain injured on the left side (left UBI), whereas the µ-opioid receptors may control signaling after the right UBI. The endogenous opioid peptides could differentially convey signals from the left and right hemispheres through the humoral pathway or control their processing in the hypothalamus or spinal cord. Although the left and right T-NES counterparts are not mirror symmetric to each other in their neural mechanisms, they produce overall symmetric functional responses, such as flexion of the right and left hindlimbs, respectively. The effects of the left T-NES but not right T-NES may require an afferent input and depend on spinal reflexes. The right T-NES effects may develop through activation of motoneurons or changes in the neuromuscular system. (C and D) The T-NES-mediated ipsilateral crosstalk between the hypothalamic and lumbar spinal cord gene expression networks and its reorganization in response to a unilateral brain lesion. Ipsilateral interactions between the hypothalamus and spinal cord are depicted in each network as positive if the proportion of positive correlations is >0.5 and negative if it is <0.5. Arrows show the direction of changes in gene expression levels induced by the left UBI. The ipsilateral correlations significantly differ between the dominant left gene expression network and dominant right gene expression network on each body side and for both networks between the sides. Only interactions of the left networks were significantly perturbed by the left UBI. The patterns of interactions were similar or almost mirror-symmetric (allo-symmetric) for the left networks on the left side and the right networks on the right side and for the right networks on the left side and the left networks on the right side. The diagonal (contralateral) inter-regional interactions were not significant.

Comment in

Similar articles

Cited by

References

    1. Louis ED. Contralateral control: evolving concepts of the brain-body relationship from Hippocrates to Morgagni. Neurology. 1994;44(12):2398–2400. - PubMed
    1. Lemon RN. Descending pathways in motor control. Annu Rev Neurosci. 2008;31(1):195–218. - PubMed
    1. Purves D, Augustine GJ, Fitzpatrick D. Neuroscience. 2nd ed. Sunderland: Oxford University Press, 2001.
    1. Smith CC, Paton JFR, Chakrabarty S, Ichiyama RM. Descending systems direct development of key spinal motor circuits. J Neurosci. 2017;37(26):6372–6387. - PMC - PubMed
    1. Simon F. On the origin of the term decussatio pyramidum. J Hist Neurosci. 2018;27(1):101–105. - PubMed

LinkOut - more resources