. 2024 Jul 9;16(13):10724-10748.
doi: 10.18632/aging.206012. Epub 2024 Jul 9.

Co-analysis of methylation platforms for signatures of biological aging in the domestic dog reveals previously unexplored confounding factors

Affiliations

Co-analysis of methylation platforms for signatures of biological aging in the domestic dog reveals previously unexplored confounding factors

Aitor Serres Armero et al. Aging (Albany NY). .

Abstract

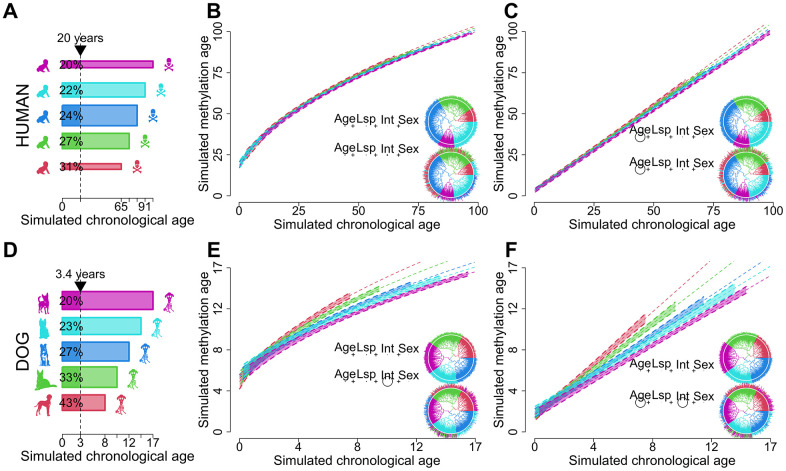
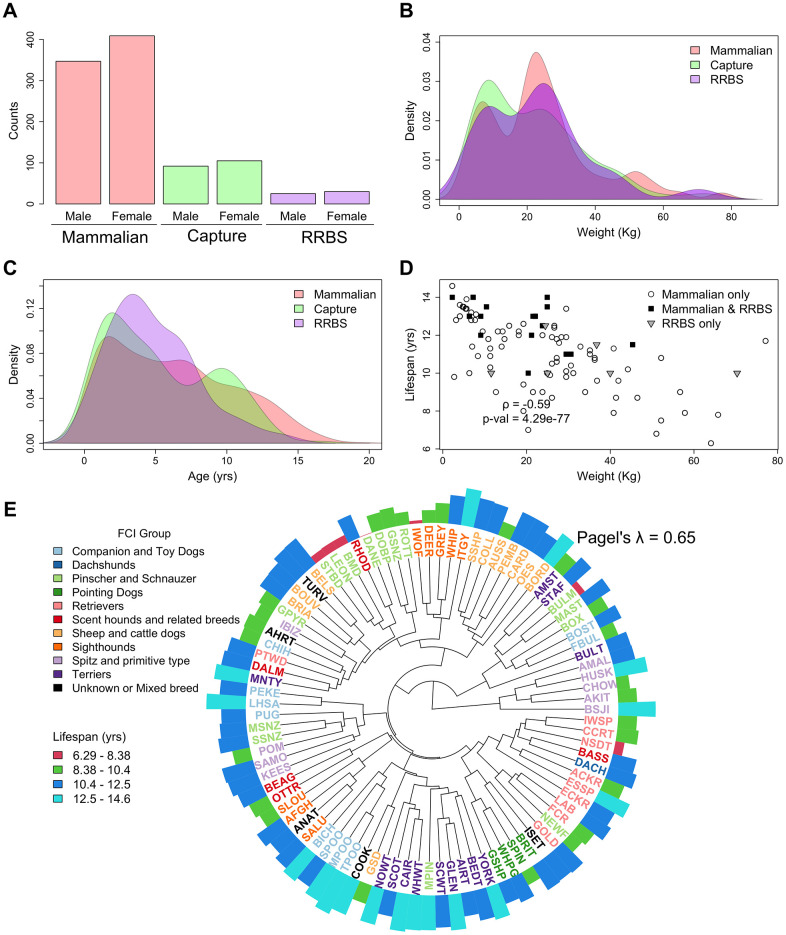
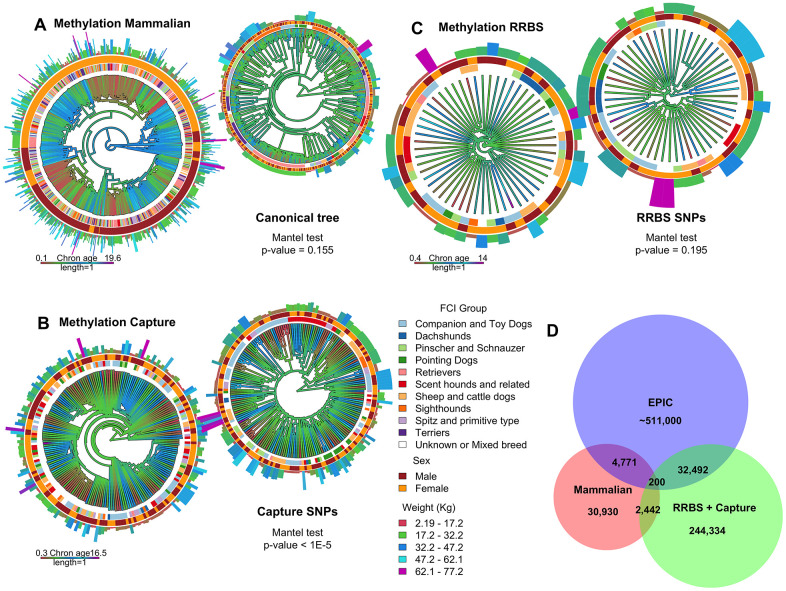
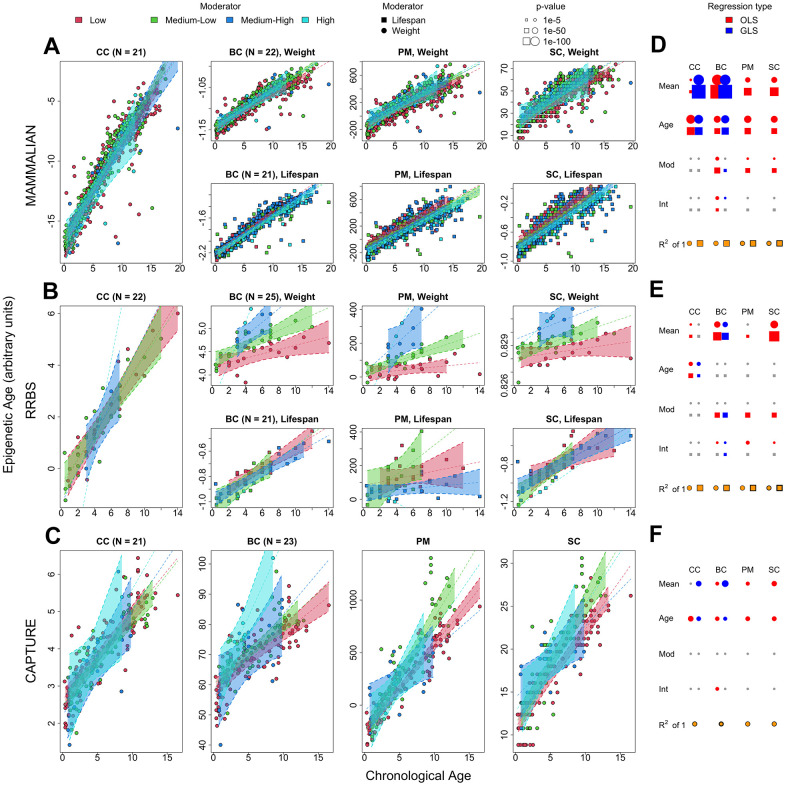
Chronological age reveals the number of years an individual has lived since birth. By contrast, biological age varies between individuals of the same chronological age at a rate reflective of physiological decline. Differing rates of physiological decline are related to longevity and result from genetics, environment, behavior, and disease. The creation of methylation biological age predictors is a long-standing challenge in aging research due to the lack of individual pre-mortem longevity data. The consistent differences in longevity between domestic dog breeds enable the construction of biological age estimators which can, in turn, be contrasted with methylation measurements to elucidate mechanisms of biological aging. We draw on three flagship methylation studies using distinct measurement platforms and tissues to assess the feasibility of creating biological age methylation clocks in the dog. We expand epigenetic clock building strategies to accommodate phylogenetic relationships between individuals, thus controlling for the use of breed standard metrics. We observe that biological age methylation clocks are affected by population stratification and require heavy parameterization to achieve effective predictions. Finally, we observe that methylation-related markers reflecting biological age signals are rare and do not colocalize between datasets.

Keywords: biological age; dog; lifespan; methylation; penalized regression.


Conflict of interest statement

CONFLICTS OF INTEREST: The Regents of the University of California filed a patent application (publication number WO2020150705) related to the mammalian methylation array on which S.H. is a named inventor. S.H. is a founder of the non-profit Epigenetic Clock Development Foundation, which has licensed several patents from UC Regents, and distributes the mammalian methylation array. The remaining authors declare no competing interests.

Figures

Figure 1
Figure 1
Schematic showcasing the potential of dogs as models for biological aging. Humans (AC) are compared to dogs (DF). Panels (A, D) represent idealized distributions of longevity. Human longevity (A) is centered around a particular value while dogs with infrequent extremes as depicted by the width of the bars. Dog longevity (D) is more evenly distributed across different breeds. The different colors represent longevity bins. The vertical dotted line in (A, D) shows the variation in biological ages for a fixed chronological age. The longevity distributions in (A, D) were used to generate the biological age regression models in (B, C, E, F). Ages were sampled uniformly from within the bounds of each longevity category. Regression models contain a dependent term raised to the second power and simulated values for age (Age), lifespan (Lsp), sex (Sex) and the quotient between age and longevity representing biological age (Int) as independent variables. The same coefficients, sample sizes and error distributions were used for humans and dogs, and phylogenies were randomly generated. Panels (B, E) represent the effects of non-linearity while (C, F) depict the linearized regression model. The p-values of each regression term are shown as circles in the inscribed equations with size proportional to -log magnitude, joined by plus signs to evoke linear regression. In panels (B, C, E, F) the top equations showcase instances where longevity is completely correlated with tree topology, as depicted by the matching color of the tree leaves and edges. In the bottom equations longevity has a smaller phylogenetic signal while still retaining some phylogenetic structure. The 99% confidence intervals and trend lines in the plots are produced by this second model.
Figure 2
Figure 2
Summary of the relevant phenotypes across the RRBS, mammalian methylation array and capture sequencing datasets. (AC) Distribution of sex, weight, and age in the three datasets. (D) Correlation between lifespan and weight in all breeds represented in the three studies. Capture sequencing contained a subset of the breeds represented in the mammalian methylation array. (E) Canonical phylogeny of the breeds represented in all three studies [20]. The length of the outer ring bars is proportional to lifespan and colored according to a binning of the lifespan distribution in equal length intervals. The tree tips are colored according to the Fédération Cynologique Internationale [35] (FCI) group and named after the convention in Parker et al. [20].
Figure 3
Figure 3
Tree representation of the capture sequencing, mammalian methylation array and RRBS methylation datasets. (AC) The edges of each tree are colored with a gradient according to the age of each sample. The smaller trees at the top right corner of each panel correspond to genetic distance where age is also represented as a color gradient. The color of the innermost ring of the bigger and smaller trees corresponds to FCI clade, the middle ring corresponds to sex, and the length and color of the outermost bars to weight. (D) Venn diagram depicting the number of intersecting loci between the three studies. This also includes probes from the human EPIC commercial array [37], a methylation array platform commonly used in human studies, which align to the dog genome.
Figure 4
Figure 4
Statistical analyses of chronological and biological age sparse epigenetic clocks using phylogenetic penalized regression. Rows correspond to the mammalian methylation array, RRBS, and capture sequencing datasets, respectively. (AC) The first, second, third and fourth panels in each row represent the different epigenetic clocks. CC: penalized generalized least squares regression trained on chronological age. BC: penalized generalized least squares regression trained on biological age (product of age and weight), PM: epigenetic pacemaker trained on biological age data, SC: BayesAge algorithm trained on biological age data. The trend lines and 99% confidence intervals are derived from the penalized, phylogenetic least squares prediction model. Any split panels depict the use of weight or lifespan as a moderator as described in the panel and legend. (DF) The rightmost plots of each row depict the significance of each regressor in the corresponding dataset, with circle radii proportional to -log p-value (blue: phylogeny corrected least squares, red: ordinary least squares, gray: non-significant), the yellow-colored fraction of the area of the bottom circles and squares depicts the regression R2 values derived from the penalized, phylogenetic least squares prediction model.
Figure 5
Figure 5
2D density distribution of biological age EWAS p-values. (AE) The top panel corresponds to the mammalian methylation array, the center panel to the capture sequencing and the bottom panel to the RRBS dataset. The x-axis shows the likelihood improvement of the nested model containing age, the moderator variable and the age-moderator interaction against the model containing only chronological age, both with phylogenetically corrected errors. Panels (AC) use weight as the moderator variable while (DE) use lifespan. The top and bottom y-axes in each panel correspond to the p-values for age and for the moderator variable with phylogenetically corrected errors, respectively. The marginal densities of each p-value distribution are plotted in the top and right margins of each plot. The sites that contribute to the penalized regression chronological (gray) and biological age (yellow) clocks are annotated within each plot. The dotted lines correspond to linear combinations of -log p-values corrected for inflation (i.e., median of empirical p-value distribution divided by median of uniform distribution [~0.5]).

Similar articles

References

    1. Sen P, Shah PP, Nativio R, Berger SL. Epigenetic Mechanisms of Longevity and Aging. Cell. 2016; 166:822–39. 10.1016/j.cell.2016.07.050 - DOI - PMC - PubMed
    1. Arneson A, Haghani A, Thompson MJ, Pellegrini M, Kwon SB, Vu H, Maciejewski E, Yao M, Li CZ, Lu AT, Morselli M, Rubbi L, Barnes B, et al.. A mammalian methylation array for profiling methylation levels at conserved sequences. Nat Commun. 2022; 13:783. 10.1038/s41467-022-28355-z - DOI - PMC - PubMed
    1. Horvath S, Lu AT, Haghani A, Zoller JA, Li CZ, Lim AR, Brooke RT, Raj K, Serres-Armero A, Dreger DL, Hogan AN, Plassais J, Ostrander EA. DNA methylation clocks for dogs and humans. Proc Natl Acad Sci USA. 2022; 119:e2120887119. 10.1073/pnas.2120887119 - DOI - PMC - PubMed
    1. Caulton A, Dodds KG, McRae KM, Couldrey C, Horvath S, Clarke SM. Development of Epigenetic Clocks for Key Ruminant Species. Genes (Basel). 2021; 13:96. 10.3390/genes13010096 - DOI - PMC - PubMed
    1. Horvath S, Haghani A, Macoretta N, Ablaeva J, Zoller JA, Li CZ, Zhang J, Takasugi M, Zhao Y, Rydkina E, Zhang Z, Emmrich S, Raj K, et al.. DNA methylation clocks tick in naked mole rats but queens age more slowly than nonbreeders. Nat Aging. 2022; 2:46–59. 10.1038/s43587-021-00152-1 - DOI - PMC - PubMed

LinkOut - more resources