. 2024 Jul 10;16(755):eadg7123.
doi: 10.1126/scitranslmed.adg7123. Epub 2024 Jul 10.

Preclinical studies show that Co-STARs combine the advantages of chimeric antigen and T cell receptors for the treatment of tumors with low antigen densities

Affiliations

Preclinical studies show that Co-STARs combine the advantages of chimeric antigen and T cell receptors for the treatment of tumors with low antigen densities

Brian J Mog et al. Sci Transl Med. .

Abstract

Two types of engineered T cells have been successfully used to treat patients with cancer, one with an antigen recognition domain derived from antibodies [chimeric antigen receptors (CARs)] and the other derived from T cell receptors (TCRs). CARs use high-affinity antigen-binding domains and costimulatory domains to induce T cell activation but can only react against target cells with relatively high amounts of antigen. TCRs have a much lower affinity for their antigens but can react against target cells displaying only a few antigen molecules. Here, we describe a new type of receptor, called a Co-STAR (for costimulatory synthetic TCR and antigen receptor), that combines aspects of both CARs and TCRs. In Co-STARs, the antigen-recognizing components of TCRs are replaced by high-affinity antibody fragments, and costimulation is provided by two modules that drive NF-κB signaling (MyD88 and CD40). Using a TCR-mimic antibody fragment that targets a recurrent p53 neoantigen presented in a common human leukocyte antigen (HLA) allele, we demonstrate that T cells equipped with Co-STARs can kill cancer cells bearing low densities of antigen better than T cells engineered with conventional CARs and patient-derived TCRs in vitro. In mouse models, we show that Co-STARs mediate more robust T cell expansion and more durable tumor regressions than TCRs similarly modified with MyD88 and CD40 costimulation. Our data suggest that Co-STARs may have utility for other peptide-HLA antigens in cancer and other targets where antigen density may limit the efficacy of engineered T cells.


Conflict of interest statement

Competing interests: The Johns Hopkins University has filed patent applications related to technologies described in this paper on which E.H.H., K.M.W., J.D., B.J.M., M.S.H., A.H.P., N.P., K.W.K., B.V., S.B.G., D.M.P. & S.Z. are listed as inventors, including: HLA-restricted epitopes encoded by somatically mutated genes (US20180086832A1), MANAbodies and methods of using (US20200079854A1), MANAbodies targeting tumor antigens and methods of using (PCT/US2020/065617), and Engineered T-Cell Receptors and Methods of Making and Using the Same (US Application Nos. 63/459,056 & 63/512,021). B.V., K.W.K., & N.P. are founders of Thrive Earlier Detection, an Exact Sciences Company. K.W.K. & N.P. are consultants to Thrive Earlier Detection. B.V., K.W.K., N.P., and S.Z. hold equity in Exact Sciences. B.V., K.W.K., S.Z., and N.P. are founders of or consultants to and own equity in Clasp Therapeutics, Neophore, and Personal Genome Diagnostics. B.V., K.W.K., and N.P. are founders of or consultants to and own equity in Haystack Oncology and CAGE Pharma. N.P. is consultant to Vidium. B.V. is a consultant to and holds equity in Catalio Capital Management. S.Z. has a research agreement with BioMed Valley Discoveries, Inc. C.B. is a consultant to Depuy-Synthes, Bionaut Labs, Haystack Oncology, Galectin Therapeutics, and Privo Technologies. C.B. is a co-founder of OrisDx and Belay Diagnostics. S.B.G. is a founder and holds equity in AMS, LLC. M.F.K. received consulting fees from Argenx, Atara Biotherapeutics, Revel Pharmaceuticals, Sana Biotechnology, and Sanofi. J.D. previously consulted for Hemogenyx Pharmaceuticals. S.P. is a consultant to Merck, owns equity in Gilead and received payment from IQVIA and Curio Science. D.M.P. reports grant and patent royalties through institution from BMS, grant from Compugen, stock from Trieza Therapeutics and Dracen Pharmaceuticals, and founder equity from Potenza; being a consultant for Aduro Biotech, Amgen, Astra Zeneca (Medimmune/Amplimmune), Bayer, DNAtrix, Dynavax Technologies Corporation, Ervaxx, FLX Bio, Rock Springs Capital, Janssen, Merck, Tizona, and Immunomic-Therapeutics; being on the scientific advisory board of Five Prime Therapeutics, Camden Nexus II, WindMil; being on the board of directors for Dracen Pharmaceuticals. K.M.W and S.B.G. are current or former employees of Merck Sharp & Dohme LLC, a subsidiary of Merck & Co., Inc., Rahway, NJ and may own stock/stock options in Merck & Co., Inc., Rahway, NJ. The companies named above, as well as other companies, have licensed previously described technologies related to the work described in this paper from Johns Hopkins University. B.V., K.W.K., N.P. are inventors on some of these technologies. Licenses to these technologies are or will be associated with equity or royalty payments to the inventors as well as to Johns Hopkins University. Patent applications on the work described in this paper may be filed by Johns Hopkins University. The terms of all these arrangements are being managed by Johns Hopkins University in accordance with its conflict of interest policies.

Figures

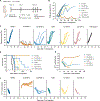
Fig. 1.
Fig. 1.. Potencies of conventional CARs and TCRs vary with antigen density.
(A) Diagrams of TCR-1, CAR-1, and CAR-2. CAR-1 employs a CD28 hinge, whereas CAR-2 employs a CD8α hinge. Both CARs use a CD28 transmembrane domain and intracellular signaling domain followed by a CD3ζ intracellular domain. Vα, Vβ, Cα and Cβ denote TCR variable α, variable β, constant α and constant β chains, respectively; ε, δ, γ and ζ denote the ε, δ, γ and ζ CD3 subunits, respectively; VH and VL, variable heavy and light chains of scFv, respectively. (B) T2 cells pulsed with decreasing concentrations of the p53RH peptide (HMTEVVRHC) were incubated with modified T cells at an E:T ratio of 1:5 for 24 hrs. Conditioned supernatant was assessed for IFN-γ by ELISA. (C) Modified T cells were cultured with the KMS26 isogenic cell set at an E:T ratio of 1:5 for 20 hrs. Conditioned supernatant was assayed for IFN-γ by ELISA. (D) Modified T cells were cultured with the NALM6 isogenic cell set exactly as described in C. (E) Modified T cells were cultured with the KMS26 isogenic cell set at an E:T ratio of 1:5 for 20 hrs. Cytotoxicity was quantified by bioluminescence since the target cancer cell lines were modified to express luciferase. (F) Modified T cells were cultured with the NALM6 isogenic cell set exactly as described in E. All data are shown as means ± SD of three technical replicates, except for the T cells only conditions, which represent two technical replicates. Number of repeated experiments, N = 2, with n = 2 different donors. ****P < 0.0001, ***P < 0.001, ns (not significant) by two-way ANOVA with Tukey’s multiple comparison test.
Fig. 2.
Fig. 2.. Hybrid TRuCs can signal at endogenous p53RH antigen densities.
(A) Diagrams of TCR-1 and TRuC-1 through -9 demonstrate the attachment of the H2-scFv to the N-terminus of CD3γ (TRuC-1), the TCRα or β constant domains (Cα, Cβ) (TRuC-2 to 5), or the TCRα or β variable domains (Vα, Vβ) of the full length TCR (TRuC-6 to 9). The H2-scFv was attached in the VLVH orientation (TRuC-1, 4, 5, 8, 9) or VHVL orientation (TRuC-2, 3, 6, 7). TRuC-1 was introduced into the CD3G locus, whereas all other constructs were introduced into the TRAC locus. For TCR-1, human or modified murine constant domains were used and found to be equivalent (fig. S19). Human constant chains are used on the left subpanels of subsequent plots whereas modified murine constant domains are used on the right subpanels. (B) Modified T cells (1 × 10⁴) were incubated with the KMS26 isogenic cell set (5 × 10⁴) for 20 hrs. Conditioned supernatant was analyzed for IFN-γ by ELISA. (C) Modified T cells (1 × 10⁴) were incubated with the NALM6 isogenic cell set exactly as in B. (D) Modified T cells (1 × 10⁴) were incubated with the KMS26 isogenic cell set (5 × 10⁴) for 20 hrs followed by a bioluminescence assay to quantify cytotoxicity (E) Co-culture with NALM6 isogenic cell set exactly as in D. Data are shown as means ± SD of three technical replicates for all conditions except T Cells Only, which represent two technical replicates. Comparisons between TCR-1, TRuC-1, TRuC-4, and TRuC-5 are representative of N = 2 independent experiments. ****P < 0.0001, *P < 0.05, ns (not significant) by two-way ANOVA with Tukey’s multiple comparison test.
Fig. 3.
Fig. 3.. STARs have comparable potency to conventional TCRs.
(A) Diagrams of TCR-1 and STAR-1 through -6 depict the attachment of the split H2-scFv VL and VH domains to the TCRα or β constant domains (Cα, Cβ) without a linker (STAR-1, -2) or with a 5 amino acid “EAAAK” linker (STAR-3, -4). STAR-5 and -6 show attachment of the split VL and VH domains to the N-termini of the TCRα and β variable domains (Vα, Vβ) of the full length TCR through a 5 amino acid “GGGGS” (G4S) linker. All depicted constructs utilize modified murine constant domains and human variable domains. (B) Modified T cells (1 × 10⁴) were cultured with KMS26 isogenic cell set (5 × 10⁴) for 20–21 hrs. Conditioned supernatant was analyzed for IFN-γ by ELISA. (C) Co-culture conditions exactly matched B except the NALM6 isogenic cell set was used. (D) Modified T cells (1 × 10⁴) were cultured with KMS26 isogenic cell set (5 × 10⁴) for 20–21 hrs. A bioluminescence assay was used to quantify cytotoxicity. (E) Co-culture conditions exactly matched D except the NALM6 isogenic cell set was used. Data are shown as means ± SD of three technical replicates, for all conditions except T Cells Only, which represent two technical replicates. Comparisons of TCR-1, STAR-1 and STAR-3 are representative of N = 4 independent experiments and n = 2 healthy donors. ****P < 0.0001, **P < 0.01, *P < 0.05. ns, not significant, by two-way ANOVA with Tukey’s multiple comparison test.
Fig. 4.
Fig. 4.. STAR and TCR demonstrate in vivo activity.
(A) Schematic of KMS26-MUT in vivo model timeline. NSG mice were injected through the tail vein with 0.35 × 10⁶ KMS26-MUT cells on day -6. Mice were randomized based on bioluminescence imaging (BLI) signal on day -1. Either 2 × 10⁶ knock-in (KI+) T cells normalized to 18% KI frequency with TCR-Control T cells or 11.1 × 10⁶ TCR-Control T cells were injected through the tail vein on day 0. (B) BLI measurements of KMS26-MUT tumor cells in treated mice. Data represent means ± SEM, n = 5. BLI measurements were discontinued either when mice died or when treatment conditions showed consistent cancer cell growth over serial measurements spanning more than two weeks. Two-way ANOVA with Holm-Šídák multiple comparison correction was used to compare treatment groups with at least 4 surviving mice (P < 0.0001 comparing TCR-Control to STAR-3, P < 0.001 comparing TCR-Control to TCR-1). (C) Kaplan-Meier survival curves for mice in the KMS26-MUT in vivo model. Log-rank Mantel–Cox test with Bonferroni correction was used (P < 0.05 comparing STAR-3 and TCR-1 as well as TCR-Control to STAR-3; P > 0.05 comparing STAR-3 to TCR-Control). (D) Schematic of NALM6-MUT in vivo model timeline. NSG mice were injected through the tail vein with 0.5 × 10⁶ NALM6-MUT cells on day -3. Mice were randomized based on BLI signal on day -1. Either 3 × 10⁶ KI+ T cells normalized to 16% KI+ frequency with TCR-Control T cells or 18.5 × 10⁶ TCR-Control T cells were injected through the tail vein on day 0. (E) BLI measurements of NALM6-MUT tumor cells in treated mice. Data represent means ± SEM, n = 5. Curves for No T cells and TCR-Control are truncated because all mice died before the day 30 timepoint. BLI measurements were discontinued when treatment conditions showed consistent cancer cell growth over serial measurements spanning more than two weeks. Two-way ANOVA with Holm-Šídák multiple comparison correction was used to compare treatment groups with at least 4 surviving mice (P < 0.0001 comparing TCR-Control to STAR-3 and TCR-1). (F) Kaplan-Meier survival curves for mice in the NALM6-MUT in vivo model. Log-rank Mantel–Cox test with Bonferroni correction was used (P < 0.05 comparing TCR-Control to STAR-3 and TCR-1; P > 0.05 comparing STAR-3 to TCR-1). (G) Numbers of total T cells in the peripheral blood of mice were quantified by flow cytometry on days 8 and 17 after T-cell injection. (H) Numbers of knock-in (KI+) T cells were quantified on days 8 and 17. Data represent mean ± SD of measurements from five mice, n = 5. **P < 0.01, *P < 0.05, ns (not significant) by paired t-tests with Holm-Šídák multiple comparison correction for G and H. Experiments in this figure were performed N = 1 time.
Fig. 5.
Fig. 5.. Co-stimulation improves long-term in vitro function of STAR and TCR.
(A) Schematic depicting co-stimulation modified STAR-3 and TCR-1. MyD88 and CD40 (MC) domains linked to the transmembrane domain of the TCRβ chain generate Co-STAR-1 and Co-TCR-1, whereas MC domains linked to the transmembrane domain of Fas generate Co-STAR-2 and Co-TCR-2. (B) STAR-3 was compared to four patient-derived TCRs. Modified T cells (1 × 10⁴) were cultured with NALM6-MUT cells expressing GFP (5 × 10⁴) in the absence of exogenous cytokines. Every 48 hrs, 5 × 10⁴ NALM6-MUT cells were added to the co-culture. Live cell imaging was used to quantify cancer cells. (C) STAR-3 was compared to constructs containing MC domains. The experiment was set up exactly as described in B. Data are representative of means ± SEM of three technical replicates (B) or four technical replicates (C). (D) Flow cytometric quantification of NALM6-MUT cells on day 25 of the multiple stimulation assay shown in C. (E) Flow cytometric quantification of knock-in positive (KI+) T cells on day 25 of the multiple stimulation assay shown in C. Data are shown as means ± SD of four technical replicates. All data are representative of N = 2 independent experiments and n = 2 healthy donors. ****P < 0.0001, ***P < 0.001, ns (not significant) by two-way ANOVA (B and C) or one-way ANOVA (D and E) with Tukey’s multiple comparison test.
Fig. 6.
Fig. 6.. Co-STARs demonstrate prolonged activity in vivo.
(A) Schematic showing the design of the in vivo experiment. NSG mice (n=5 mice per treatment group) were inoculated through the tail vein with 0.35×10⁶ KMS26-MUT cells on day -6. Mice were randomized based on BLI signal on day -1. Tail vein injection of modified T cells (either 1 × 10⁶ knock-in+ (KI+) T cells normalized to 10% KI frequency with TCR-Control T cells or 1 × 10⁷ TCR-Control T Cells) was performed on day 0. Approximately weekly BLI imaging was used to track cancer cell growth. (B) Radiance measurements for treatment groups are displayed as means. Curves are truncated when all mice in a treatment arm died before the specified timepoint. BLI measurements were discontinued 99 days after initial treatment. Two-way ANOVA with Holm-Šídák multiple comparison correction was used to compare all treatment groups with at least 4 surviving mice through day 24 (P < 0.01 comparing TCR-Control to Co-STAR-1, Co-STAR-2, and Co-TCR-1; P > 0.05 comparing TCR-Control to STAR-3, TCR-1, and Co-TCR-2), through day 39 (P < 0.01 comparing Co-STAR-2 and Co-TCR-2), though day 54 (P < 0.01 comparing Co-STAR-1 and Co-TCR-1), and through day 86 (P < 0.01 comparing Co-STAR-1 and Co-STAR-2; B). (C) The same radiance data in B are displayed for individual mice by treatment group. One curve is gray in Co-STAR-1 to indicate that multiple tumor outgrowths occurred in the same mouse. (D) Kaplan-Meier survival curves of seven treatment groups, n=5 mice per group. Log-rank Mantel-Cox test with Bonferroni-Holm correction was used (P < 0.05 comparing Co-STAR-1 to TCR-1, Co-TCR-1, and Co-TCR-2; P > 0.05 comparing Co-STAR-1 and Co-STAR-2). (E) Quantification of KI+ T cells in peripheral blood of mice using flow cytometry. Measurements are shown as means, n = 5 mice per treatment group. The curves are truncated either when all mice within a treatment group died or when the number of KI+ T cells detected in peripheral blood by flow cytometry was zero. Two-way ANOVA with Holm-Šídák multiple comparison correction was used to compare all treatment groups through day 27 (P < 0.0001 comparing Co-STAR-1 to all other groups). (F) The same KI+ T cell concentrations from E are displayed for individual mice by treatment group. Data in this figure are from N = 1 experiment.

References

    1. Rosenberg SA, Restifo NP, Adoptive cell transfer as personalized immunotherapy for human cancer. Science 348, 62–68 (2015). - PMC - PubMed
    1. Hinrichs CS, Rosenberg SA, Exploiting the curative potential of adoptive T-cell therapy for cancer. Immunol Rev 257, 56–71 (2014). - PMC - PubMed
    1. Tran E, Robbins PF, Rosenberg SA, ‘Final common pathway’ of human cancer immunotherapy: targeting random somatic mutations. Nature Immunology 18, 255–262 (2017). - PMC - PubMed
    1. Yamamoto TN, Kishton RJ, Restifo NP, Developing neoantigen-targeted T cell–based treatments for solid tumors. Nature Medicine 25, 1488–1499 (2019). - PubMed
    1. Schmitt TM, Stromnes IM, Chapuis AG, Greenberg PD, New Strategies in Engineering T-cell Receptor Gene-Modified T cells to More Effectively Target Malignancies. Clin Cancer Res 21, 5191–5197 (2015). - PMC - PubMed

Publication types

Substances