. 2024 Jul 12;10(28):eadk3365.
doi: 10.1126/sciadv.adk3365. Epub 2024 Jul 10.

Sex differences in neural projections of fear memory processing in mice and humans

Affiliations

Sex differences in neural projections of fear memory processing in mice and humans

Antonio Florido et al. Sci Adv. .

Abstract

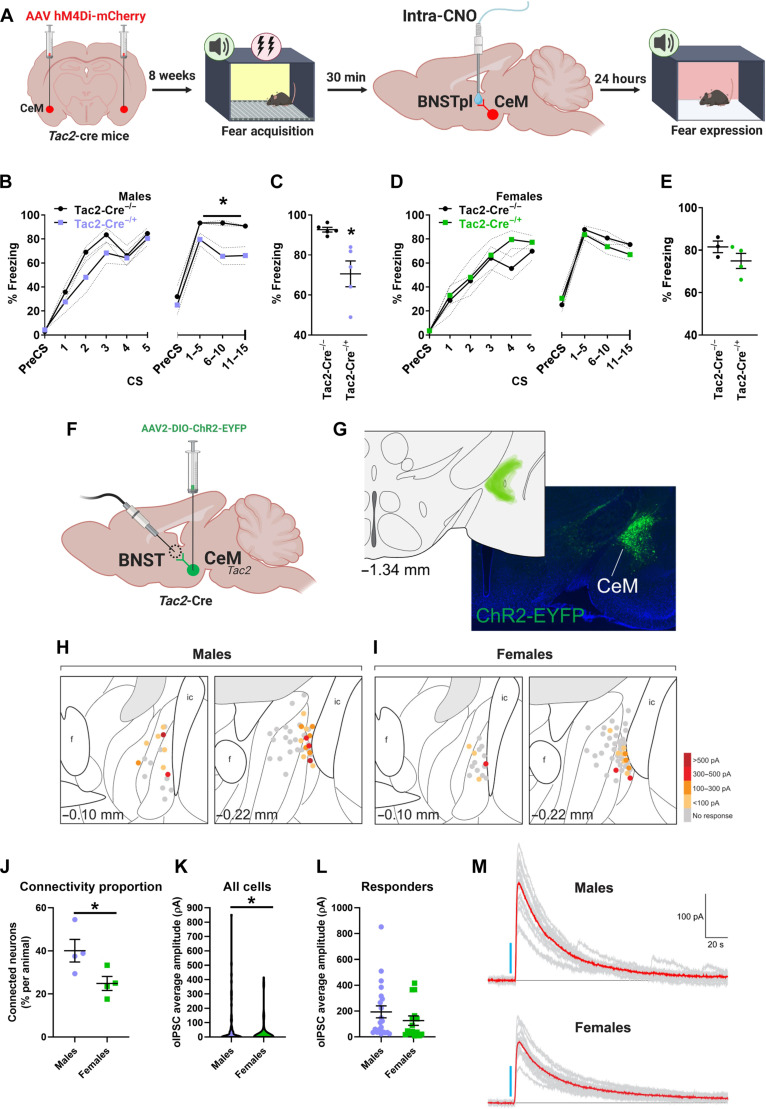
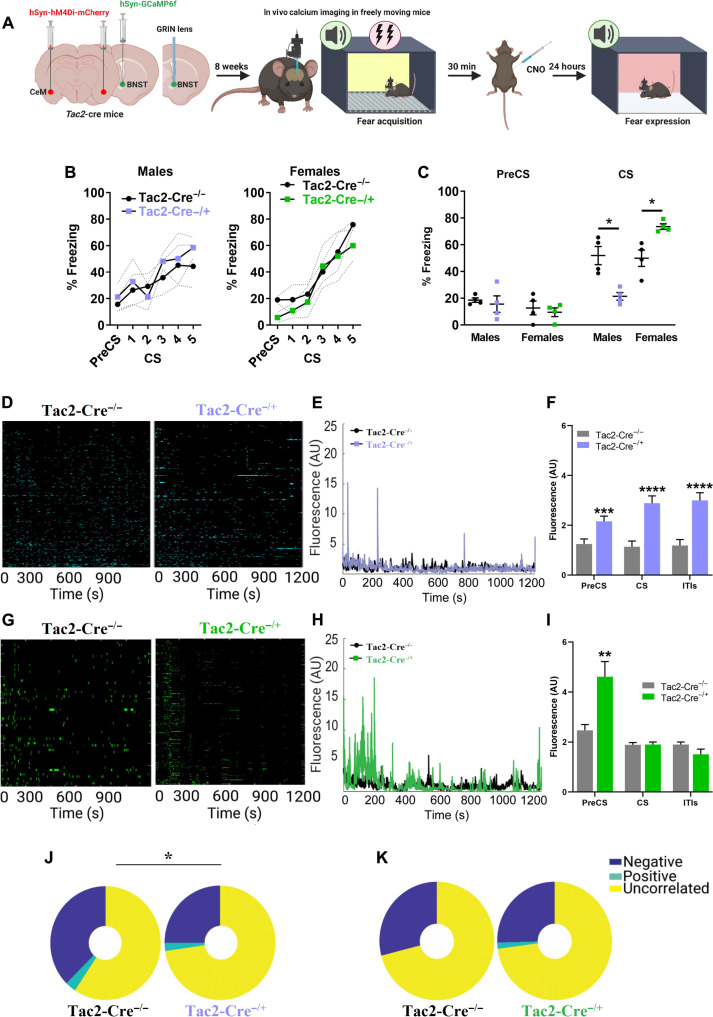
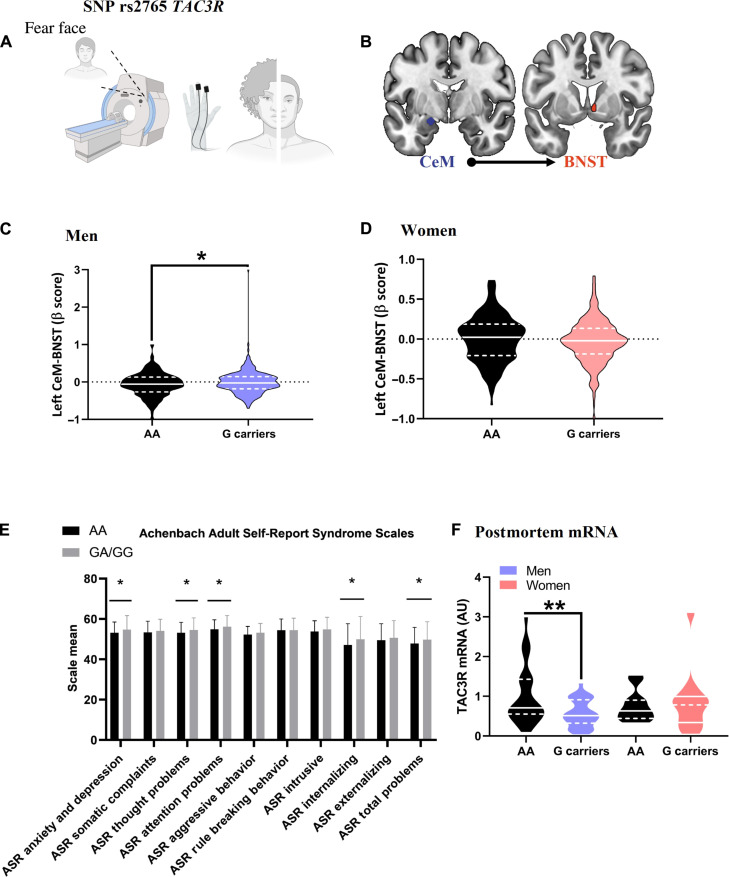
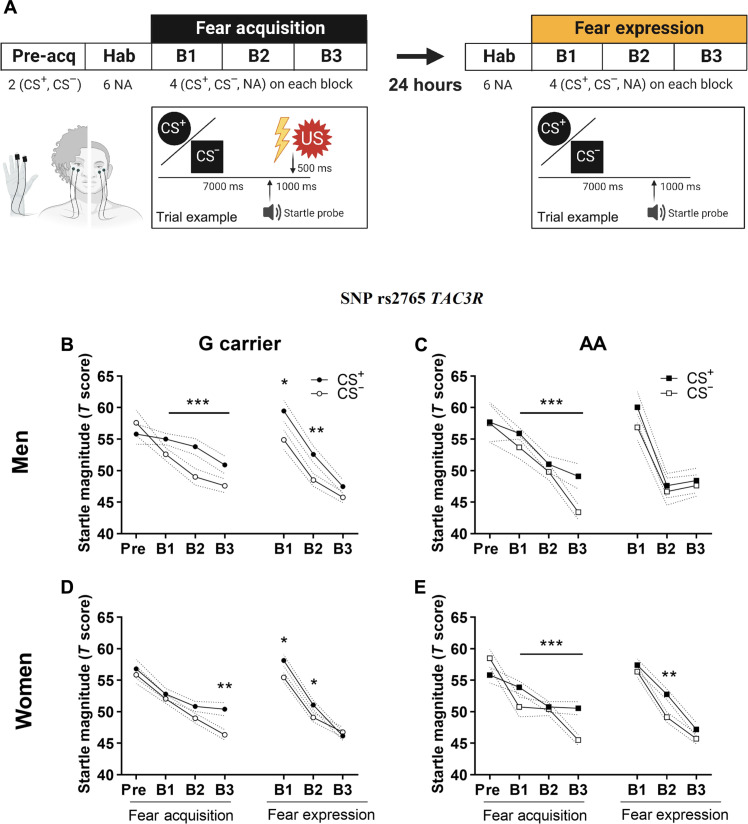
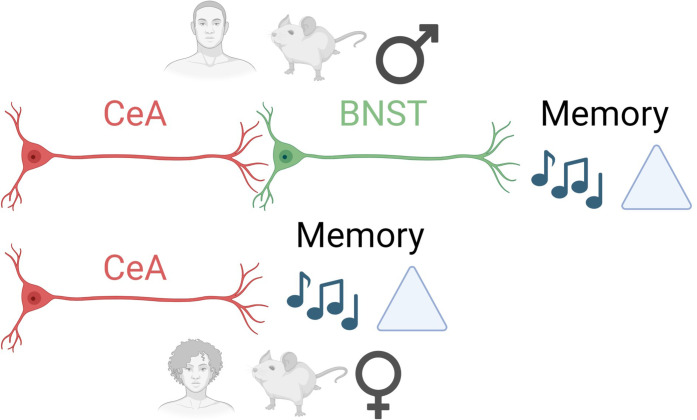
It remains unexplored in the field of fear memory whether functional neuronal connectivity between two brain areas is necessary for one sex but not the other. Here, we show that chemogenetic silencing of centromedial (CeM)-Tac2 fibers in the lateral posterior BNST (BNSTpl) decreased fear memory consolidation in male mice but not females. Optogenetic excitation of CeM-Tac2 fibers in the BNSTpl exhibited enhanced inhibitory postsynaptic currents in males compared to females. In vivo calcium imaging analysis revealed a sex-dimorphic fear memory engram in the BNSTpl. Furthermore, in humans, the single-nucleotide polymorphism (SNP) in the Tac2 receptor (rs2765) (TAC3R) decreased CeM-BNST connectivity in a fear task, impaired fear memory consolidation, and increased the expression of the TAC3R mRNA in AA-carrier men but not in women. These sex differences in critical neuronal circuits underlying fear memory formation may be relevant to human neuropsychiatric disorders with fear memory alterations such as posttraumatic stress disorder.


Figures

Fig. 1.
Fig. 1.. Males exhibit denser projections of CeM-Tac2 to the lateral posterior BNST.
(A) Schematic timeline of the procedure. Created with BioRender.com. (B) Distribution of mCherry expression across the mouse brain in males and females following infection of CeM-Tac2 neurons with hM4Di-mCherry in cFos expressing regions. (C) Representative confocal image of the lateral posterior BNST (or STPL) in a male mouse infected with hM4Di-mCherry in CeM-Tac2 neurons. (D) Representative confocal image of the lateral posterior BNST in a female mouse infected with hM4Di-mCherry in CeM-Tac2 neurons. (E) Schematic depiction of the H129ΔTK-TT inoculation in the CeM. Created with BioRender.com. (F) Representative confocal image showing tdTomato (tdT) expression in the lateral posterior BNST of female and male mice. (G) Distribution of tdT expression in target areas from CeM-Tac2 neurons in male and female mice. Data were analyzed using t test or Mann-Whitney’s U. *P < 0.05, **P < 0.01, and ***P < 0.001. AU, arbitrary units.
Fig. 2.
Fig. 2.. cFos correlational analyses upon CeM-Tac2 temporal inhibition after FA.
(A) High and significant correlations of cFos expression between areas in Tac2-Cre−/− males and (B) Tac2-Cre−/+ males. (C) Heatmaps representing Pearson correlation coefficients of cFos expression between areas in Tac2-Cre−/− males and (D) Tac2-Cre−/+ males. (E) High and significant correlations of cFos expression between areas in Tac2-Cre−/− females and (F) Tac2-Cre−/+ females. (G) Heatmaps representing Pearson correlation coefficients of cFos expression between areas in Tac2-Cre−/− females and (H) Tac2-Cre−/+ females. Data were analyzed using Pearson’s R coefficient. *P < 0.05, **P < 0.01, and ***P < 0.001.
Fig. 3.
Fig. 3.. Silencing Tac2 neurons projecting from CeM to the lateral posterior BNST.
(A) Experimental timeline. Created with BioRender.com. (B and C) Fear acquisition and FE in male mice receiving local-lateral posterior BNST (or STPL) CNO infusion after FA. (D and E) Fear acquisition and FE in female mice receiving local-lateral posterior BNST CNO infusion after FA. (F) Schematic representation of the slice electrophysiology experimental setup. Created with BioRender.com. (G) Representative image of viral infection and accurate targeting of the CeM in Tac2-Cre−/+ mice. (H and I) Schematic of the anatomical location of representative traces of electrophysiological recordings in male (left) and female (right) mice. Dots represent the location of recorded neurons in the BNSTpl of Tac2-Cre−/+ mice relative to major anatomical landmarks. Color code represents the range of amplitudes of optically evoked inhibitory postsynaptic currents (oIPSCs). Anatomical schematics based on Paxinos and Franklin’s The Mouse Brain in Stereotaxic Coordinates, 2012. ic, internal capsule; f, fornix. (J) Percentage of connected neurons per animal (in males: 21 cells from four mice; in females: 15 cells from four mice). (K) Mean oIPSC amplitudes across all recorded cells (males: 54 cells; females: 63 cells) and (L) mean oIPSC amplitudes specifically in responders (in males: 21 cells; in females: 15 cells). (M) Representative traces of electrophysiological recordings of oIPSC in male (top) and female (bottom) mice. Data are shown as mean ± SEM and analyzed using repeated measures ANOVA or Mann-Whitney’s U. *P < 0.05.
Fig. 4.
Fig. 4.. Silencing Tac2 neurons in the CeM reduces the proportion of significant correlations of calcium traces with freezing in males but does not affect this proportion in females.
(A) Schematic timeline of the procedure. Created with BioRender.com. (B) Tac2-Cre−/− and Tac2-Cre−/+ males and females show no differences during FA. (C) The average freezing during the preCS and all the CS was measured in FE. Temporarily silencing Tac2 neurons in the CeM reduces memory consolidation in males and enhances it in females. (D) Heatmap representing the fluorescence of each neuron throughout the FE session in males. (E) Raw fluorescence in the lateral posterior BNST during the FE session in males. (F) Average raw fluorescence in males during the preCS, tone, and ITI. (G) Heatmap representing the fluorescence of each neuron throughout the FE session in females. (H) Raw fluorescence in the lateral posterior BNST (or STPL) during the FE session in females. (I) Average raw fluorescence in females during the preCS, tone, and ITI. (J) The proportion of neurons correlating with freezing in Tac2-Cre−/− and Tac2-Cre−/+ males during the tone in FE. (K) The proportion of neurons correlating with freezing in Tac2-Cre−/− and Tac2-Cre−/+ females during the tone in FE. Data are shown as mean ± SEM and analyzed using repeated measures ANOVA, Mann-Whitney’s U, or Pearson’s chi-square test. *P < 0.05, **P < 0.01, ***P < 0.001, and ****P < 0.0001.
Fig. 5.
Fig. 5.. The TAC3R SNP rs2765 decreases functional connectivity between the CeM and the lateral posterior BNST during threatening stimuli processing and reduces TAC3R mRNA expression in men but not in women.
(A) Schematic representation of the experimental procedure. Created with BioRender.com. (B) Representative functional magnetic resonance imaging (fMRI) images illustrating the connectivity studied. (C) Left-CeM-BNST activation of the CeM and the BNST during the Hariri task in men. (D) Left-CeM-BNST activation of the CeM and the BNST during the Hariri task in women. (E) Achenbach Adult Self Report Syndrome Scales (ASR) for men. (F) Postmortem brain tissue analysis of TAC3R mRNA expression in men and women with and without the SNP. Data are presented as mean ± SEM except for (F), which is shown as mean ± SD; analyzed using one-way ANOVA, t test, Wald’s chi-square, or Mann-Whitney’s U. *P < 0.05 and **P < 0.01.
Fig. 6.
Fig. 6.. Fear potentiated startle response with the TAC3R SNP rs2765 in men and women.
(A) Schematic representation of the 2-day differential FA and FE task. B1, B2, and B3: block; CS+: reinforced CS; CS: unreinforced CS; Hab: habituation phase; NA: noise alone; pre-acq: pre-acquisition phase; US: unconditioned stimulus. Created with BioRender.com. (B) G carrier men discriminated between the CS+ and CS in the FA and FE. (C) AA carrier men discriminated between the CS+ and CS in the FA but not in the FE. (D) G carrier women and (E) AA carrier women discriminated between the CS+ and CS in the FA and FE. Asterisks above a line indicate significant main effect discrimination (CS+ versus CS comparisons). Asterisks with no line indicate significant interaction between discrimination (CS+ versus CS) and specific blocks of trials. Data were analyzed using repeated measures ANOVA. *P < 0.05, **P < 0.01, and ***P < 0.001.
Fig. 7.
Fig. 7.. Graphical abstract.
We describe sex differences in neural projections for memory formation in both mice and humans.

References

    1. Kandel E. R., The molecular biology of memory storage: A dialogue between genes and synapses. Science 294, 1030–1038 (2001). - PubMed
    1. Kandel E. R., Dudai Y., Mayford M. R., The molecular and systems biology of memory. Cell 157, 163–186 (2014). - PubMed
    1. Velasco E. R., Florido A., Milad M. R., Andero R., Sex differences in fear extinction. Neurosci. Biobehav. Rev. 103, 81–108 (2019). - PMC - PubMed
    1. Johansen J. P., Cain C. K., Ostroff L. E., Ledoux J. E., Molecular mechanisms of fear learning and memory. Cell 147, 509–524 (2011). - PMC - PubMed
    1. Flores Á., Fullana M. À., Soriano-Mas C., Andero R., Lost in translation: How to upgrade fear memory research. Mol. Psychiatry 23, 2122–2132 (2018). - PubMed

Publication types