. 2024 Jul 12;10(28):eadk5462.
doi: 10.1126/sciadv.adk5462. Epub 2024 Jul 10.

Monoallelic de novo AJAP1 loss-of-function variants disrupt trans-synaptic control of neurotransmitter release

Affiliations

Monoallelic de novo AJAP1 loss-of-function variants disrupt trans-synaptic control of neurotransmitter release

Simon Früh et al. Sci Adv. .

Abstract

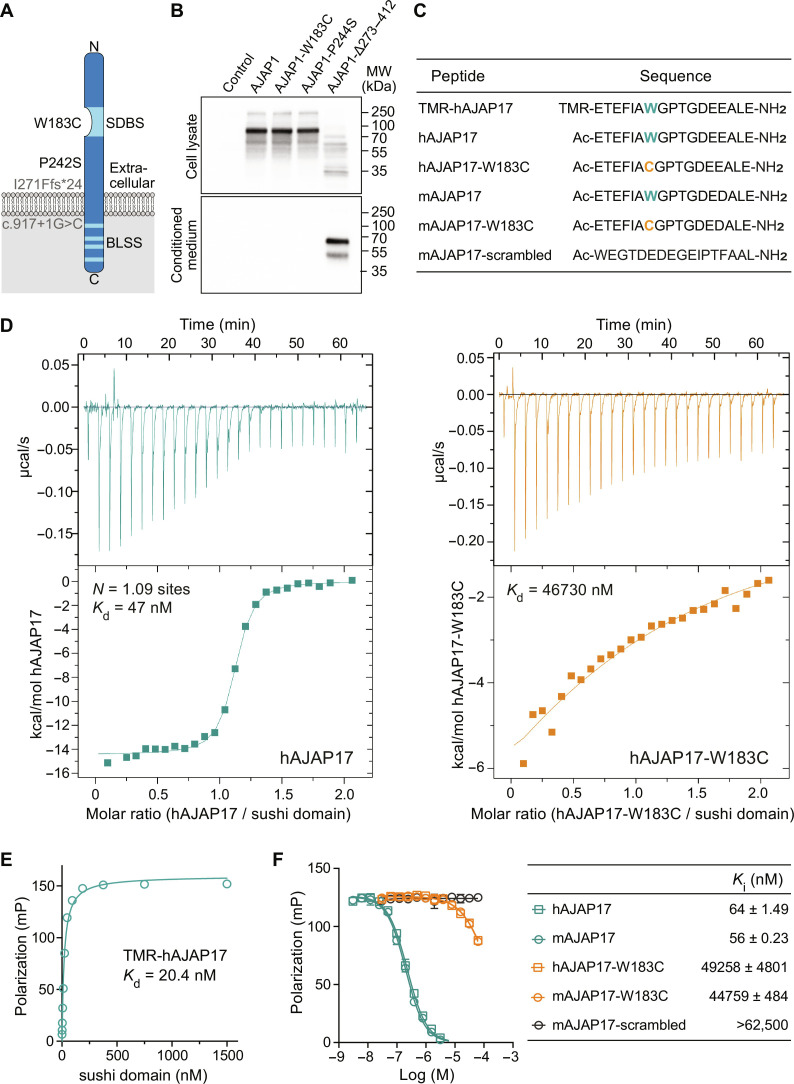
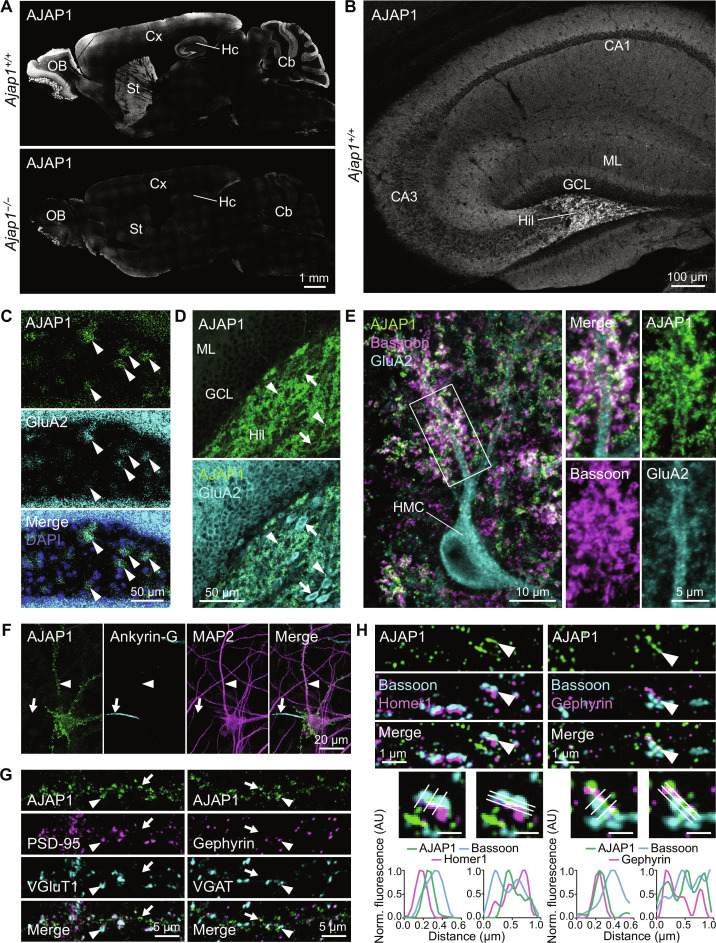
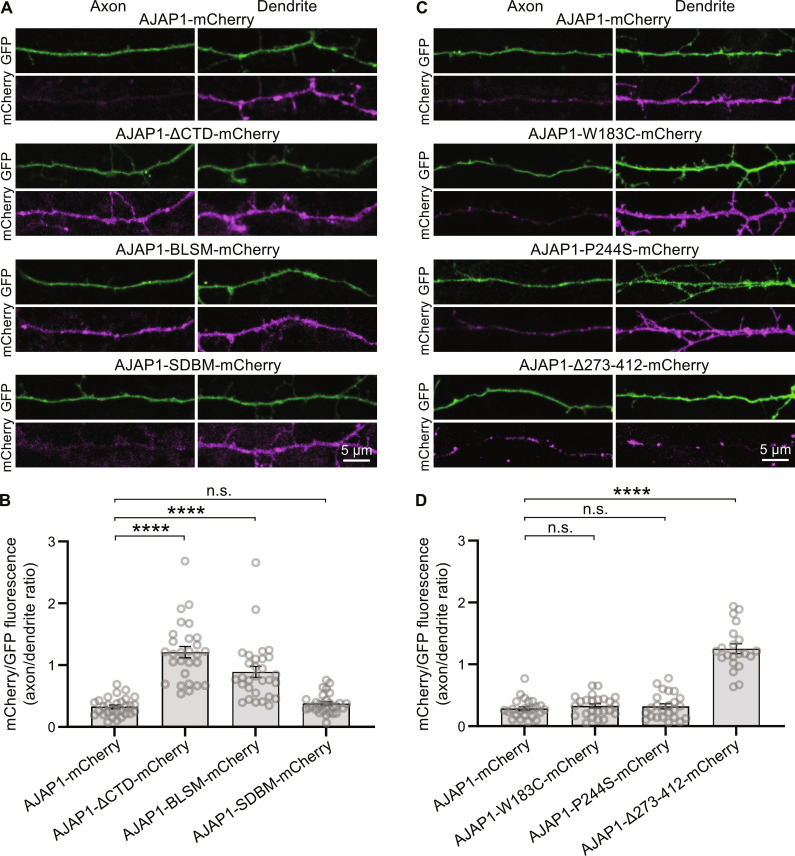
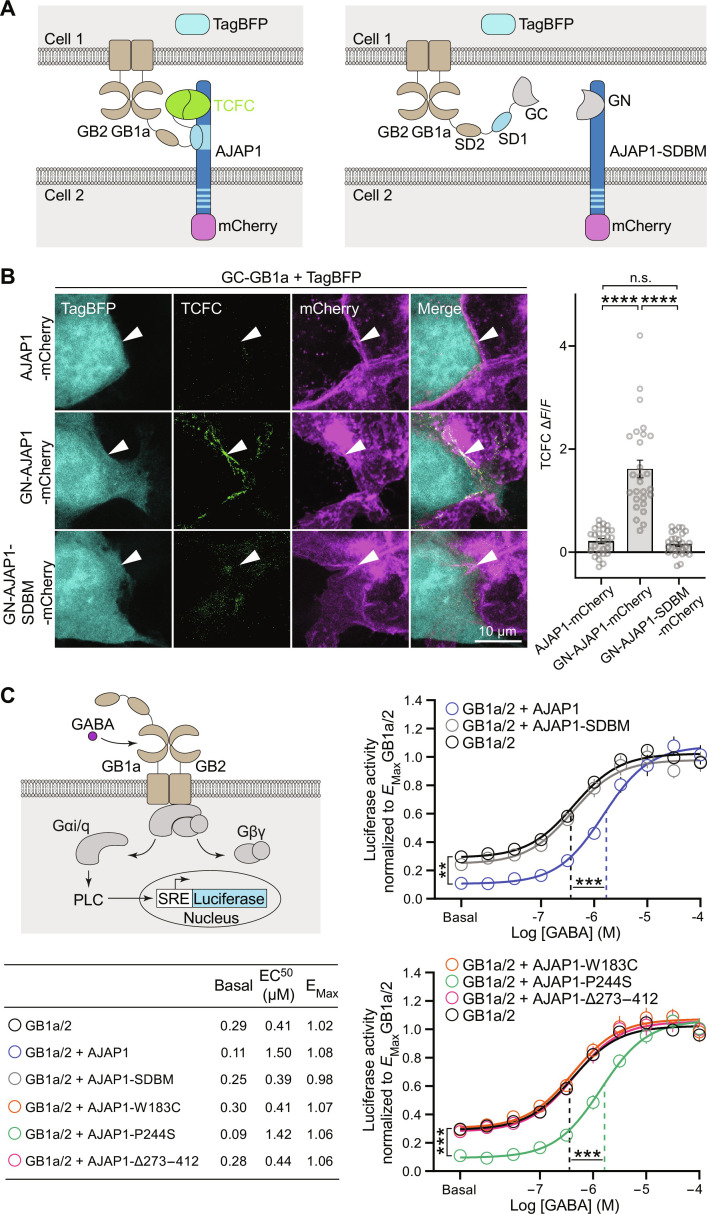
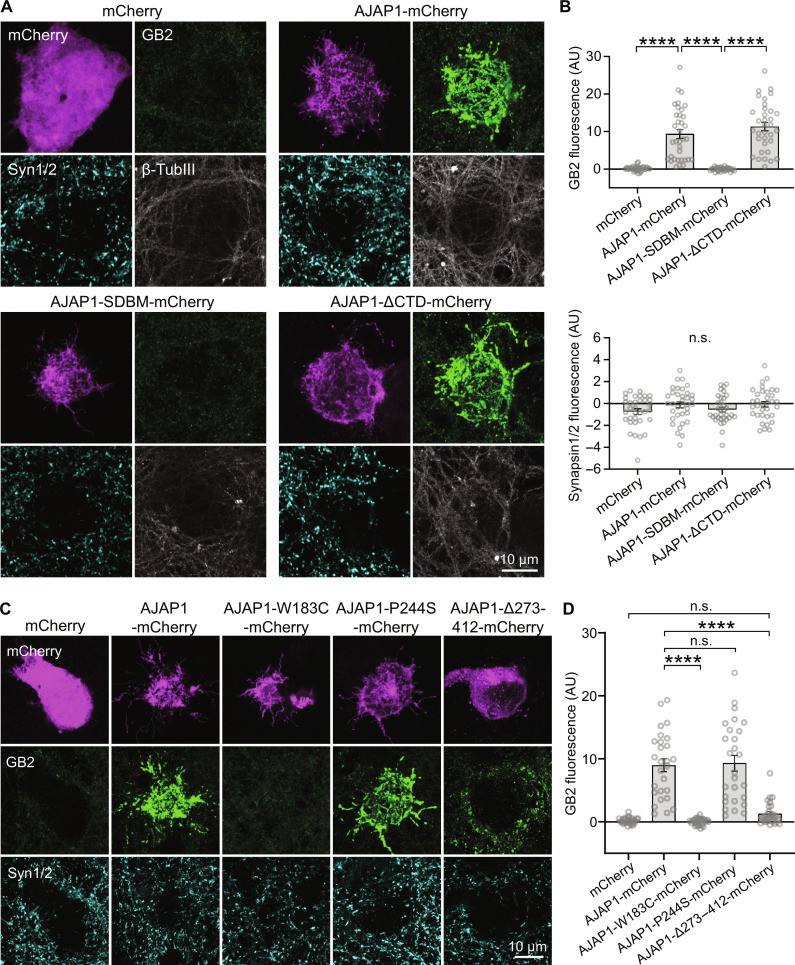
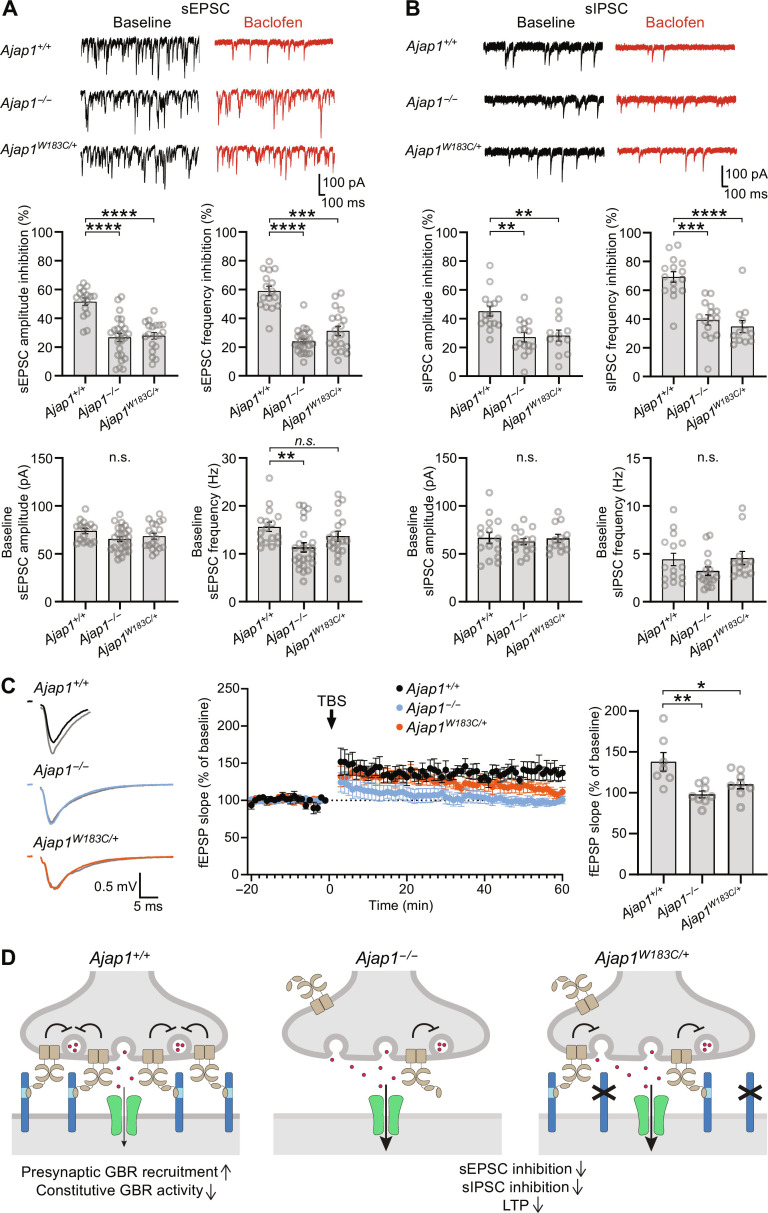
Adherens junction-associated protein 1 (AJAP1) has been implicated in brain diseases; however, a pathogenic mechanism has not been identified. AJAP1 is widely expressed in neurons and binds to γ-aminobutyric acid type B receptors (GBRs), which inhibit neurotransmitter release at most synapses in the brain. Here, we show that AJAP1 is selectively expressed in dendrites and trans-synaptically recruits GBRs to presynaptic sites of neurons expressing AJAP1. We have identified several monoallelic AJAP1 variants in individuals with epilepsy and/or neurodevelopmental disorders. Specifically, we show that the variant p.(W183C) lacks binding to GBRs, resulting in the inability to recruit them. Ultrastructural analysis revealed significantly decreased presynaptic GBR levels in Ajap1-/- and Ajap1W183C/+ mice. Consequently, these mice exhibited reduced GBR-mediated presynaptic inhibition at excitatory and inhibitory synapses, along with impaired synaptic plasticity. Our study reveals that AJAP1 enables the postsynaptic neuron to regulate the level of presynaptic GBR-mediated inhibition, supporting the clinical relevance of loss-of-function AJAP1 variants.


Figures

Fig. 1.
Fig. 1.. In vitro characterization of AJAP1 variants.
(A) Scheme depicting patient AJAP1 variants. The W183C variant is located in the SDBS. The P242S variant, corresponding to mouse AJAP1-P244S, affects a residue in the extracellular domain. Hypothetical proteins are depicted in gray. The possible protein product of the p.I271Ffs*24 variant, corresponding to mouse AJAP1-Δ273–412, is hypothesized to generate a protein lacking both the transmembrane domain and the intracellular domain containing BLSS. The AJAP1 splice variant c.917+1G>C is hypothesized to generate a protein lacking the intracellular domain after Cys306. However, both I271Ffs*24 and c.917+1G>C may also trigger nonsense-mediated decay. (B) Immunoblots of mouse AJAP1 variants expressed under identical conditions in HEK293T cells. Top: Cell lysates of AJAP1-, AJAP1-W183C–, and AJAP1-P244S–expressing cells. Bottom: Secreted AJAP1-Δ273–412 protein in conditioned cell culture medium. AJAP1 proteins were detected using a polyclonal anti-AJAP1 antibody (AF7970, R&D Systems). (C) Human (h) and mouse (m) AJAP17 and AJAP17-W183C peptides used in binding experiments. The W183C variant is highlighted in color. TMR-hAJAP17 is N-terminally labeled with the fluorophore Tamra; mAJAP17-scrambled served as a negative control in binding experiments. (D) Representative ITC diagrams of sushi domain protein (9) in solution with increasing amounts of hAJAP17 (blue) or hAJAP17-W183C (orange) peptides. Raw heat signatures (top) and integrated molar heat release (bottom) are shown. The calculated stoichiometry (N) and the Kd are indicated. (E) Saturation binding of sushi domain protein to TMR-hAJAP17 (25 nM) determined by FP analysis. (F) Competition of TMR-hAJAP17 (25 nM) at sushi domain protein (40 nM) by increasing concentrations of unlabeled peptides determined by FP analysis. Ki values are given in the table as means ± SEM.
Fig. 2.
Fig. 2.. Cellular and subcellular AJAP1 expression in mouse brain.
(A) AJAP1 immunofluorescence in midsagittal brain section. AJAP1 is abundant in hippocampus (Hc), cerebellum (Cb), cortex (Cx), striatum (St), and olfactory bulb (OB). Antibody AF7970 specificity was controlled using sections of Ajap1−/− mice. (B) Confocal image of AJAP1 immunofluorescence in midsagittal hippocampus. CA1 and CA3 subfields, molecular layer (ML), granule cell layer (GCL) and the hilus of the dentate gyrus (Hil) are labeled. (C) RNA-FISH for AJAP1 and GRIA2 (GluA2), a marker of HMCs, on coronal sections of the dentate gyrus. Colocalization of AJAP1 and GRIA2 transcript fluorescence in the hilus (arrowheads) suggests AJAP1 expression by HMCs. (D) AJAP1 immunofluorescence labeling in the dentate gyrus. AJAP1 labeling is intense in neuropil of hilus (arrowheads) and on GluA2-positive cell bodies (arrows). (E) AJAP1, GluA2, and Bassoon immunofluorescence at HMCs. AJAP1 localizes to synaptic structures on mossy cell dendrites adjacent to the presynaptic marker Bassoon. (F) Subcellular distribution of AJAP1 immunofluorescence in cultured mouse hippocampal neurons at day in vitro 21 (DIV 21). AJAP1 displays a punctate distribution in dendrites (MAP2, arrowhead) and is absent from axons (Ankyrin-G, arrow). (G) Dendrites of cultured hippocampal neurons immunolabeled for AJAP1 and markers for glutamatergic (PSD-95, VGluT1) and GABAergic (Gephyrin, VGAT) synapses. Arrowheads indicate colocalization, arrows denote absence of colocalization. (H) Structured illumination microscopy (SIM) imaging of AJAP1 in DIV 21 cultured hippocampal neurons with colabeling of the presynaptic marker Bassoon and the postsynaptic markers Homer1 and Gephyrin. AJAP1 shows a punctate distribution in proximal dendrites and partly colocalizes with synaptic markers. In selected synapses (arrowheads), AJAP1 labeling is found between pre- and postsynaptic markers, consistent with localization at the postsynaptic membrane. Graphs represent perpendicular and parallel mean fluorescence intensity profiles along the three lines of selected synapses. Bar graphs in enlarged areas, 500 nm.
Fig. 3.
Fig. 3.. Intracellular sorting signals target AJAP1 to the dendrites.
(A) Axonal versus dendritic sorting of AJAP1-mCherry fusion constructs expressed in cultured hippocampal neurons. AJAP1-mCherry constructs were coexpressed with the volume marker GFP at DIV 7 and fluorescence intensities quantified after 4 days. AJAP1-mCherry and AJAP1-SDBM-mCherry exhibit a dendritic localization. AJAP1-ΔCTD-mCherry and AJAP1-BLSM-mCherry lacking BLSS are distributed to axons and dendrites. (B) Ratios of mCherry fluorescence normalized to GFP between axons and dendrites for constructs shown in (A). ****P < 0.0001, n.s., P > 0.05, Kruskal-Wallis and Dunn’s multiple comparisons test, n = 28 to 30 cells per condition. (C) Subcellular sorting of AJAP1 variants expressed in cultured hippocampal neurons. AJAP1-W183C-mCherry and AJAP1-P244S-mCherry exhibit a dendritic localization. AJAP1-∆273–412-mCherry lacking BLSS is distributed to axons and dendrites. (D) Ratios of mCherry fluorescence normalized to GFP between axons and dendrites for constructs shown in (C). n.s., P > 0.05, ****P < 0.0001, Kruskal-Wallis test and Dunn’s multiple comparisons test, n = 21 to 24 cells per condition.
Fig. 4.
Fig. 4.. Allosteric modulation of GB1a/2 receptors by AJAP1 variants in trans.
(A) Scheme of transcellular fluorescence complementation (TCFC) between GN-AJAP1-mCherry and GC-GB1a expressed in separate pools of transfected HEK293T cells. Binding of the N-terminal sushi domain 1 (SD1) to the SDBS of AJAP1 trans-cellularly reconstitutes the superfolder GFP fragments GFP1–10 (GN) and GFP11 (GC). AJAP1-SDBM with an inactivated SDBS does not lead to TCFC. TagBFP and mCherry identify GB1a/2 and AJAP1 expressing cells, respectively. (B) GN-AJAP1-mCherry but not GN-AJAP1-SDBM-mCherry or AJAP1-mCherry lead to TCFC with GC-GB1a. Arrowheads point at interfaces of AJAP1 and GB1a/2 expressing cells. For quantification of TCFC, the GFP fluorescence at cell interfaces was normalized to the background fluorescence (ΔF/F). n.s., P > 0.05, ****P < 0.0001, Kruskal-Wallis test, Dunn’s multiple comparisons test, n = 27 cells per condition. (C) AJAP1 is a NAM of GB1a/2 receptors in trans. Left: Assay monitoring phospholipase C (PLC)–dependent firefly luciferase expression under control of the serum response element (SRE). GB1a/2 receptors are coupled to PLC through the chimeric G protein subunit Gαi/q. Right: GABA-response curves of HEK293T cells expressing GB1a/2 receptors in the presence of cells with and without AJAP1 constructs. GABA-response curves of cells expressing GB1a/2 receptors exposed to cells expressing AJAP1 exhibited significantly reduced constitutive and agonist-induced receptor activity but no change in maximal efficacy (EMax, P = 0.196, Kruskal-Wallis test and Dunn’s multiple comparisons test). AJAP1-SDBM and the variants AJAP1-W183C and AJAP1-∆273–412 but not AJAP1-P244S failed to allosterically regulate GB1a/2 receptor activity in trans (versus GB1a/2). **P < 0.01, ***P < 0.001; one-way analysis of variance (ANOVA) and Tukey’s multiple comparisons test (constitutive activity), Kruskal-Wallis and Dunn’s multiple comparisons test (agonist-induced, EC50); n = 10 cell culture preparations per condition.
Fig. 5.
Fig. 5.. Recruitment of neuronal GBRs by AJAP1 variants in trans.
(A) Transcellular recruitment of neuronal GBRs to HEK293T cells expressing AJAP1 constructs. HEK293T cells expressing AJAP1-mCherry, AJAP1-SDBM-mCherry or AJAP1-ΔCTD-mCherry were cocultured for 36 hours with hippocampal neurons (DIV12). Immunolabeling for GB2 shows a strong transcellular recruitment of GBRs to the soma of HEK293T cells expressing AJAP1-mCherry and AJAP1-ΔCTD-mCherry but not AJAP1-SDBM-mCherry. AJAP1-expressing cells did not recruit Synapsin1/2. β-TubulinIII was used as a marker for neurites. (B) GB2 and Synapsin1/2 immunofluorescence at the soma of HEK293T cells expressing AJAP1 constructs. The background fluorescence in areas devoid of transfected HEK293T cells was subtracted. n.s., P > 0.05, ****P < 0.0001, Welch’s ANOVA, Dunnett’s T3 multiple comparisons test (GB2), Kruskal-Wallis test and Dunn’s multiple comparisons test (Synapsin1/2), n = 33 to 35 cells per condition. (C) Transcellular recruitment of neuronal GBRs to HEK293T cells expressing AJAP1-mCherry and the variants AJAP1-W183C-mCherry, AJAP1-P244S-mCherry, and AJAP1-Δ273–412-mCherry. (D) GB2 immunofluorescence at the soma of HEK293T cells expressing AJAP1 variants. n.s., P > 0.05, ****P < 0.0001, Kruskal-Wallis test and Dunn’s multiple comparisons test, n = 27 to 28 cells per condition.
Fig. 6.
Fig. 6.. Reduction in presynaptic GBRs in Ajap1−/− and Ajap1W183C/+ mice.
(A) Immunolabeling in the hilus of Ajap1−/− and Ajap1+/+ mice and quantification of GB1a puncta density and size in the neuropil. **P < 0.01, ****P < 0.0001, unpaired t test (density), Kolmogorov-Smirnov test (size), n = 15 sections per genotype (density), n = 1267 puncta (Ajap1+/+), n = 66 puncta (Ajap1−/−), five mice per genotype. Box plots 25th to 75th percentiles, whiskers 10th to 90th percentiles, and line indicates median. (B) Immunolabeling in Ajap1W183C/+ and Ajap1+/+ mice and quantification of GB1 puncta density and size. ***P < 0.001, ****P < 0.0001, Mann-Whitney test (density), Kolmogorov-Smirnov test (size), n = 15 sections per genotype (density), n = 1818 puncta (Ajap+/+), n = 291 puncta (Ajap1W183C/+), five mice per genotype. Box plots as in (A). (C) Electron microscopic quantification of GBRs at putative granule cell/HMC synapses in the hilus apex using pre-embedding immunogold labeling. Top: GB2 labeling in pre- and postsynaptic elements at asymmetrical synapses (arrows). Blue area indicates HMC dendrites. MB, mossy fiber bouton; TE, thorny excrescences. Middle: Serial section reconstructions of HMC dendrites showing pre- (red) and postsynaptic (yellow) GB2 particles (active zones in pink). Bottom: Ajap1−/− and Ajap1W183C/+ mice contain fewer immunogold particles at presynaptic elements, resulting in a significantly decreased pre- to postsynaptic particle ratio. GB2 particle density in active zones is lower in Ajap1−/− and Ajap1W183C/+ versus Ajap1+/+ mice. Synapse density (active zones per length of postsynaptic membrane) is similar among genotypes. n.s., P > 0.05, *P < 0.05, **P < 0.01, ****P < 0.0001, Welch’s ANOVA and Dunnett’s T3 multiple comparisons test (GB2 particle ratio); Kruskal-Wallis test and Dunn’s multiple comparisons test (GB2 particle density active zones); Kruskal-Wallis test (synapse density); n = 4 dendritic segments from two mice per genotype (GB2 particle ratio and synapse density), n = 35 to 45 active zones from two mice per genotype (GB2 particle density in active zones).
Fig. 7.
Fig. 7.. Reduced presynaptic GBR inhibition in Ajap1−/− and Ajap1W183C/+ mice.
(A) Baclofen-induced inhibition of sEPSC amplitude and frequency in HMCs, with representative traces and bar graphs depicting quantitative analysis. n.s., P > 0.05, **P < 0.01, ***P < 0.001, ****P < 0.0001, one-way ANOVA, Tukey’s multiple comparisons test (amplitude); Kruskal-Wallis test, Dunn’s multiple comparisons test (frequency); n = 16 to 24 cells from ≥3 mice per genotype. (B) Baclofen-induced inhibition of sIPSC amplitude and frequency in HMCs, with representative traces and bar graphs depicting quantitative analysis. n.s., P > 0.05, **P < 0.01, ***P < 0.001, ****P < 0.0001, one-way ANOVA, Tukey’s multiple comparisons test (amplitude); Kruskal-Wallis test, Dunn’s multiple comparisons test (frequency); n = 12 to 15 cells from ≥3 mice per genotype. Combined traces from Ajap1+/+ littermates of Ajap1−/− and Ajap1W183C/+ mice were used for statistical analysis of sEPSCs and sIPSCs. (C) Time course of fEPSP slopes (mean ± SEM) from hippocampal slices of Ajap1−/− (blue, n = 8 slices from six mice), Ajap1W183C/+ (orange, n = 8 slices from three mice), and Ajap1+/+ mice (black, n = 7 slices from five mice). Arrow indicates the time of theta-burst stimulation (TBS). Sample traces of fEPSPs before (black, blue, and orange) and after (gray) TBS are shown. Ajap1+/+ littermates of Ajap1−/− and Ajap1W183C/+ mice were pooled. Bar graph shows fEPSP slope 60 min after LTP induction normalized to baseline for the different genotypes. *P < 0.05, *P < 0.01, one-way ANOVA, Tukey’s multiple comparisons test. (D) Monoallelic AJAP1-W183C patient variant induces synaptopathy. Left: AJAP1 trans-synaptically recruits presynaptic GBRs by interacting with GB1a. NAM activity of AJAP1 limits constitutive GBR activity at high receptor density. Middle: Complete AJAP1 loss decreases presynaptic GBRs. Right: AJAP1-W183C fails to bind GB1a, reducing presynaptic GBRs. The reduction in presynaptic GBRs induced by the complete lack of AJAP1 or the AJAP1-W183C variant disinhibits neurotransmitter release and impairs synaptic plasticity.

References

    1. Bharti S., Handrow-Metzmacher H., Zickenheiner S., Zeitvogel A., Baumann R., Starzinski-Powitz A., Novel membrane protein shrew-1 targets to cadherin-mediated junctions in polarized epithelial cells. Mol. Biol. Cell 15, 397–406 (2004). - PMC - PubMed
    1. Lin N., Di C., Bortoff K., Fu J., Truszkowski P., Killela P., Duncan C., McLendon R., Bigner D., Gregory S., Adamson D. C., Deletion or epigenetic silencing of AJAP1 on 1p36 in glioblastoma. Mol. Cancer Res. 10, 208–217 (2012). - PMC - PubMed
    1. Anttila V., Winsvold B. S., Gormley P., Kurth T., Bettella F., McMahon G., Kallela M., Malik R., de Vries B., Terwindt G., Medland S. E., Todt U., McArdle W. L., Quaye L., Koiranen M., Ikram M. A., Lehtimaki T., Stam A. H., Ligthart L., Wedenoja J., Dunham I., Neale B. M., Palta P., Hamalainen E., Schurks M., Rose L. M., Buring J. E., Ridker P. M., Steinberg S., Stefansson H., Jakobsson F., Lawlor D. A., Evans D. M., Ring S. M., Farkkila M., Artto V., Kaunisto M. A., Freilinger T., Schoenen J., Frants R. R., Pelzer N., Weller C. M., Zielman R., Heath A. C., Madden P. A. F., Montgomery G. W., Martin N. G., Borck G., Gobel H., Heinze A., Heinze-Kuhn K., Williams F. M. K., Hartikainen A. L., Pouta A., van den Ende J., Uitterlinden A. G., Hofman A., Amin N., Hottenga J. J., Vink J. M., Heikkila K., Alexander M., Muller-Myhsok B., Schreiber S., Meitinger T., Wichmann H. E., Aromaa A., Eriksson J. G., Traynor B., Trabzuni D., North American Brain Expression Consortium, UK Brain Expression Consortium, Rossin E., Lage K., Jacobs S. B. R., Gibbs J. R., Birney E., Kaprio J., Penninx B. W., Boomsma D. I., van Duijn C., Raitakari O., Jarvelin M. R., Zwart J. A., Cherkas L., Strachan D. P., Kubisch C., Ferrari M. D., van den Maagdenberg A., Dichgans M., Wessman M., Smith G. D., Stefansson K., Daly M. J., Nyholt D. R., Chasman D., Palotie A., Genome-wide meta-analysis identifies new susceptibility loci for migraine. Nat. Genet. 45, 912–917 (2013). - PMC - PubMed
    1. Zhang M., Zhou X., Jiang W., Li M., Zhou R., Zhou S., AJAP1 affects behavioral changes and GABABR1 level in epileptic mice. Biochem. Biophys. Res. Commun. 524, 1057–1063 (2020). - PubMed
    1. Ikeda M., Tomita Y., Mouri A., Koga M., Okochi T., Yoshimura R., Yamanouchi Y., Kinoshita Y., Hashimoto R., Williams H. J., Takeda M., Nakamura J., Nabeshima T., Owen M. J., O'Donovan M. C., Honda H., Arinami T., Ozaki N., Iwata N., Identification of novel candidate genes for treatment response to risperidone and susceptibility for schizophrenia: Integrated analysis among pharmacogenomics, mouse expression, and genetic case-control association approaches. Biol. Psychiatry 67, 263–269 (2010). - PubMed

Publication types

MeSH terms