. 2024 Aug:106:105240.
doi: 10.1016/j.ebiom.2024.105240. Epub 2024 Jul 9.

Human effector CD8+ T cells with an activated and exhausted-like phenotype control tumour growth in vivo in a humanized tumour model

Affiliations

Human effector CD8+ T cells with an activated and exhausted-like phenotype control tumour growth in vivo in a humanized tumour model

Juliane Mietz et al. EBioMedicine. 2024 Aug.

Abstract

Background: Humanized tumour models could be particularly valuable for cancer immunotherapy research, as they may better reflect human-specific aspects of the interfaces between tumour and immune system of human cancer. However, endogenous antitumour immunity in humanized models is still largely undefined.

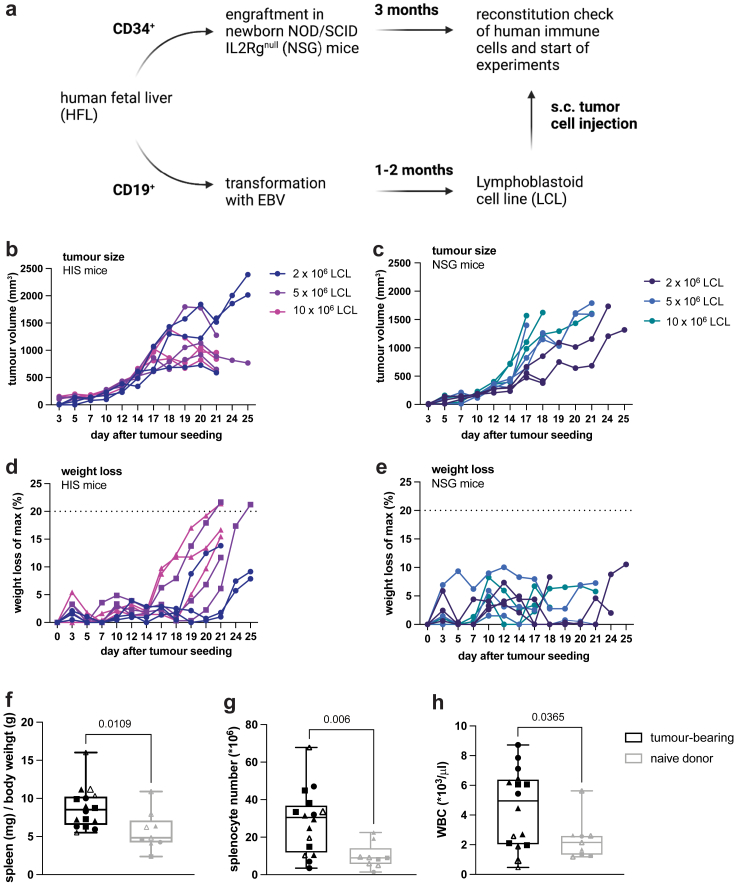
Methods: We established an autologous humanized mouse tumour model by using NSG mice reconstituted with human immune cells from hematopoietic progenitors and tumours generated from transformed autologous human B cells. We demonstrate growth of solid lymphoid tumours after subcutaneous implantation, infiltration by endogenous human immune cells and immunocompetence of the model.

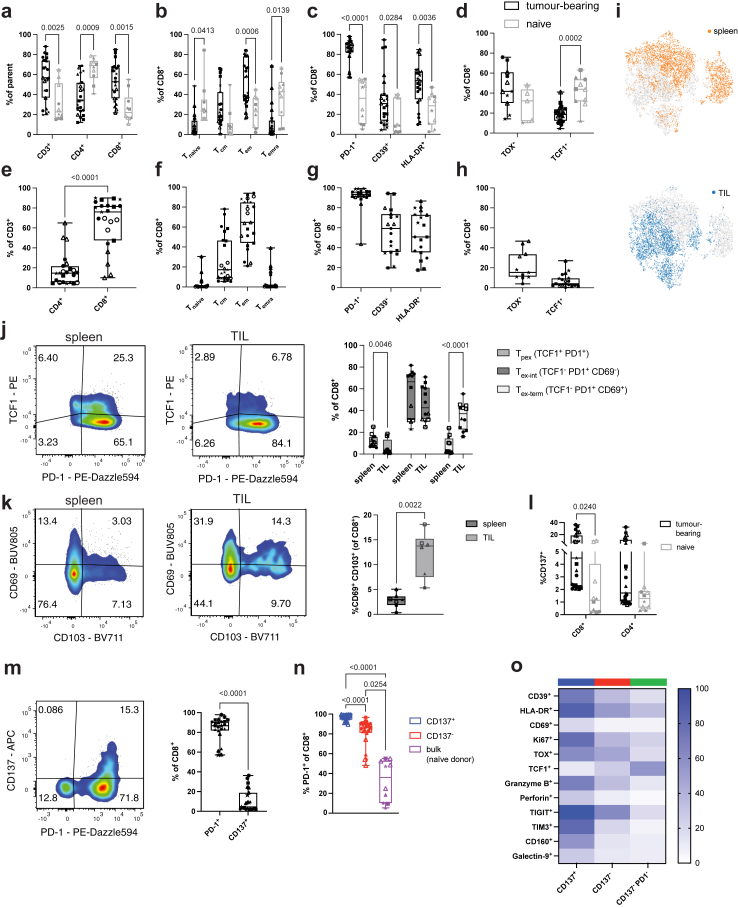
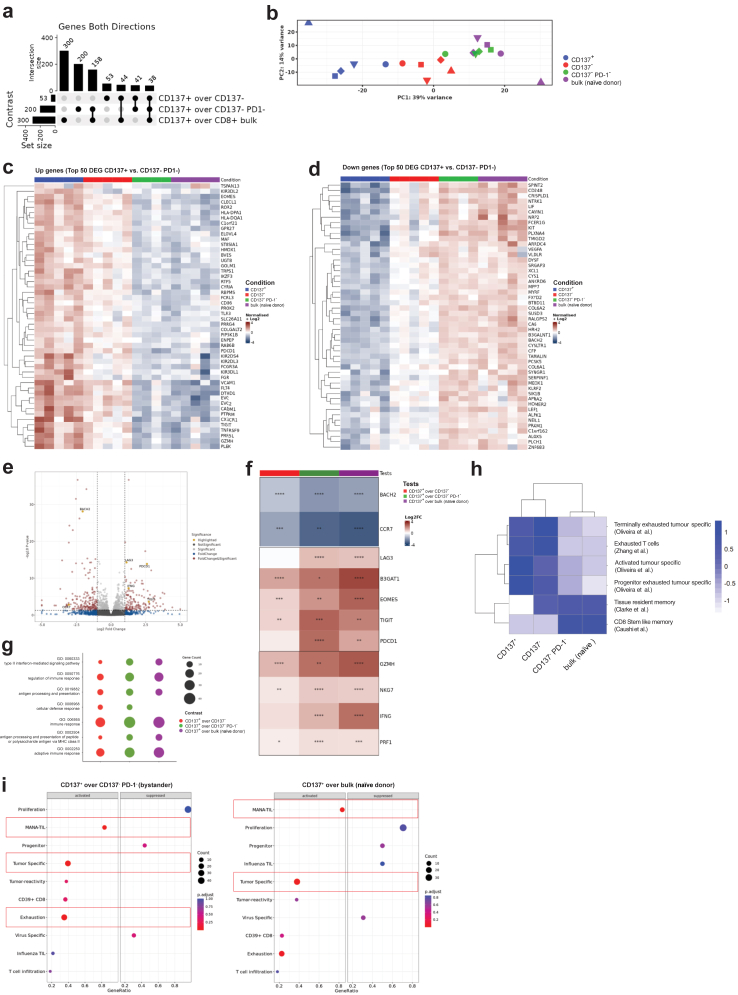
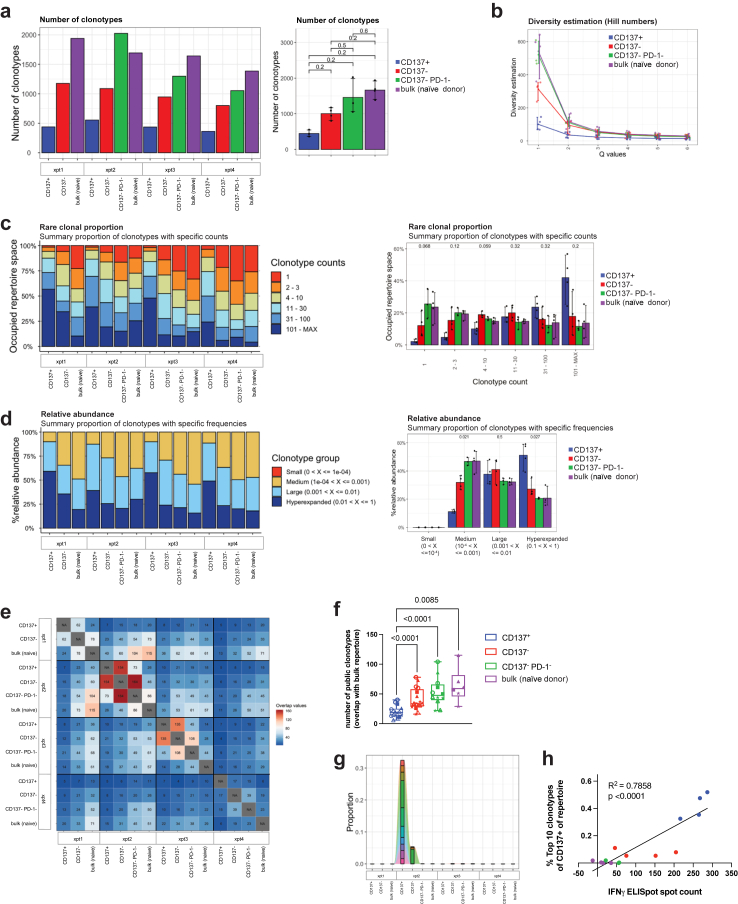
Findings: We found human T cell subsets described in human cancer, including progenitor exhausted (Tpex), terminally exhausted (Tex-term) and tissue-resident (TRM) cells in tumour-bearing humanized mice with accumulation of Tex-term and TRM in the tumour. In addition, we identified tumour-reactive CD8+ T cells through expression of CD137. This subpopulation of de novo arising human CD137+ CD8+ T cells displayed a highly proliferative, fully activated effector and exhausted-like phenotype with enhanced expression of activation and exhaustion markers like PD-1, CD39, CD160, TIM-3, TIGIT and TOX, the senescence marker CD57 (B3GAT1) and cytolytic effector molecules such as PRF1, GZMH and NKG7. Moreover, these CD137+ CD8+ T cells exhibited tumour-specific clonal expansion and presented signature overlap with tumour-reactive CD8+ T cells described in human cancer. We demonstrate superior anticancer activity of this activated and exhausted-like human CD8+ T cell subset by adoptive transfer experiments using recipients bearing autologous human tumours. Mice adoptively transferred with CD137+ CD8+ T cells showed reduced tumour growth and higher CD8+ T cell tumour infiltration, correlating with control of human tumours.

Interpretation: We established an immunocompetent humanized tumour model, providing a tool for immunotherapy research and defined effective anticancer activity of human effector CD8+ T cells with an activated and exhausted-like phenotype, supporting clinical exploration of such cells in adoptive T cell therapies.

Funding: Swiss Cancer Research foundation.

Keywords: Adoptive cell therapy; Exhaustion; Human cancer immunology; Humanized cancer models; Phenotypic markers; T cells.


Conflict of interest statement

Declaration of interests The authors declare that they have no competing interests.

Figures

Fig. 1
Fig. 1
LCL tumour growth kinetics and weight loss in autologous HIS mice and NSG mice. LCL tumours were injected subcutaneously into the flank of mice and tumour size was assessed by calipering. a, schematic of generation of HIS mice and autologous tumour cells and subsequent injection in HIS mice. b, tumour volume in HIS mice after implantation of the indicated number of LCLs. c, Tumour volume in NSG mice after implantation of the indicated number of LCLs. (d, e) Relative weight loss calculated based on the maximum weight during the experiment after tumour cell implantation of the indicated number of LCLs in HIS (d) or NSG (e) mice. f, ratio of spleen weight (mg) to body weight (g), g, total splenocyte number and h, white blood cell counts in HIS mice injected with 5 × 106 autologous LCL tumour cells or non-tumour bearing HIS mice (naïve) sacrificed 15–20 days after tumour implantation. b–e, n = 3 per tumour cell number, f-h, n(tumour-bearing) = 16, n(naïve) = 9 from 4 individual experiments, marked by individual symbols. Unpaired t-test, data shown as box and whiskers with the box from the 25 to 75 percentile and the median is shown as a line within the box; whiskers are shown from minimum to maximum data point.
Fig. 2
Fig. 2
T cell response in tumour-bearing HIS mice. Splenocytes (a-d) and tumour-infiltrating lymphocytes (TIL) (e–h) were isolated from HIS mice 16–18 days after tumour implantation and analysed by flow cytometry. a, frequency of splenic T cells in tumour-bearing or naïve HIS mice; parent population refers to frequency (%) of CD3+ T cells within human CD45+ cells and CD4+ and CD8+ T cells within CD3+ T cells. b, CD8+ T cell differentiation defined as Tnaïve (CD45RA+CD62L+), TCM (CD45RACD62L+), TEM (CD45RACD62L), TEMRA (CD45RA+CD62L) in tumour-bearing or naïve HIS mice. c and d, expression of indicated markers on CD8+ T cells from spleen of tumour-bearing or naïve HIS mice. e, frequency of CD4+ and CD8+ T cells within TILs, gated on total CD3+ T cells. f, CD8+ T cell differentiation within TILs. g and h, expression of indicated markers on CD8+ T cells within TILs. i, UMAP of CD8+ T cells from spleen and TIL of tumour-bearing HIS mice, coloured for tissue of origin. j, expression of PD-1 and TCF1 in spleen and TIL of tumour-bearing HIS mice and quantification of CD8+ Tpex (TCF1+PD1+), Tex-int (TCF1PD1+CD69), Tex-term (TCF1PD1+CD69+) in both tissues. k, expression of CD69 and CD103 in spleen and tumour of tumour-bearing HIS mice and quantification of TRM-like (CD69+CD103+) CD8+ T cells in both tissues. l, expression of CD137 on splenic CD8+ and CD4+ T cells of tumour-bearing or naïve HIS mice. m, expression and quantification of PD-1 and CD137 on splenic CD8+ T cells of tumour-bearing HIS mice. n, expression of PD-1 on splenic CD137+ or CD137- CD8+ T cells in tumour-bearing HIS mice or bulk CD8+ T cells from naïve HIS mice. o, expression of individual markers on splenic CD8+ T cell populations from tumour-bearing HIS mice based on expression of CD137 and PD-1. a–d: n(tumour-bearing) = 11–23, n(naïve) = 5–10, 2way ANOVA with Šídák's multiple comparison test. Data are pooled from 2 to 5 independent experiments. e–f: n = 11–23, from 2 to 5 independent experiments. e, paired t-test, f-h, no statistical test performed. j, n = 12, from 3 independent experiments. 2way ANOVA with Šídák's multiple comparison test. k, n = 8, from 3 independent experiments. Paired t-test. l, n(tumour-bearing) = 23, n(naïve) = 10, from 6 independent experiments. 2way ANOVA with Šídák's multiple comparison test. m, n = 23, from 6 independent experiments. Paired t-test. n, n(tumour-bearing) = 11–23, n(naïve) = 5–10, from 6 independent experiments. Kruskal–Wallis test. o, n = 8–23, from 3 to 6 independent experiments. 2way ANOVA with Šídák's multiple comparison test. For each experiment, a different HPC donor was used for HIS mouse reconstitution and generation of autologous tumour. Data from individual experiments are indicated by different symbols, with individual mice from the same experiment indicated by the same symbol.
Fig. 3
Fig. 3
Activated and exhausted-like human CD8+T cells derived from tumour-bearing HIS mice can be expanded ex vivo and exhibit superior tumour-specific cytokine production. a, schematic of generation, expansion and characterization of T cells from HIS mice bearing autologous LCL tumours. b, fold expansion of FACS sorted splenic CD8+ T cells from tumour-bearing HIS mice (CD137+, CD137- and CD137PD1-) or naïve HIS mice (bulk). c, CD8+ T cell differentiation after ex vivo expansion defined as Tnaïve (CD45RA+CD62L+), TCM (CD45RACD62L+), TEM (CD45RACD62L), TEMRA (CD45RA+CD62L). d, expression of indicated markers after ex vivo expansion. e, IFN-γ ELISpot of expanded T cells in 5:1 (E:T) co-culture with autologous LCL tumour cells for 24 h. Spot count is normalized to the spots produced by expanded CD8+ bulk T cells from naïve HIS mice. f, TNF⍺ ELISA of supernatant of expanded T cells in co-culture (5:1, E:T) with autologous LCL tumour cells for 24 h. TNF⍺ concentration is normalized to the TNF⍺ secretion from expanded CD8+ bulk T cells derived from naïve mice. b, n = 8–19, from 5 to 6 independent experiments. Matched 2way ANOVA with Tukey's multiple comparison test. c, n = 8–19, from 5 independent experiments. 2way ANOVA with Tukey's multiple comparison test. d, n = 5–8, from 4 independent experiments. 2way ANOVA with Tukey's multiple comparison test. e, n = 16–19, from 5 independent experiments. Mixed-effects analysis with matching and Tukey's multiple comparison test. f, n = 11, from 3 independent experiments. Repeated measures one-way ANOVA with Tukey's multiple comparison test. For each experiment, a different HPC donor was used for HIS mouse reconstitution and generation of autologous tumour. Data from individual experiments are indicated by different symbols, with individual mice from the same experiment indicated by the same symbol.
Fig. 4
Fig. 4
Transcriptomic profiling of tumour-reactive CD137+CD8+T cells. Transcriptome analysis and pathway analysis of expanded CD8+ T cells from tumour-bearing HIS mice (CD137+, CD137 and CD137PD1) or naïve HIS mice (bulk). a, Upset plot (intersect) showing number of differentially expressed genes between groups in bulk RNAseq. p(FDR) < 0.05, log2 FC > 1.5. b, PCA plot of RNAseq showing PC1 and PC2. c, Top 50 upregulated and d, downregulated genes of T cell subsets based on the DEG between CD137+ versus CD137PD1 CD8+ T cells. p(FDR) < 0.05, log2 FC > 1.5. e, Volcano plot showing DEG between CD137+ and CD137PD1 CD8+ T cells with genes of interest highlighted in yellow. f, differential expression of genes of interest between groups. g, Overrepresentation analysis (ORA) of upregulated pathways in CD137+ CD8+ T cells. h, Gene module score analysis of published signatures described on the right. i, Gene set enrichment analysis (GSEA) of signatures described on the y-axis. Gene ratio (# genes related to GO term/total number of sig genes) is displayed on the x-axis. Signatures with an adjusted p-value <0.05 are highlighted with a red box. Shown are data from 4 to 5 individual experiments, each experiment with different human HPC donor for reconstitution of HIS mice and autologous tumour.
Fig. 5
Fig. 5
TCR profiling of tumour-reactive CD137+CD8+T cells. a, total number of individual clonotypes found per population. Left: data from individual experiments, right: pooled data for group analysis. Kruskal–Wallis test with Holm-Bonferroni correction. b, TCR (CDR3 of TRA, TRB, TRG and TRD) sequence sample diversity estimation using Hill numbers method, with Q = 1 describing the Shannon diversity. c, rare clonal proportion showing the occupied repertoire space by clonotypes with defined counts (1, 2–3, 4–10, etc.). Left: data from individual experiments, right: pooled data for group analysis. Kruskal–Wallis test with Holm-Bonferroni correction. d, relative abundance of clonotypes with defined frequencies (size). Left: data from individual experiments, right: pooled data for group analysis. Kruskal–Wallis test with Holm-Bonferroni correction. e, repertoire overlap analysis cross-comparing every population from every experiment (each with different donor). f, repertoire overlap comparing the repertoire of bulk CD8+ T cells from naïve HIS mice to the populations from tumour-bearing HIS mice from individual experiments (each with different donor; data from individual experiments are indicated by different symbols). Mixed-effects analysis with Tukey's multiple comparisons test. g, tracking of clonotypes over populations. The top 10 most abundant clonotypes of the TCR repertoire of CD137+ CD8+ T cells from one representative experiment are shown. h, proportion of the top 10 most abundant clonotypes (from repertoires of CD137+ CD8+ T cells) in the repertoire of all populations, correlated with the spot count of IFN-γ ELISpot. Shown are data from 4 individual experiments, each experiment with different human HPC donor for reconstitution of HIS mice and autologous tumour. Correlation was determined by linear regression analysis.
Fig. 6
Fig. 6
CD137+CD8+T cells from tumour-bearing HIS mice show superior anticancer activity in NSG and HIS recipients bearing autologous tumours. a, schematic of generation of tumour-reactive T cells and subsequent ACT. NSG mice were injected with 2 × 106 LCL s.c. in the flank and after three days, 10 × 106ex vivo expanded T cells were adoptively transferred intravenously. Transferred T cells and LCL tumours were autologous to each other. b, tumour volume on the day of sacrifice in NSG recipient mice after ACT of the indicated cell populations. c, waterfall plot of tumour size in NSG recipient mice of ACT on the day of sacrifice relative to the tumour volume of control mice (no ACT). Bars depict individual mice. d, proportion of NSG recipient mice showing partial response (≥30% tumour reduction compared to control NSG mice) after ACT of the indicated cell population. e, frequency of CD3+ T cells (% of human CD45+ cells) in TIL of NSG mice after ACT of the indicated cell populations, measured by flow cytometry. f, frequency of CD8+ T cells (% of total cells) in tumours of NSG mice after ACT of the indicated cell populations, measured by immunohistochemistry (IHC). g, frequency of PD-1 expression on CD8+ T cells in TIL of NSG mice after ACT of the indicated cell populations, measured by flow cytometry. h, correlation between tumour volume and infiltration of CD8+ T cells (measured by IHC) in tumours of NSG mice after adoptive transfer of CD137+ CD8+ T cells. i, schematic of ACT. CD137+ CD8+ T cells, CD137- CD8+ T cells and CD137PD-1 CD8+ T cells were isolated from spleen of tumour-bearing HIS mice or bulk CD8+ T cells from spleen of naïve HIS mice and expanded ex vivo. Recipient HIS mice were injected with 2 × 106 LCL s.c. in the flank and after three days, ex vivo expanded T cells were adoptively transferred intravenously. Tumour-bearing HIS recipient mice received 2 × 106 T cells without prior conditioning/lymphodepletion. Donor and recipient HIS mice as well as LCL were autologous to each other. j, tumour volume on the day of sacrifice in HIS recipient mice after ACT of the indicated cell populations. k, waterfall plot of tumour size on the day of sacrifice of HIS mice receiving ACT relative to the tumour volume of control HIS mice (no ACT). Bars depict individual mice. l, proportion of HIS recipient mice showing partial response (≥30% tumour reduction compared to control HIS mice) after ACT of the indicated cell population. b–d, n(CD137+; tumour only) = 13, from 3 independent experiments. n(CD137PD-1) = 8, from 2 independent experiments. n(bulk) = 6, from 2 independent experiments. b, Linear mixed model with Tukey's multiple comparison test and Holm correction. e, f, n = 5–13, from 2 to 3 independent experiments. One-way ANOVA with Tukey's multiple comparison test. g, n = 3–12, from 1 to 3 independent experiments. One-way ANOVA with Tukey's multiple comparison test. Only data points in which >100 CD8+ events were recorded are shown. h, n(CD137+) = 12, from 3 independent experiments. Correlation was determined by linear regression analysis. j, n(CD137+) = 13, n(CD137PD-1) = 6, from 2 independent experiments, n(tumour only) = 11, from 3 independent experiments. Linear mixed model with Tukey's multiple comparison test and Holm correction. For each experiment, a different HPC donor was used for HIS mouse reconstitution and generation of autologous tumour. Data from individual experiments are indicated by different symbols, with individual mice from the same experiment indicated by the same symbol.

Similar articles

References

    1. Simoni Y., Becht E., Fehlings M., et al. Bystander CD8+ T cells are abundant and phenotypically distinct in human tumour infiltrates. Nature. 2018;557(7706):575–579. - PubMed
    1. Scheper W., Kelderman S., Fanchi L.F., et al. Low and variable tumor reactivity of the intratumoral TCR repertoire in human cancers. Nat Med. 2019;25(1):89–94. - PubMed
    1. Lan X., Zebley C.C., Youngblood B. Cellular and molecular waypoints along the path of T cell exhaustion. Sci Immunol. 2023;8(87) - PMC - PubMed
    1. Lowery F.J., Krishna S., Yossef R., et al. Molecular signatures of antitumor neoantigen-reactive T cells from metastatic human cancers. Science. 2022;375(6583):877–884. - PMC - PubMed
    1. Oliveira G., Wu C.J. Dynamics and specificities of T cells in cancer immunotherapy. Nat Rev Cancer. 2023;23(5):295–316. - PMC - PubMed