Review
. 2024 Jul 9;57(7):1457-1465.
doi: 10.1016/j.immuni.2024.05.020.

Human determinants of age-dependent patterns of death from infection

Affiliations
Review

Human determinants of age-dependent patterns of death from infection

Laurent Abel et al. Immunity. .

Abstract

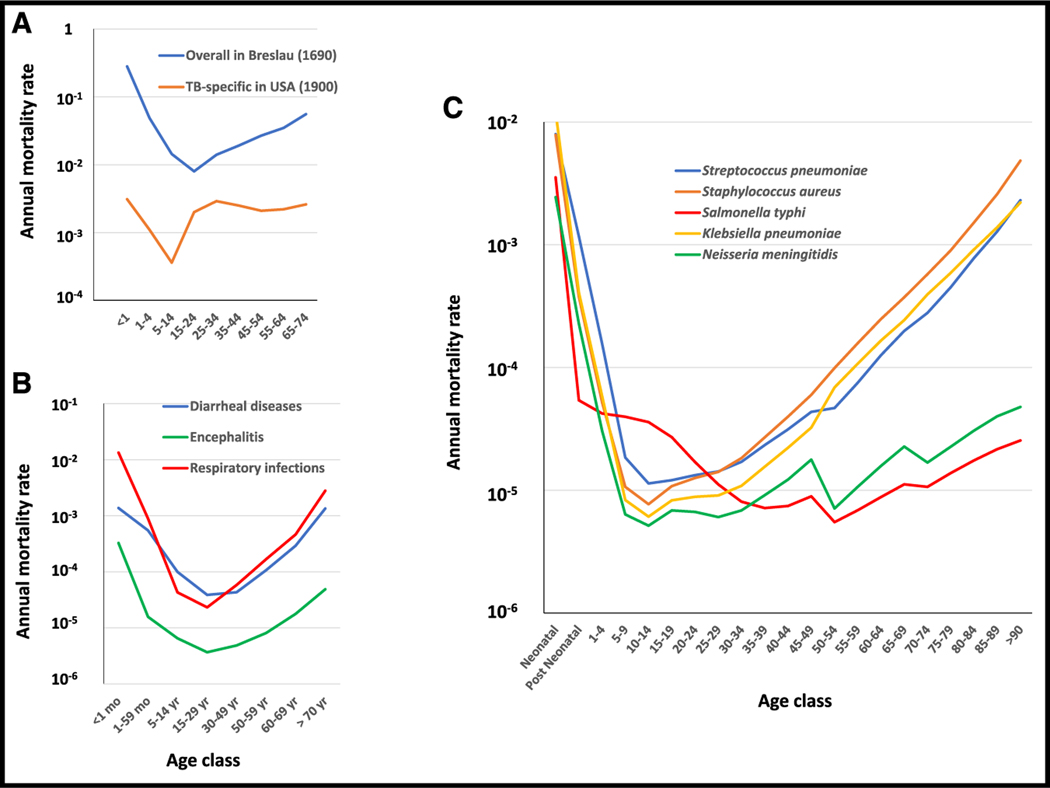
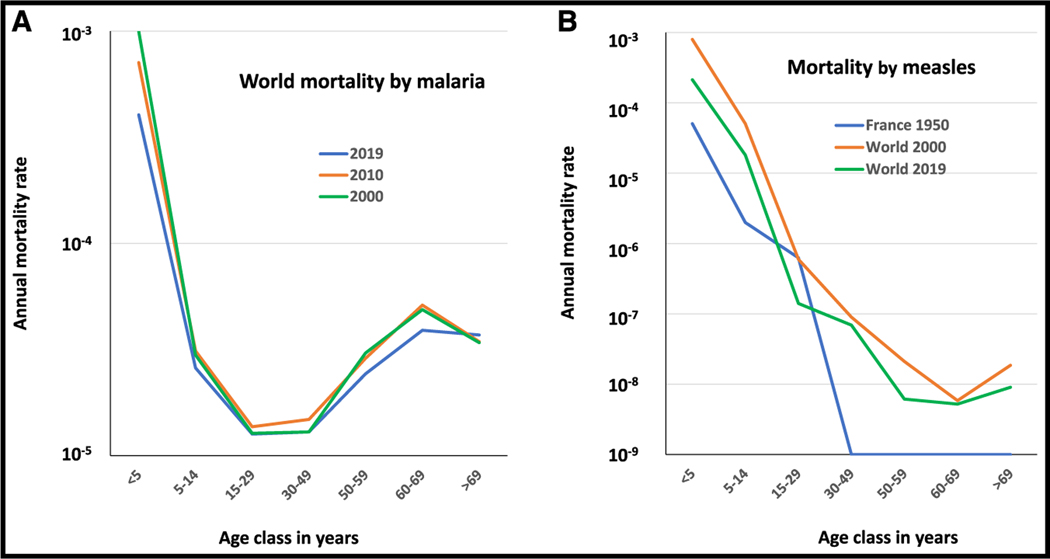
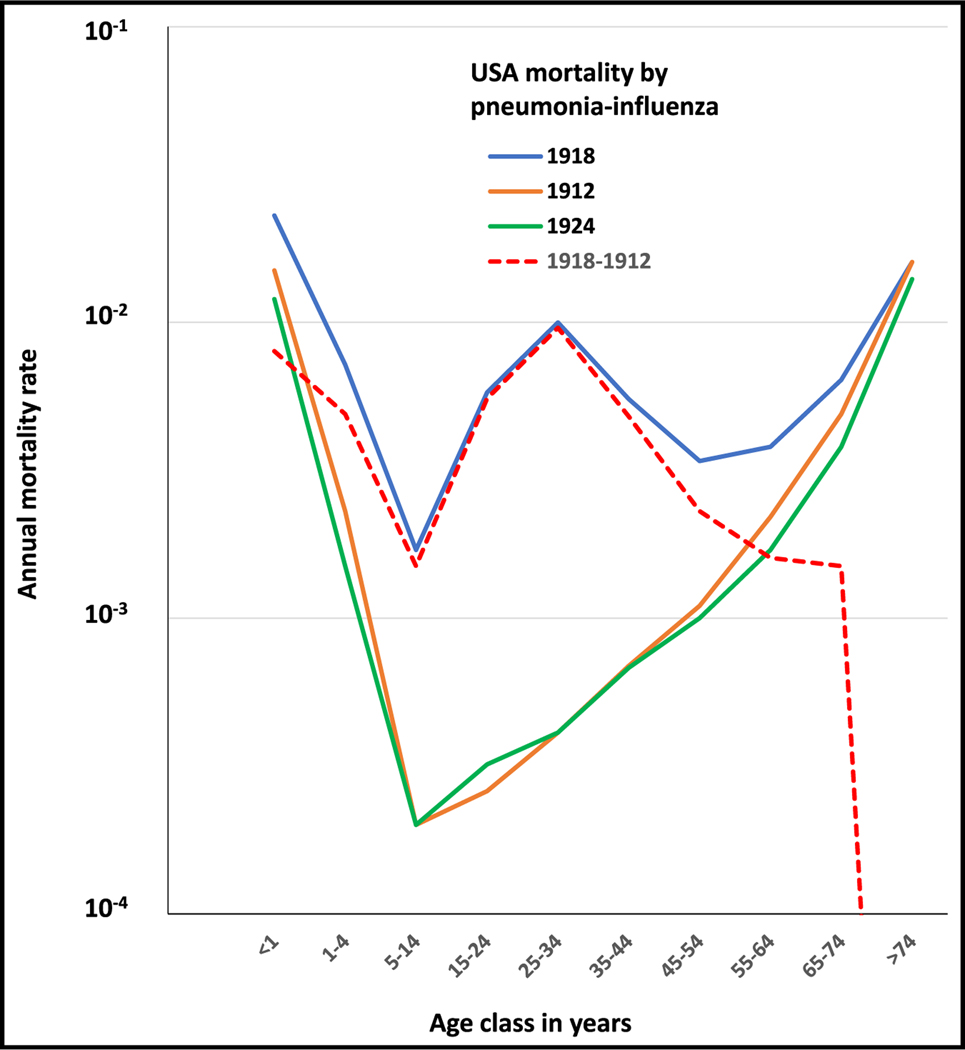
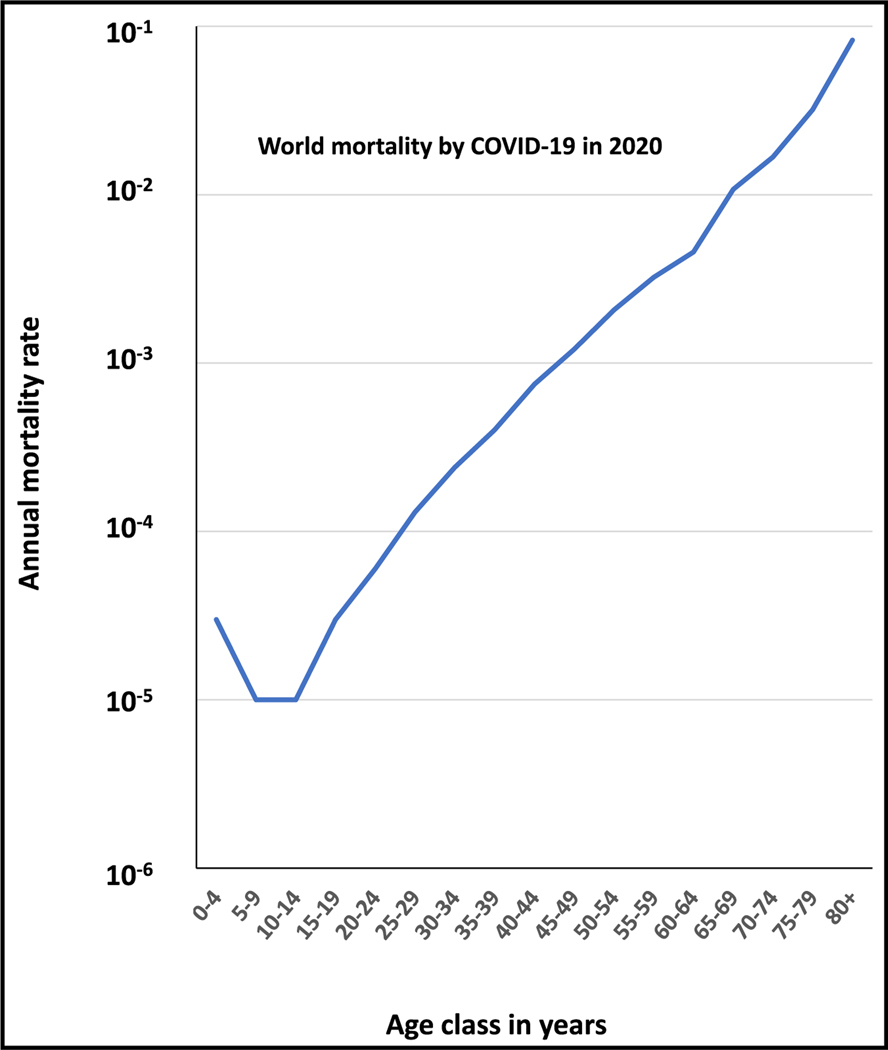
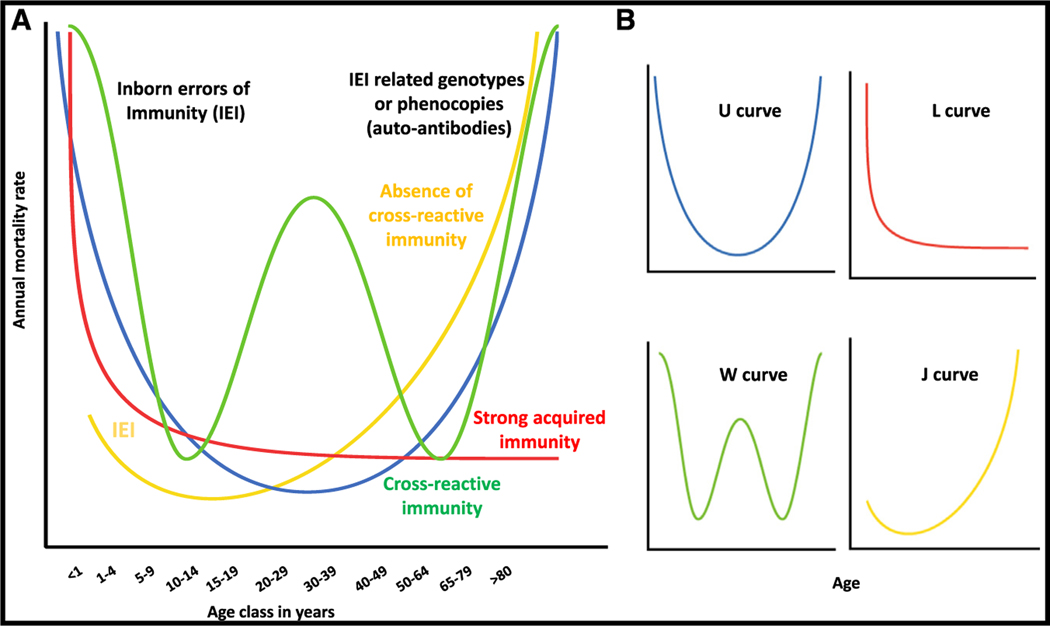
Regardless of microbial virulence (i.e., the global infection-fatality ratio), age generally drives the prevalence of death from infection in unvaccinated humans. Four mortality patterns are recognized: the common U- and L-shaped curves of endemic infections and the unique W- and J-shaped curves of pandemic infections. We suggest that these patterns result from different sets of human genetic and immunological determinants. In this model, it is the interplay between (1) monogenic genotypes affecting immunity to primary infection that preferentially manifest early in life and related genotypes or their phenocopies, including auto-antibodies, which manifest later in life and (2) the occurrence and persistence of adaptive, acquired immunity to primary or cross-reactive infections, which shapes the age-dependent pattern of human deaths from infection.

Keywords: acquired immunity; age-dependent mortality; auto-antibodies against cytokines; inborn errors of immunity; infectious diseases.


Conflict of interest statement

Declaration of interests The authors declare no competing interests.

Figures

Figure 1.
Figure 1.. Examples of U-shaped curves
(A) Annual mortality rates (log scale) as a function of age before the development of effective preventive measures and treatments for infection: overall mortality observed in Breslau (blue line) by Edmund Halley, who carried out the first reliable life table survey in 1690 (adapted from the book by John Cairns), and tuberculosis-specific rates (orange line) observed in the USA in 1900. (B) Specific mortality rates for three infectious conditions defined by the WHO in 2019 (https://www.who.int/data/gho/data/themes/mortality-and-global-health-estimates/ghe-leading-causes-of-death): diarrheal diseases (blue line), respiratory infections (red), and encephalitis (green). (C) Specific mortality rates for five of the 14 most lethal bacterial diseases worldwide: Staphylococcus aureus (orange), Streptococcus pneumoniae (blue), and Klebsiella pneumoniae (yellow line) following U-shaped curves, and Neisseria meningitidis (green) and Salmonella typhi (red) following L-shaped curves. Data for bacterial diseases were obtained from the Institute for Health Metrics and Evaluation (IHME), Seattle, USA (https://vizhub.healthdata.org/gbd-results/). Raw data for Figure 1 are in supplemental Table 1 (data availability).
Figure 2.
Figure 2.. Annual mortality rates (log scale) as a function of age for two infectious diseases with L-shaped curves
(A) Worldwide mortality rates for malaria reported in 2000 (green), 2010 (orange), and 2019 (blue) by the WHO. (B) Mortality rates for measles reported by the WHO in France in 1950 before vaccination (blue) and worldwide in 2000 (orange) and 2019 (green). Raw data for Figure 2 are in supplemental Table 2 (data availability).
Figure 3.
Figure 3.. Annual mortality rates (log scale) as a function of age observed in the 1918 influenza pandemic following a W-shaped curve (blue)
Figure also displays the mortality rates for seasonal influenza pneumonia 6 years before (1912, orange) and after (1924, green) the 1918 pandemic and excess of mortality for the year of the pandemic (1918) compared with the seasonal flu in 1912 (dotted red line). The data are for the USA and were obtained from Linder and Grove. Raw data for Figure 3 are in supplemental Table 3 (data availability).
Figure 4.
Figure 4.. Annual mortality rates (log scale) as a function of age observed in the 2020 COVID-19 pandemic following a J-shaped curve
Data are worldwide and were obtained from O’Driscoll et al. Raw data for Figure 4 are in supplemental Table 4 (data availability).
Figure 5.
Figure 5.. Schematic representation of the four age-dependent patterns of death from infection
(A) Hypothetical determinants specific to a given pattern are shown in the same color as the corresponding curve, whereas those common to several patterns are shown in black. (B) Separately provides the four age-dependent patterns.

References

    1. Casanova JL, and Abel L. (2021). Lethal Infectious Diseases as Inborn Errors of Immunity: Toward a Synthesis of the Germ and Genetic Theories. Annu. Rev. Pathol. 16, 23–50. 10.1146/annurev-pathol-031920-101429. - DOI - PMC - PubMed
    1. Li M, Song Y, Li B, Wang Z, Yang R, Jiang L, and Yang R. (2005). Asymptomatic Yersinia pestis infection, China. Emerg. Infect. Dis. 11, 1494–1496. 10.3201/eid1109.041147. - DOI - PMC - PubMed
    1. Ratsitorahina M, Rabarijaona L, Chanteau S, and Boisier P. (2000). Seroepidemiology of human plague in the Madagascar highlands. Trop. Med. Int. Health 5, 94–98. 10.1046/j.1365-3156.2000.00521.x. - DOI - PubMed
    1. Casanova JL, and Abel L. (2013). The genetic theory of infectious diseases: a brief history and selected illustrations. Annu. Rev. Genomics Hum. Genet. 14, 215–243. 10.1146/annurev-genom-091212-153448. - DOI - PMC - PubMed
    1. Casanova JL, and Abel L. (2022). From rare disorders of immunity to common determinants of infection: Following the mechanistic thread. Cell 185, 3086–3103. 10.1016/j.cell.2022.07.004. - DOI - PMC - PubMed

Publication types