. 2024 Aug 16;13(8):791-802.
doi: 10.1093/stcltm/szae041.

Requirement of Pdgfrα+ cells for calvarial bone repair

Affiliations

Requirement of Pdgfrα+ cells for calvarial bone repair

Xin Xing et al. Stem Cells Transl Med. .

Abstract

Platelet-derived growth factor receptor α (PDGFRα) is often considered as a general marker of mesenchymal cells and fibroblasts, but also shows expression in a portion of osteoprogenitor cells. Within the skeleton, Pdgfrα+ mesenchymal cells have been identified in bone marrow and periosteum of long bones, where they play a crucial role in participating in fracture repair. A similar examination of Pdgfrα+ cells in calvarial bone healing has not been examined. Here, we utilize Pdgfrα-CreERTM;mT/mG reporter animals to examine the contribution of Pdgfrα+ mesenchymal cells to calvarial bone repair through histology and single-cell RNA sequencing (scRNA-Seq). Results showed that Pdgfrα+ mesenchymal cells are present in several cell clusters by scRNA-Seq, and by histology a dramatic increase in Pdgfrα+ cells populated the defect site at early timepoints to give rise to healed bone tissue overtime. Notably, diphtheria toxin-mediated ablation of Pdgfrα reporter+ cells resulted in significantly impaired calvarial bone healing. Our findings suggest that Pdgfrα-expressing cells within the calvarial niche play a critical role in the process of calvarial bone repair.

Keywords: bone healing; bone repair; calvarial bone; mesenchymal cells; platelet-derived growth factor receptor; single-cell RNA sequencing; skeletal cells.


Conflict of interest statement

A.W.J. declared scientific advisory board for Novadip LLC, consultant for Lifesprout LLC and Novadip LLC, and Editorial Board of Bone Research, Stem Cells, and The American Journal of Pathology. All the other authors declared no potential conflicts of interest.

Figures

Graphical Abstract
Graphical Abstract
Figure 1.
Figure 1.
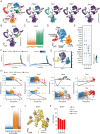
Single-cell analysis of mouse calvarial defect identifies mesenchymal cells participating in repair. Dataset was collected from 2-month-old male PdgfrαmT/mG mice with a 1.8-mm circular calvarial defect, analyzed 7 days postsurgery. (A) Uniform manifold approximation and projection (UMAP) plot of total 8403 cells isolated from the calvarial defect site of PdgfrαmT/mG mice (n = 4 mice), with UMAP visualization of selective marker gene expression for mesenchymal, EC/Peri, and hemato cell clusters. Cell numbers are listed in parenthesis next to cluster names. Color intensity indicates average expression level. (B) Feature plot of EGFP expression for mesenchymal, EC/Peri, and hemato cell clusters. (C) Trackplot showing the distribution of EGFP expression across all the 3 main clusters. (D) UMAP plot of only mesenchymal cells (total 3617 cells, clusters 0, 2, 5, 11, and 12 in A). (E) Stacked violin plot of marker gene expression for each cell cluster. (F) Differentiation trajectory of mesenchymal cells reconstructed by monocle2. Each dot indicates a single cell, with color coding showing cell clusters. (G) UMAP plot of pseudotime value. (H) The expression pattern of selected marker genes along the pseudotime. (I) Distribution of EGFP expression across the 4 subclusters by trackplot. (J) Feature plot showing EGFP expression pattern across 4 mesenchymal subclusters. (K) Bar plot showing the percentage of EGFP-positive cells across different subclusters. Abbreviations: EC, endothelial cell; Peri, pericyte; hemato, hematopoietic; Osteo, osteoblast; MLP, multilineage progenitor; Dura/fibro, dura/fibroblast.
Figure 2.
Figure 2.
Calvarial defect healing patterns over time in Pdgfrα reporter animals as assessed by micro-CT. (A) Schematic of the experiment: PdgfrαmT/mG animals (male, aged 2 months) were administered tamoxifen (TM). Bone healing and reporter activity was examined 0, 3, 7, 14, and 28 days after injury. (B) Micro-CT reconstructions of the defect site in a top-down view (above) and coronal cross-sectional images (below) in PdgfrαmT/mG animals at different postinjury time points. Margins of original defect are indicated by dashed lines. Micro-CT quantification of bone parameters at different postinjury time points, including (C) bone volume (BV), (D) bone volume/tissue volume (BV/TV), (E) residual defect diameter, (F) bone formation area (BFA), and (G) bone healing score (score). Each dot represents a single animal. Scale bars, 500 μm. Data are represented as means ± 1 SD; n = 4 mice. *P < .05, **P < .01, and ***P < .001 as assessed using one-way ANOVA test.
Figure 3.
Figure 3.
PDGFRα reporter activity in the uninjured mouse calvaria. PdgfrαmT/mG animals (male, 2 months old) were administered tamoxifen (TM) for 5 consecutive days, followed by a 7 days washout period. Reporter activity was assessed in the uninjured calvaria. Scale bar: 100 μm.
Figure 4.
Figure 4.
Dynamic changes in Pdgfrα reporter across time over calvarial defect healing. PdgfrαmT/mG mice (male, 2 months) received tamoxifen (TM), and reporter activity was evaluated postinjury. (A) Haematoxylin and eosin (H&E) staining of coronal cross section of the healing defect site at different time points after injury (0, 3, 7, 14, and 28 days). Black arrowheads indicate healing bone edges. (B) Reporter activity of the Pdgfrα reporter in 0, 3, 7, 14, and 28 days postinjury. (C) The percentages of EGFP-positive cells were calculated based on EGFP marker-positive cell numbers per DAPI-positive cell numbers. Scale bar: 500 μm. Data are represented as mean ± 1 SD; n = 4 mice. Each dot represents a single animal. *P < .05, **P < .01, and ***P < .001 as assessed using one-way ANOVA test.
Figure 5.
Figure 5.
Immunohistochemical analysis of PdgfrαmT/mG injured calvarial defects. (A) Representative immunohistochemical images of Ki67 expression at 7 days after injury. (B) Representative immunohistochemical staining image of Runt-related transcription factor 2 (Runx2) at 7 days after injury. (C) Representative immunohistochemical staining images of collagen type 1 (Col1) expression 7 days after injury. Scale bar: 200μm
Figure 6.
Figure 6.
Depletion of Pdgfrα reporter + progenitor cells impairs calvarial defect healing. (A) PdgfrαiDTR;mT/mG animals (male, aged 2 months) were sequentially administered tamoxifen (TM) and diphtheria toxin (DTX), and calvarial defect was then created. The analysis was performed 28 days after injury. (B) Representative micro-CT 3D reconstructions (top view) and axial cross-sectional images (bottom) obtained 28 days after injury. The original defect margins were highlighted by dashed lines. Quantitative analysis of micro-CT images obtained at 28 days postinjury. The analysis included the (C) bone volume (BV), (D) bone volume/tissue volume (BV/TV), (E) bone formation area (BFA), (F) residual defect diameter, and (G) bone healing score (score). Each dot represents an individual mouse, and the data are represented as mean ± SD; n = 7 mice per group. Scale bars, 500 μm. Statistical significance was assessed by one-way ANOVA test; *P < .05; **P < .01.
Figure 7.
Figure 7.
Histology of calvarial defect healing following depletion of Pdgfrα reporter + progenitor cells. (A) Representative H&E-stained images of calvarial defect in PdgfrαiDTR;mT/mG animals, 28 days postinjury. Black arrowheads indicate healing bone edges. (B) Representative tile scans and high-magnification images of calvarial defects in PdgfrαiDTR;mT/mG reporter animals, 28 days postinjury. (C) Evaluation of Pdgfrα reporter + activity as the percentage of positive cell numbers within the defect area 28 days after injury (n = 7 mice). (D) Representative image of alkaline phosphatase (ALP) staining of the bone defect edge. (E) Quantitative analysis of ALP staining. The relative ALP staining density was represented using mean integrated pixel density (n = 5 mice). (F) Representative image of osteocalcin (OCN) immunohistochemical staining in PdgfrαiDTR;mT/mG injured calvarial defect animals. (G) Quantification of OCN staining in term of relative fluorescence (n = 5 mice). Scale bar: 100 μm. Each dot represents a single animal. Data are represented as mean ± 1 SD. *P < .05, **P < .01, and ***P < .001 as assessed by two-tailed Student’s t tests.

References

    1. Bianco P, Robey PG. Skeletal stem cells. Development. 2015;142(6):1023-1027. 10.1242/dev.102210 - DOI - PMC - PubMed
    1. Mizoguchi T, Pinho S, Ahmed J, et al.. Osterix marks distinct waves of primitive and definitive stromal progenitors during bone marrow development. Dev Cell. 2014;29(3):340-349. 10.1016/j.devcel.2014.03.013 - DOI - PMC - PubMed
    1. Park D, Spencer JA, Koh BI, et al.. Endogenous bone marrow MSCs are dynamic, fate-restricted participants in bone maintenance and regeneration. Cell Stem Cell. 2012;10(3):259-272. 10.1016/j.stem.2012.02.003 - DOI - PMC - PubMed
    1. Worthley DL, Churchill M, Compton JT, et al.. Gremlin 1 identifies a skeletal stem cell with bone, cartilage, and reticular stromal potential. Cell. 2015;160(1-2):269-284. 10.1016/j.cell.2014.11.042 - DOI - PMC - PubMed
    1. Shi Y, He G, Lee W-C, et al.. Gli1 identifies osteogenic progenitors for bone formation and fracture repair. Nat Commun. 2017;8(1):2043. 10.1038/s41467-017-02171-2 - DOI - PMC - PubMed

MeSH terms

Substances