. 2024 Oct 21;83(11):1465-1479.
doi: 10.1136/ard-2023-224898.

Itaconate is a metabolic regulator of bone formation in homeostasis and arthritis

Affiliations

Itaconate is a metabolic regulator of bone formation in homeostasis and arthritis

Markus Kieler et al. Ann Rheum Dis. .

Abstract

Objectives: Bone remodelling is a highly dynamic process dependent on the precise coordination of osteoblasts and haematopoietic-cell derived osteoclasts. Changes in core metabolic pathways during osteoclastogenesis, however, are largely unexplored and it is unknown whether and how these processes are involved in bone homeostasis.

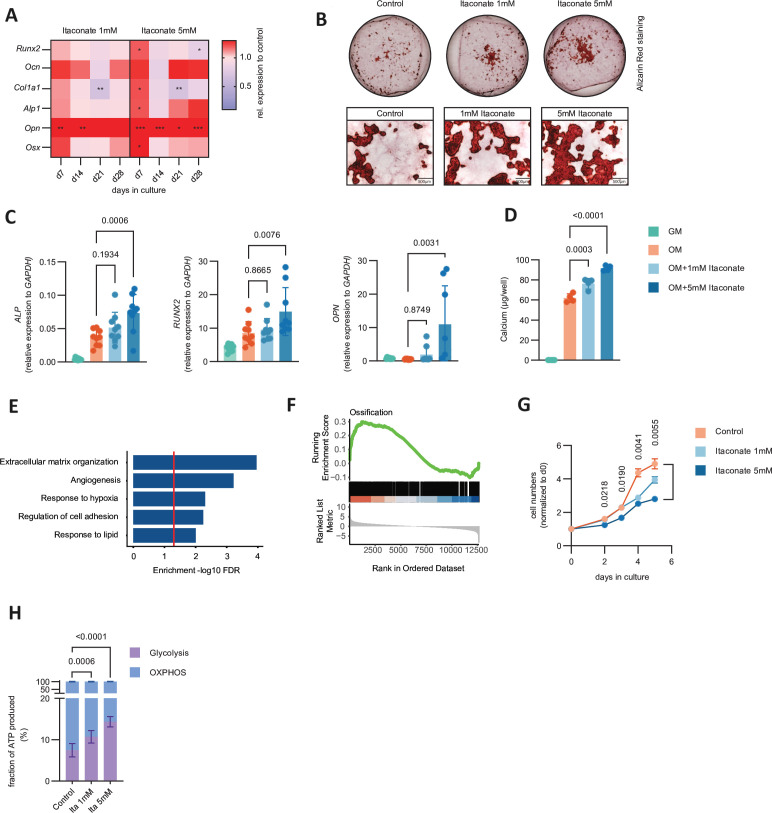
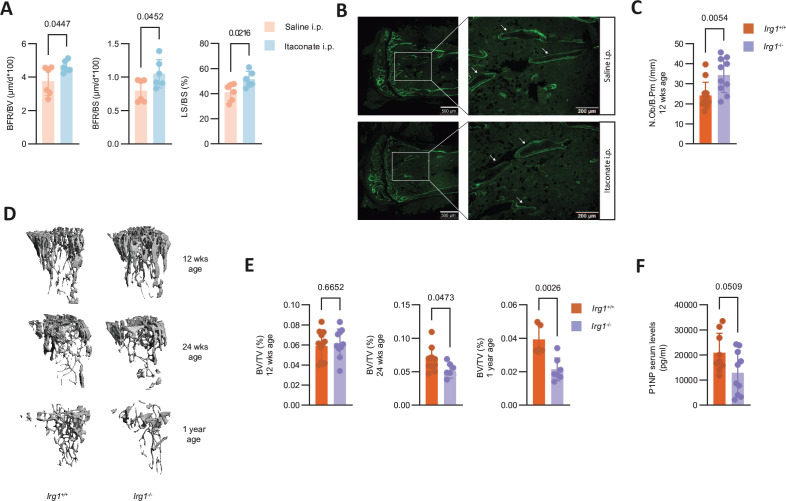
Methods: We metabolically and transcriptionally profiled cells during osteoclast and osteoblast generation. Individual gene expression was characterised by quantitative PCR and western blot. Osteoblast function was assessed by Alizarin red staining. immunoresponsive gene 1 (Irg1)-deficient mice were used in various inflammatory or non-inflammatory models of bone loss. Tissue gene expression was analysed by RNA in situ hybridisation.

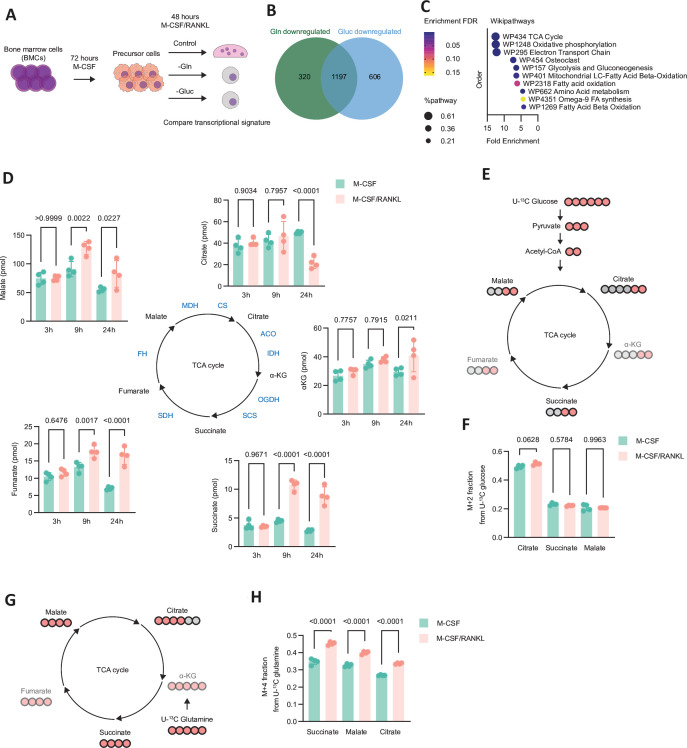
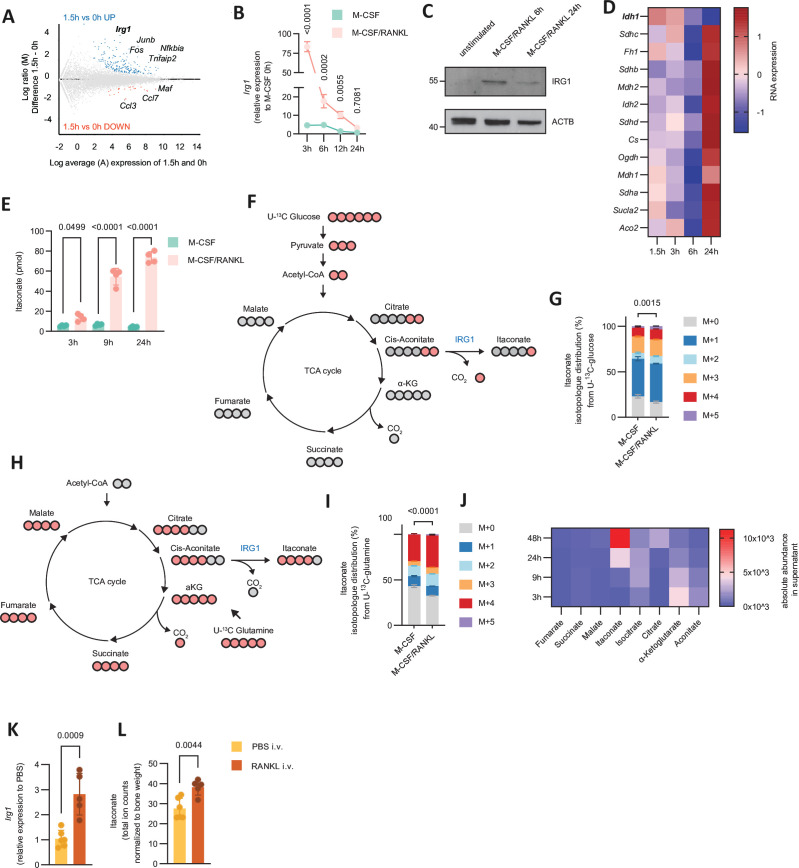
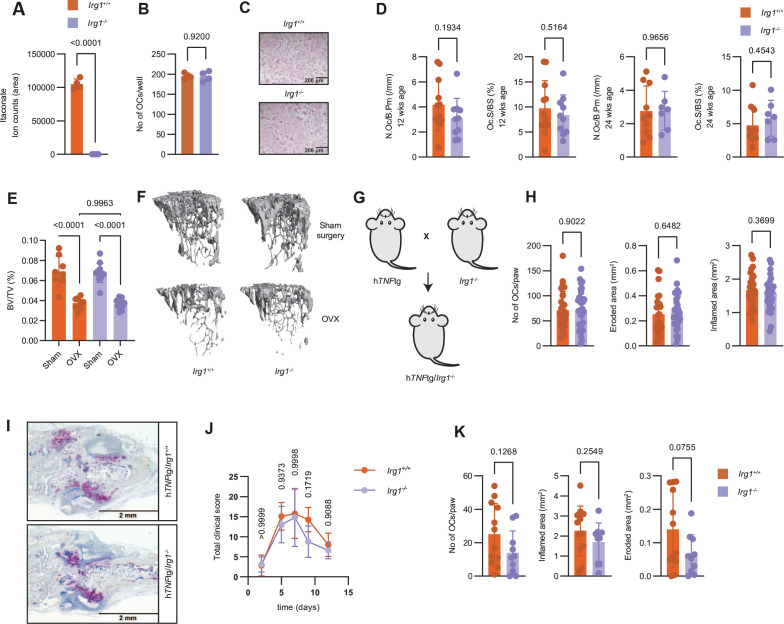
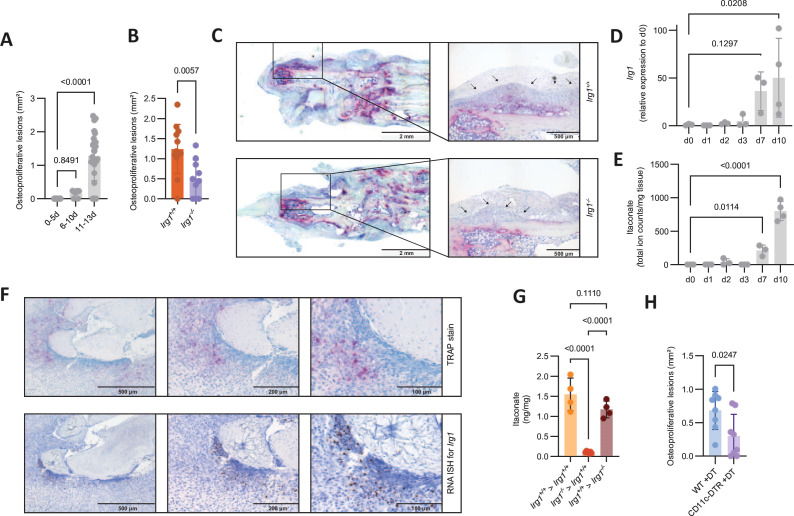
Results: We show that during differentiation preosteoclasts rearrange their tricarboxylic acid cycle, a process crucially depending on both glucose and glutamine. This rearrangement is characterised by the induction of Irg1 and production of itaconate, which accumulates intracellularly and extracellularly. While the IRG1-itaconate axis is dispensable for osteoclast generation in vitro and in vivo, we demonstrate that itaconate stimulates osteoblasts by accelerating osteogenic differentiation in both human and murine cells. This enhanced osteogenic differentiation is accompanied by reduced proliferation and altered metabolism. Additionally, supplementation of itaconate increases bone formation by boosting osteoblast activity in mice. Conversely, Irg1-deficient mice exhibit decreased bone mass and have reduced osteoproliferative lesions in experimental arthritis.

Conclusion: In summary, we identify itaconate, generated as a result of the metabolic rewiring during osteoclast differentiation, as a previously unrecognised regulator of osteoblasts.

Keywords: arthritis, experimental; bone density; spondylitis, ankylosing.


Conflict of interest statement

Competing interests: None declared.

Figures

Figure 1
Figure 1. RANKL changes cellular metabolism of differentiating osteoclasts. (A) Experimental setup of RNA-seq workflow. BMCs were stimulated with M-CSF for 72 hours and then replated with M-CSF/RANKL for 48 hours in medium lacking either glutamine or glucose. (B) Venn diagram depicting the overlap between downregulated genes (FC<−1.5 and FDR<0.05) in cells stimulated as shown in (A) compared with cells cultivated in the control medium (n=3). (C) Top 10 enriched pathways with >5 genes/pathway from 1197 overlapping genes from (B) assessed by GO enrichment analysis. Colour denotes FDR and size of the shape denotes affected genes in relation to all genes from a particular pathway. (D) Absolute abundance of TCA cycle intermediates in cells stimulated with either M-CSF or M-CSF/RANKL for 3 hours, 9 hours and 24 hours (n=4). (E) Schematic depicting the fate of U-13C labelled atoms derived from U-13C glucose. Light red circles indicate labelled C-atoms. (F) M+2 fraction of the total pool for analysed TCA cycle intermediates in cells cultivated in medium supplemented with U-13C glucose and stimulated with either M-CSF or M-CSF/RANKL for 6 hours (n=4). (G) Schematic depicting the fate of U-13C labelled atoms derived from U-13C glutamine. Light red circles indicate labelled C-atoms. (H) M+4 fraction of the total pool for analysed TCA cycle intermediates in cells cultivated in medium supplemented with U-13C glutamine and stimulated with either M-CSF or M-CSF/RANKL for 6 hours (n=4). The data are represented as means±SDs. One-way ANOVA with Šidàk’s correction (D, F, H). BMCs, bone marrow-derived cells; RANKL, receptor activator of nuclear factor κB ligand; TCA, tricarboxylic acid.
Figure 2
Figure 2. RANKL induces Irg1 expression and itaconate production in differentiating osteoclasts. (A) MA plot for differentially expressed genes in BMCs stimulated with M-CSF/RANKL for 1.5 hours versus unstimulated cells (M-CSF 0 hour) (shrunk log2 FC>0.585, FDR<0.05) (n=3). Each dot represents a transcript. Blue, upregulated; red, downregulated; grey, no difference. (B) Relative mRNA expression of Irg1 compared with RANKL unstimulated BMCs (M-CSF 0 hour) during a time course of RANKL stimulation (3 hours, 6 hours, 12 hours, 24 hours) using real-time PCR (n=4). (C) Immunoblot of IRG1 from protein lysates of RANKL unstimulated (M-CSF 0 hour), 6 hours and 24 hours M-CSF/RANKL stimulated BMCs. (D) Heatmap of genes encoding for TCA cycle biosynthetic enzymes during a time course of 1.5 hours, 3 hours, 6 hours and 24 hours post RANKL stimulation of BMCs determined by RNA-seq (n=3). Mean row centred/scaled expression values are shown. (E) Absolute levels of itaconate from cell extracts of M-CSF or M-CSF/RANKL stimulated BMCs over a time course of 3 hours, 9 hours and 24 hours (n=4). (F) Schematic depicting the fate of U-13C labelled atoms for itaconate derived from U-13C glucose. Light red circles indicate labelled C-atoms. (G) Relative isotopologue distribution of itaconate from cell extracts of M-CSF or M-CSF/RANKL stimulated BMCs for 6 hours in medium supplemented with U-13C glucose (n=4). (H) Schematic of the fate of the U-13C labelled atoms for itaconate derived from U-13C glutamine (n=4). Light red circles indicate labelled C-atoms. (I) Relative isotopologue distribution of itaconate from cell extracts of M-CSF or M-CSF/RANKL stimulated BMCs for 6 hours in medium supplemented with U-13C glutamine (n=4). (J) Heatmap depicting the absolute abundance of TCA cycle intermediates in the supernatant from BMCs stimulated with M-CSF/RANKL at 3 hours, 9 hours, 24 hours and 48 hours. (K) Relative mRNA expression of Irg1 in tibial bone isolated from mice 3–6 hours after intravenous injection with PBS or RANKL using real-time PCR (n=5–6). (L) Itaconate levels of tibial bone normalised to bone weight isolated from mice as shown in (K) (n=5–6). The data are represented as means±SDs. Two-way ANOVA with Šidàk’s correction (B), one-way ANOVA with Šidàk’s correction (E) and unpaired t-test of M+0 values (G, I, K, L). BMCs, bone marrow-derived cells; Irg1, immunoresponsive gene 1; PBS, phosphate buffered saline; RANKL, receptor activator of nuclear factor κB ligand; TCA, tricarboxylic acid.
Figure 3
Figure 3. Irg1 is dispensable for osteoclastogenesis in vitro and in vivo. (A) Intracellular levels of itaconate from cell extracts of Irg1+/+ or Irg1−/− BMCs stimulated with M-CSF/RANKL for 6 hours (n=4). (B) Number of osteoclasts per well from Irg1+/+ or Irg1−/− BMCs stimulated with M-CSF/RANKL (n=4). (C) Representative images of TRAP-stained Irg1+/+ or Irg1−/− BMCs stimulated with M-CSF/RANKL for 96 hours. Scale bar represents 200 µm. (D) Number of osteoclasts per bone perimeter (N.Oc/B.Pm) and osteoclast surface per bone surface (Oc.S/BS) from 12-weeks-old and 24-weeks-old Irg1+/+ or Irg1−/− mice (n=7–12). (E) Trabecular bone volume per tissue volume (BV/TV (%)) from Irg1+/+ or Irg1−/− mice after ovariectomy (OVX) or sham surgery (n=8). (F) Representative 3D reconstructions of tibial bones from (E). (G) Scheme for the generation of hTNFtg/Irg1+/+ or hTNFtg/Irg1−/− mice. (H) Number of osteoclasts per section of hind paws (No of OCs/paw), eroded area (mm2) and inflamed area (mm2) from 8-weeks-old hTNFtg/Irg1+/+ or hTNFtg/Irg1−/− (n=14–16). (I) Representative images of TRAP-stained histological slides from hind paws of hTNFtg/Irg1+/+ or hTNFtg/Irg1−/− mice. Scale bar represents 2 mm. (J) Total clinical score of Irg1+/+ or Irg1−/− mice injected with K/BxN serum at indicated time points after injections (n=5–6). (K) Number of osteoclasts per section of hind paws (No of OCs/paw), inflamed area (mm2) and eroded area (mm2) from mice in (J). The data are represented as means±SDs. Unpaired t-test (A, B, D, H, K), one1-way ANOVA with Šidàk’s correction (E) and two-way ANOVA with Šidàk’s correction (J). ANOVA, analysis of variance; BMCs, bone marrow-derived cells; Irg1, immunoresponsive gene 1; RANKL, receptor activator of nuclear factor κB ligand.
Figure 4
Figure 4. Irg1 expression and itaconate influence new bone formation in arthritis. (A) Area of osteoproliferative lesions (in mm2) in hind paws of mice injected with K/BxN serum at indicated time points after injection (n=7–26). (B) Area of osteoproliferative lesions (in mm2) in hind paws from Irg1+/+ or Irg1−/− mice injected with K/BxN serum (n=10–12). (C) Representative images of TRAP-stained histological slides from hind paws of mice shown in (B). Black arrows indicate the boundaries of the osteoproliferative lesions. Scale bars represent 2 mm and 500 µm. (D, E) Relative mRNA expression of Irg1 (D) and itaconate levels (E) in paws isolated from mice injected with serum from K/BxN mice harvested at indicated time points (n=3–4). (F) Representative images of histological slides of an inflamed paw (K/BxN serum transfer arthritis model) stained for TRAP (purple staining indicates TRAP+ cells) or Irg1 expression as detected with RNA ISH (brown staining indicates Irg1 expressing cells). Scale bars represent 500 µm, 200 µm and 100 µm. (G) Itaconate levels in paws from bone marrow transplanted mice injected with serum from K/BxN mice on day nine post injection. Lethally irradiated Irg1+/+ and Irg1−/− mice were transplanted with Irg1+/+ and Irg1−/− bone marrow (Irg1+/+ bone marrow to Irg1+/+ mice (Irg1+/+>Irg1+/+), Irg1−/− bone marrow to Irg1+/+ mice (Irg1−/−>Irg1+/+), Irg1+/+ bone marrow to Irg1−/− mice (Irg1+/+>Irg1−/−) (n=4–7). (H) Area of osteoproliferative lesions (in mm2) of hind paws from wildtype or CD11c-DTR mice injected with serum from K/BxN mice and treated with diphtheria toxin (n=8). The data are represented as means±SDs. One-way ANOVA with Šidàk’s correction (A, D, E, G) and unpaired t-test (B, H). ANOVA, analysis of variance; Irg1, immunoresponsive gene 1; ISH, in situ hybridisation.
Figure 5
Figure 5. Itaconate stimulates osteoblast function in vitro. (A) Heatmap for relative expression of osteoblast marker genes at indicated time points during osteogenic differentiation of murine calvarial osteoblasts cultivated in medium supplemented with 1 mM or 5 mM itaconate at indicated time points determined by real-time PCR compared with control (n=4). (B) Representative pictures of Alizarin Red staining of calvarial osteoblasts in control osteogenic differentiation medium and medium supplemented with 1 mM or 5 mM itaconate. Top pictures show wells of 12-well plate and pictures below show snapshots (scale bar represents 500 µm). (C) Relative expression of osteoblast marker genes of human bone marrow stromal cells cultivated in growth medium (GM), osteogenic differentiation medium (OM) and OM supplemented with 1 mM or 5 mM itaconate using real-time PCR (n=9). (D) Calcium deposits in wells from human bone marrow stromal cells cultivated as shown in (C) (n=4). (E) Gene ontology enrichment (FDR<0.1) of differentially regulated genes in human bone marrow stromal cells cultivated in OM versus OM supplemented with 5 mM itaconate. (F) Gene set enrichment analysis for GO:0001503 (ossification, 333 genes) of differentially regulated genes in human bone marrow stromal cells cultivated in OM versus OM supplemented with 5 mM itaconate. (G) Cell number of murine calvarial osteoblasts normalised to day 0 in control growth medium or supplemented with either 1 mM or 5 mM itaconate (n=4). (H) Fraction of total ATP produced by glycolysis or oxidative phosphorylation (OXPHOS) of MC3T3-E1 cells in control medium or medium supplemented with either 1 mM or 5 mM itaconate. The data are represented as means±SDs. Unpaired t-test (A), one-way ANOVA with Šídák’s correction (C, D), two-way ANOVA with Tukey’s correction (G) and mixed-effect analysis with Šídák’s correction (H). Asterisks in (D) indicate p values: *<0.05, **<0.01, **<0.001. ANOVA, analysis of variance.
Figure 6
Figure 6. Itaconate stimulates osteoblast function in vivo. (A) Bone formation rate per bone volume (BFR/BV (µm/d×100)), bone formation rate per bone surface (BFR/BS (µm/d×100)) and labelled surface per bone surface (LS/BS) of tibial bones from mice daily receiving intraperitoneal injections with either saline or itaconate as assessed by calcein labelling (n=6). (B) Representative fluorescence images of calcein labelled bone from mice shown in (A). White arrows indicate surfaces with fluorescent mono layers or double layers. Scale bars represents 500 µm and 200 µm. (C) Number of osteoblasts per bone perimeter (No.OB/B.PM (/mm)) of tibial bones from 12-weeks-old Irg1+/+ and Irg1−/− mice (n=10–12). (D) Representative 3D reconstructions of tibiae from 12 weeks, 24 weeks and 1-year-old Irg1−/−- or Irg1+/+ mice. (E) Bone volume per tissue volume (BV/TV (%)) of tibiae from 12 weeks, 24 weeks and 1-year-old Irg1−/− or Irg1+/+ mice assessed by µCT analysis (n=5–12). (F) Serum levels of N-Terminal Propeptide Of Type I Procollagen (P1NP) from 24 weeks old Irg1+/+ and Irg1−/− mice as determined with ELISA (n=10). The data are represented as means±SDs. Unpaired t-test (A, C, E, F). Irg1, immunoresponsive gene 1.

References

    1. Adamopoulos IE, Mellins ED. Alternative pathways of osteoclastogenesis in inflammatory arthritis. Nat Rev Rheumatol. 2015;11:189–94. doi: 10.1038/nrrheum.2014.198. - DOI - PMC - PubMed
    1. Makowski L, Chaib M, Rathmell JC. Immunometabolism: from basic mechanisms to translation. Immunol Rev. 2020;295:5–14. doi: 10.1111/imr.12858. - DOI - PMC - PubMed
    1. Da W, Tao L, Zhu Y. The role of osteoclast energy metabolism in the occurrence and development of osteoporosis. Front Endocrinol (Lausanne) 2021;12:675385. doi: 10.3389/fendo.2021.675385. - DOI - PMC - PubMed
    1. Ishii K, Fumoto T, Iwai K, et al. Coordination of PGC-1beta and iron uptake in mitochondrial biogenesis and osteoclast activation. Nat Med. 2009;15:259–66. doi: 10.1038/nm.1910. - DOI - PubMed
    1. Kubatzky KF, Uhle F, Eigenbrod T. From macrophage to osteoclast - how metabolism determines function and activity. Cytokine. 2018;112:102–15. doi: 10.1016/j.cyto.2018.06.013. - DOI - PubMed