. 2024 Jul 23;34(6):952-966.
doi: 10.1101/gr.278264.123.

DEAD box RNA helicases are pervasive protein kinase interactors and activators

Affiliations

DEAD box RNA helicases are pervasive protein kinase interactors and activators

Alexander Hirth et al. Genome Res. .

Abstract

DEAD box (DDX) RNA helicases are a large family of ATPases, many of which have unknown functions. There is emerging evidence that besides their role in RNA biology, DDX proteins may stimulate protein kinases. To investigate if protein kinase-DDX interaction is a more widespread phenomenon, we conducted three orthogonal large-scale screens, including proteomics analysis with 32 RNA helicases, protein array profiling, and kinome-wide in vitro kinase assays. We retrieved Ser/Thr protein kinases as prominent interactors of RNA helicases and report hundreds of binary interactions. We identified members of ten protein kinase families, which bind to, and are stimulated by, DDX proteins, including CDK, CK1, CK2, DYRK, MARK, NEK, PRKC, SRPK, STE7/MAP2K, and STE20/PAK family members. We identified MARK1 in all screens and validated that DDX proteins accelerate the MARK1 catalytic rate. These findings indicate pervasive interactions between protein kinases and DEAD box RNA helicases, and provide a rich resource to explore their regulatory relationships.


Figures

Figure 1.
Figure 1.
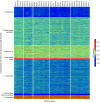
Seven clusters within the DDX/DHX interactome. Biclustering of the DDX/DHX interactome. Heatmap of the interactome (rows) against all DDX/DHX baits (columns). LFQ intensities from the IP-MS experiments were standardized row-wise to Z-scores. Rows and columns were clustered with spectral biclustering into seven row clusters and five column clusters. The heatmap was visualized using the seaborn library (https://doi.org/10.21105/joss.03021).
Figure 2.
Figure 2.
Overrepresentation analysis (ORA) of DDX/DHX interactome clusters. ORA was conducted for DDX/DHX interactome clusters 2–6. Dot plot enrichment containing results for pooled ontology categories and sorted by –log10 (P.adjusted) values. The size of the dots indicates the number of proteins in the category (“count”), and the color of the dots reflects the fold-enrichment (“FE”). Enriched ontology terms are color-coded: GO molecular function is red; GO biological process, blue; GO cellular component, orange; reactome pathway, purple; and UniProt Keyword (UP KW) molecular function, black.
Figure 3.
Figure 3.
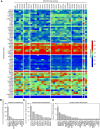
DDX/DHX proteins bind to protein kinases in HEK293T cells. (A) Heatmap of the interacting kinases (rows) against all DDX/DHX baits (columns). The empirical cumulative distribution function (eCDF) of the IP-MS data set was calculated, and the eCDF probabilities of the interacting kinases were plotted as a heatmap. Protein kinases (rows) of the heatmap were sorted by the values of the DDX/DHX baits (columns) with the highest value. The DDX/DHX baits (columns) were sorted by the values in the protein kinases (rows) with the highest value. Therefore, the highest eCDF value is in the top left corner, and the heatmap is sorted by the first row and first column. The heatmap was visualized using the seaborn library (https://doi.org/10.21105/joss.03021). (B) Bar plot indicating the number of DDX/DHX proteins interacting strongly (eCDF > 0.75) with the indicated kinase as retrieved from the DDX/DHX interactome screen. (C) Bar plot indicating the number of kinases interacting with the indicated DDX proteins as identified by Buljan et al. (2020). (D) Bar plot indicating the number of DDX proteins interacting with the indicated kinase as identified by Buljan et al. (2020).
Figure 4.
Figure 4.
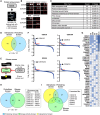
DDX proteins directly bind to protein kinases and can stimulate their enzymatic activity. (A) Outline of the protein ProtoArray binding screen. (B) Examples of DDX-interacting kinases on protein ProtoArray interrogated with V5-tagged recombinant DDX or GFP proteins. (C) Protein domain enrichment analysis (Pfam terms) of ProtoArray proteins bound specifically to DDX39A or DDX56. (D) Overlap between protein kinase hits from the DDX interactome and ProtoArray binding screen. (E) Outline of the kinome-wide activity screen. (F) Ranked results from an in vitro kinase activity screen with the indicated DDX proteins. Every point corresponds to one tested kinase. Kinases stimulated by a DDX protein with log2 fold change above 0.5 (red line) were considered positive hits. (G) Overview of all kinases identified to be stimulated by any of the four DDX proteins. (H) Venn diagram of all kinases identified in the ProtoArray and kinase activity screen showing an overlap of 16 common kinase hits. (I) Venn diagram of all kinase hits from all three screening approaches, showing six kinases being identified to be bound and regulated by DDX proteins in three independent screens.
Figure 5.
Figure 5.
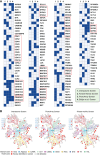
Ten candidate kinase families regulated by DDX/DHX proteins. (A) Kinases detected in one of the indicated screens are marked in blue. Kinase families are boxed in red in which at least one member was stimulated by and interacted with a DDX/DHX protein in vivo and in vitro. (B) Kinome trees depicting kinases (red) identified in the corresponding screen. For a more detailed view, see Supplemental Fig. S4.
Figure 6.
Figure 6.
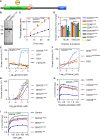
MARK1 activity is stimulated by DDX proteins in vitro. (A) Schematic of MARK1 with the boundaries indicated in red for the truncated recombinant protein used (aa 50–371). (UBA) Ubiquitin association domain, (KA1) kinase-associated domain 1, and (T208E) phosphomimetic mutation for activated MARK1. Cartoon generated using IBS v1.0.3 (Liu et al. 2015). (B) SDS-PAGE gel stained with Coomassie blue of MARK1 expressed in and purified from E. coli. (C) In vitro kinase assay linearity of MARK1 and MARK1T208E. (D) In vitro kinase assay with MARK1T208E with the addition of different DDX core domain proteins both at low (10 µM) and high (1000 µM) peptide substrate. (****) P > 0.0001. (E) In vitro kinase assay using MARK1T208E and increasing amounts of either DDX3X132–605 or different negative control proteins for EC50 determination. (F) In vitro kinase assay using MARK1T208E and increasing amounts of either DDX3X132–605, DDX3 QM, or BSA as control proteins. (G) In vitro kinase assay using MARK1T208E and increasing amounts of DDX core domain proteins for EC50 determination. (H) In vitro kinase assay using MARK1T208E with the addition of DDX core domain proteins and increasing concentrations of peptide substrate at saturating ATP concentration. (I) In vitro kinase assay using MARK1T208E with the addition of DDX core domain proteins and increasing concentrations of ATP at saturating peptide concentration.

References

    1. Adams JA. 2001. Kinetic and catalytic mechanisms of protein kinases. Chem Rev 101: 2271–2290. 10.1021/cr000230w - DOI - PubMed
    1. Anastassiadis T, Deacon SW, Devarajan K, Ma H, Peterson JR. 2011. Comprehensive assay of kinase catalytic activity reveals features of kinase inhibitor selectivity. Nat Biotechnol 29: 1039–1045. 10.1038/nbt.2017 - DOI - PMC - PubMed
    1. Bailey T, Elkan C. 1994. Fitting a mixture model by expectation maximization to discover motifs in biopolymers. Proceedings of the Second International Conference on Intelligent Systems for Molecular Biology, pp. 28–36. AAAI Press, Cambridge, MA. - PubMed
    1. Barouch-Bentov R, Che J, Lee CC, Yang Y, Herman A, Jia Y, Velentza A, Watson J, Sternberg L, Kim S, et al. 2009. A conserved salt bridge in the G loop of multiple protein kinases is important for catalysis and for in vivo Lyn function. Mol Cell 33: 43–52. 10.1016/j.molcel.2008.12.024 - DOI - PMC - PubMed
    1. Bayliss R, Sardon T, Vernos I, Conti E. 2003. Structural basis of Aurora-A activation by TPX2 at the mitotic spindle. Mol Cell 12: 851–862. 10.1016/S1097-2765(03)00392-7 - DOI - PubMed

MeSH terms

Substances