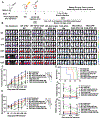
. 2024 Sep 5;31(9):1327-1343.e5.
doi: 10.1016/j.stem.2024.06.009. Epub 2024 Jul 9.

Disruption of TGF-β signaling pathway is required to mediate effective killing of hepatocellular carcinoma by human iPSC-derived NK cells

Affiliations

Disruption of TGF-β signaling pathway is required to mediate effective killing of hepatocellular carcinoma by human iPSC-derived NK cells

Jaya Lakshmi Thangaraj et al. Cell Stem Cell. .

Abstract

Hepatocellular carcinoma (HCC) is the most common type of primary liver cancer. Transforming growth factor beta (TGF-β) is highly expressed in the liver tumor microenvironment and is known to inhibit immune cell activity. Here, we used human induced pluripotent stem cells (iPSCs) to produce natural killer (NK) cells engineered to mediate improved anti-HCC activity. Specifically, we produced iPSC-NK cells with either knockout TGF-β receptor 2 (TGFBR2-KO) or expression of a dominant negative (DN) form of the TGF-β receptor 2 (TGFBR2-DN) combined with chimeric antigen receptors (CARs) that target either GPC3 or AFP. The TGFBR2-KO and TGFBR2-DN iPSC-NK cells are resistant to TGF-β inhibition and improved anti-HCC activity. However, expression of anti-HCC CARs on iPSC-NK cells did not lead to effective anti-HCC activity unless there was also inhibition of TGF-β activity. Our findings demonstrate that TGF-β signaling blockade is required for effective NK cell function against HCC and potentially other malignancies that express high levels of TGF-β.

Keywords: AFP; GPC3; TGF-β signaling; alpha-fetoprotein and CAR-NK cells; glypican 3; hepatocellular carcinoma; iPSC-NK cells; tumor microenvironment.


Conflict of interest statement

Declaration of interests D.S.K. is a co-founder and advisor to Shoreline Biosciences and has an equity interest in the company. D.S.K. also consults VisiCELL Medical and RedC Bio for which he receives income and/or equity. Studies in this work are not related to the work of those companies. The terms of these arrangements have been reviewed and approved by the University of California, San Diego, in accordance with its conflict-of-interest policies.

Figures
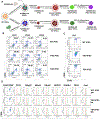
Figure 1.
Figure 1.. TGFBR2 knockout or TGFBR2 dominant negative (DN) overexpression does not affect the NK differentiation and immunophenotype of NK cells
(A) Overview of derivation of TGFBR2-KO and TGFBR2-DN iPSC from human iPSCs. (B) Hematopoietic differentiation of WT, TGFBR2-KO and TGFBR2-DN iPSCs were assessed for surface antigens CD34, CD31, CD43 and CD45 expression on day 6 is analyzed by flow cytometry. (C) Analysis of CD45+CD56+ cells during NK cell differentiation. The D6 EBs generated from WT, TKO and TDN iPSCs are cultured in NK cell differentiation media and analyzed by flow cytometry on day 35. (D) Differentiated and expanded WT, TKO and TDN cells iPSC NK cells are analyzed by flow cytometry for typical NK cell activation receptors by using flow cytometry. All data were independently replicated in at least three separate experiments.
Figure 2.
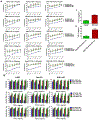
Figure 2.. TGFBR2-KO and TGFBR2-DN iPSC-derived NK cells retain functional activity after treatment by TGF-β.
(A) WT, TGFBR2-KO and TGFBR2-DN cells were treated with indicated concentrations of TGF-β (0-100ng/mL) for 24 hours, then co-cultured with K562, HepG2 and SNU-449 cells at the indicated effector to target ratios. The mean of percentages of specific tumor cell lysis ± SD are shown (n=3). (B) CD107a, IFN-γ and TNF-α expression was determined in anti-CD56 labeled effector cells after stimulation by K562, HepG2 and SNU-449 with WT, TGFBR2-KO and TGFBR2-DN cells were treated with various concentrations of TGF-β (0-100ng/mL) then stimulated with tumor cells. The mean of percentages of CD107a, IFN-γ and TNF-α expression ± SD are shown (n=3). (C and D) TGF-β secretion from HCC cells such as HepG2, SNU-449, HepG2-td-tomato-luc and SNU-449-td-tomato-luc. All data were independently replicated in at least three separate experiments. Statistical analysis was done by two-tailed Student’s t test; *p < 0.05, **p < 0.001, ***p<0.0001.
Figure 3.
Figure 3.. Long term cytolytic activity of TGFBR2-KO and TGFBR2-DN iPSC-derived NK cells after treatment by TGF-β.
(A-D) Long term cytotoxic activity of WT, TGFBR2-KO and TGFBR2-DN iPSC-NK cells in the presence of various concentrations of TGF-β (0ng/mL to 100ng/mL) against (A) TKO vs HepG2-td-tomato-luc (B) TKO vs SNU-449-td-tomato-luc (C) TDN vs HepG2-td-tomato-luc and (D) TDN vs SNU-449-td-tomato-luc cells was quantified by using the Incucyte real-time imaging system over a 48-hrs time course. The area of td-tomato positive cells was measured and normalized with 0hr 0day of untreated tumor cells expressing td-tomato. (E) Analysis of NK cell activation receptors expression on the surface of WT and TKO iPSC NK cells treated with TGF-β (10ng/mL) for 48hrs by flow cytometry. (F and G) Mean MFI quantification of receptors expressed by NK cells derived from WT and TKO iPSC cells (n=3), shown as mean ± SD. All data were independently replicated in at least three separate experiments. Statistical analysis was done by two-tailed Student’s t test; *p < 0.05, **p < 0.001, ***p<0.0001.
Figure 4.
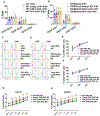
Figure 4.. Co-expression of anti-HCC CARs with TGFBR2-KO does not impact the NK differentiation potential of engineered iPSCs.
(A and B) Quantification of hematopoietic progenitor cell phenotypes of D6 EBs generated from WT and TGFBR2-KO iPSCs with or without expression of the anti-AFP or anti-GPC3 CAR as indicated. Results shown as mean ± SD, n=4. (C and D) NK cells differentiated from WT and TGFBR2-KO iPSCs with or without anti-GPC3 and anti-AFP CARs were tested for CD45, CD56 and CAR expression on days 21, 28 and 35 before harvesting the NK cells from differentiation medium Flow cytometry analysis of GFP and CAR expression on WT and TKO CAR iPSC NK cells after differentiation. (E and F) Quantification of percentage of CD45+CD56+ cells during NK cell differentiation at different time points, shown as mean ± SD. (G and H) Anti-tumor activity of WT iPSC-derived NK cells expressing either the anti-GPC3 or anti-AFP CAR were tested against CAL27 and SKOV3 at the indicated effector to target ratios. All data were independently replicated in at least three separate experiments. Statistical analysis was done by two-tailed Student’s t test; *p < 0.05, **p < 0.001, ***p<0.0001.
Figure 5.
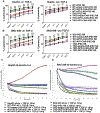
Figure 5.. TGBFR2-KO iPSC derived NK cells with or without anti-GPC3 and anti-AFP CARs functionally stable in the presence of TGF-β in vitro
(A-B) WT iPSC NK cells and TGFBR2-KO iPSC NK cells with or without anti-GPC3 and anti-AFP CARs that were either untreated or treated with TGF-β (10ng/mL) for 24hrs then co-cultured with (A) HepG2 and (B) SNU-449 cells at the indicated effector to target ratios. The mean of percentages of specific tumor cell lysis ± SD are shown. (C-D) Long term (90 hour) cytotoxic activity of WT and TGFBR2-KO iPSC-NK cells either treated with TGF-β (10ng/mL) against (A) TKO iPSC NK cells with or without expression of either the anti-AFP CAR or anti-GPC3 CAR as indicted against HepG2-td-tomato-luc cells, and (B) TKO iPSC NK cells with or without the anti-HCC CARs against SNU-449-td-tomato-luc was quantified by using the Incucyte real-time imaging system over a 90-hour time course. The area of td-tomato positive cells was measured after NK cell co-culture which are normalized with 0hr 0day of untreated tumor cells expressing td-tomato. All data were independently replicated in at least three separate experiments. Statistical analysis was done by two-tailed Student’s t test; *p < 0.05, **p< 0.001, ***p<0.0001.
Figure 6.
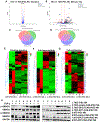
Figure 6.. Gene expression and transcriptome expression profiling of WT, TGFBR2-KO and TGFBR2-DN iPSC NK cells cultured in standard and memory like (ML) condition
(A–D) Differential expression gene and transcriptome expression between WT, TGFBR2-KO and DN iPSC NK cells cultured in standard and memory like (ML) condition was analyzed by RNA sequencing. (A and B) Volcano plot of showing significantly expressed genes in red. Genes involved in anti-tumor, tumor-infiltration, chemokine-receptor, Cell-proliferation, NK-activation, and cytokine-related pathways, that are significantly differentially expressed are shown with their gene name. Log fold change limit is 2, False discovery rate cutoff is set to 1E-3. (C and D) Venn diagrams display upregulated and downregulated transcripts overlaps between WT, TKO and TDN iPSC NK cells cultured in standard and ML conditions. Intersection numbers represent commonly regulated transcripts. (E- G) Heat map depicting the differential gene expression compared between WT, TGFBR2-KO and DN iPSC NK cells. Columns represent treatments, and rows correspond to genes clustered by expression. (H) Immunoblot analysis of TGF-β signaling in cell lysate of WT and TGFBR2-KO iPSC NK cells with or without expression of either the anti-AFP CAR or anti-GPC2 CAR were cultured in the presence or absence of TGF-β for 48hrs then detected using immunoblotting. GAPDH were used as loading controls. The expression of SMAD2, SMAD3, p-SMAD2 and p-SMAD3 in the cell lysates of WT and TGFBR2-KO iPSC-NK cells with or without anti-GPC3 and anti-AFP CARs were analyzed to evaluate TGF-β intracellular signaling.
Figure 7.
Figure 7.. TGFBR2-KO iPSC-derived NK cells with or without anti-HCC CARs exhibit improved anti-tumor activity in vivo against HepG2 cells.
(A) Schema of NK cell treatment in HepG2-td-tomato-luc tumor cell bearing HCC tumor model. NSG-tgIL15 mice (n=5 mice/group) were subcutaneously injected with HepG2-td-tomato-luc cells. Mice were then sub lethally irradiated (225 cGy) 1 day prior to NK cell injection. The mice were injected intravenously with the indicated NK cell population 4 days after tumor inoculation. (B) Tumor burden was monitored weekly by bioluminescent imaging (BLI) and (C) digital caliper with tumor volume measurements are plotted from D0 to D35. (D) Quantification of tumor burden by BLI from D0 to D35 was plotted based on BLI as total flux (photons per second). The BLI and tumor volume data are plotted with mean ± SD are shown. (E) Kaplan-Meier curve representing survival of the experimental groups. (F and G) In vivo persistence of human NK cells in mouse blood assessed by flow cytometry. The flow cytometric quantification of human CD45 and CD56 population from mouse peripheral blood was measured at indicated time points. Statistics: two-tailed Student’s t test one-way ANOVA; *p < 0.05, **p < 0.001, ***p<0.0001. Statistical analysis of each treatment group was compared with no treatment group.

References

    1. Ding J, and Wen Z (2021). Survival improvement and prognosis for hepatocellular carcinoma: analysis of the SEER database. BMC Cancer 21, 1157. 10.1186/s12885-021-08904-3. - DOI - PMC - PubMed
    1. Tang W, Chen Z, Zhang W, Cheng Y, Zhang B, Wu F, Wang Q, Wang S, Rong D, Reiter FP, et al. (2020). The mechanisms of sorafenib resistance in hepatocellular carcinoma: theoretical basis and therapeutic aspects. Signal Transduction and Targeted Therapy 5, 87. 10.1038/s41392-020-0187-x. - DOI - PMC - PubMed
    1. Raza A, and Sood GK (2014). Hepatocellular carcinoma review: current treatment, and evidence-based medicine. World J Gastroenterol 20, 4115–4127. 10.3748/wjg.v20.i15.4115. - DOI - PMC - PubMed
    1. Zhang H, Zhang W, Jiang L, and Chen Y (2022). Recent advances in systemic therapy for hepatocellular carcinoma. Biomarker Research 10, 3. 10.1186/s40364-021-00350-4. - DOI - PMC - PubMed
    1. Feng MY, Chan LL, and Chan SL (2022). Drug Treatment for Advanced Hepatocellular Carcinoma: First-Line and Beyond. Curr Oncol 29, 5489–5507. 10.3390/curroncol29080434. - DOI - PMC - PubMed

MeSH terms

Substances