. 2024 Oct:228:116416.
doi: 10.1016/j.bcp.2024.116416. Epub 2024 Jul 8.

Molecular targets of PXR-dependent ethanol-induced hepatotoxicity in female mice

Affiliations

Molecular targets of PXR-dependent ethanol-induced hepatotoxicity in female mice

Sora Choi et al. Biochem Pharmacol. 2024 Oct.

Abstract

The pregnane X receptor (PXR, NR1I2), a xenobiotic-sensing nuclear receptor signaling potentiates ethanol (EtOH)-induced hepatotoxicity in male mice, however, how PXR signaling modulates EtOH-induced hepatotoxicity in female mice is unknown. Wild type (WT) and Pxr-null mice received 5 % EtOH-containing diets or paired-fed control diets for 8 weeks followed by assessment of liver injury, EtOH elimination rates, histology, and changes in gene and protein expression; microarray and bioinformatic analyses were also employed to identify PXR targets in chronic EtOH-induced hepatotoxicity. In WT females, EtOH ingestion significantly increased serum ethanol and alanine aminotransferase (ALT) levels, hepatic Pxr mRNA, constitutive androstane receptor activation, Cyp2b10 mRNA and protein, oxidative stress, endoplasmic stress (phospho-elF2α) and pro-apoptotic (Bax) protein expression. Unexpectedly, EtOH-fed female Pxr-null mice displayed increased EtOH elimination and elevated levels of hepatic acetaldehyde detoxifying aldehyde dehydrogenase 1a1 (Aldh1a1) mRNA and protein, EtOH-metabolizing alcohol dehydrogenase 1 (ADH1), and lipid suppressing microsomal triglyceride transport protein (MTP) protein, aldo-keto reductase 1b7 (Akr1b7) and Cyp2a5 mRNA, but suppressed CYP2B10 protein levels, with evidence of protection against chronic EtOH-induced oxidative stress and hepatotoxicity. While liver injury was not different between the two WT sexes, female sex may suppress EtOH-induced macrovesicular steatosis in the liver. Several genes and pathways important in retinol and steroid hormone biosynthesis, chemical carcinogenesis, and arachidonic acid metabolism were upregulated by EtOH in a PXR-dependent manner in both sexes. Together, these data establish that female Pxr-null mice are resistant to chronic EtOH-induced hepatotoxicity and unravel the PXR-dependent and -independent mechanisms that contribute to EtOH-induced hepatotoxicity.

Keywords: Alcohol; Ethanol; Nuclear receptors; Pregnane X receptor; Sex differences; Steatosis.


Conflict of interest statement

Declaration of competing interest The authors declare that they have no known competing financial interests or personal relationships that could have appeared to influence the work reported in this paper.

Figures

Figure 1.
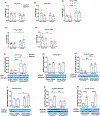
Figure 1.. Characterization of hepatic histology and hepatic lipids in female wild-type (WT) and Pxr-null mice pair-fed control diets or ethanol (EtOH)-containing diets.
Female WT and Pxr-null mice were pair-fed control diets (control) or standard Lieber-Decarli liquid diet containing 5% ethanol (EtOH) (representing 27.5% of the total caloric intake) for 8 weeks. Hematoxylin and eosin (H & E) staining (original magnification ×400) (A), Pathology scores from histology of liver sections for macroversicular steatosis (B) and microvesicular steatosis (C) in pair-fed control diets (control) and EtOH-fed WT and Pxr-null mice. A scale of 0 (no injury) to 5 (most severe injury) was used to assign the pathology scores in a double-blinded manner by a licensed pathologist, Hepatic triglyceride levels (D) from control and EtOH-fed WT and Pxr-null mice as described in Experimental Procedures. Chronic EtOH feeding produced both macrovesicular (indicated by arrows) and microvesicular steatosis (indicated by arrowheads) only in the WT mice. Data represent mean ± SD (n = 4–7). *P < 0.05, ***P < 0.001, and ****P < 0.0001 between indicated groups.
Figure 2.
Figure 2.. Hepatic gene and protein expression of mouse type II nuclear receptors and their targets, important for xenobiotic metabolism, estrogen receptor 1 (Esr1) mRNA and nuclear translocation of constitutive androstane receptor (CAR).
Female WT and Pxr-null mice were pair-fed control diets (control) or standard Lieber-Decarli liquid diet containing 5% EtOH (Ethanol) (representing 27.5% of the total caloric intake) for 8 weeks. Pregnane X receptor (Pxr) (A), constitutive androstane receptor (Car) (B), Cyp3a11 (C), solute carrier organic anion transporter family, member 1a4 (Slco1a4/Oatp2) (D), Cyp7a1 (E), Cyp2b10 (F), Esr1 (G) and Gapdh mRNAs were quantified as described in Experimental Procedures. Data represent mean ± SD (n = 5–7). Furthermore, Western blots of liver homogenate (40 μg/lane) probed with antibodies to CYP3A11 (H) and CYP2B10 (I) as well as nuclear extract (J) and cytosol (K) probed with anti-CAR antibody. The blots were stripped and reprobed with either α-tubulin or proliferating cell nuclear antigen (PCNA) antibody. Bands were quantified and normalized to α-tubulin or PCNA. Data represent mean ± SD (n = 3–4; 3 control- samples and 4 EtOH-treated samples). *P < 0.05, **P < 0.01, ***P < 0.001, and ****P < 0.0001 between indicated groups.
Figure 3.
Figure 3.. Hepatic gene expression and immunoblot analysis of mouse hepatic enzymes involved in ethanol (EtOH) metabolism.
Female WT and Pxr-null mice were pair-fed control diets (control) or standard Lieber-Decarli liquid diet containing 5% EtOH (representing 27.5% of the total caloric intake) for 8 weeks. Alcohol dehydrogenase 1 (Adh1) (A), aldehyde dehydrogenase 2 (Aldh2) (B), Aldh1a1 (C), and Catalase (D), Aldh1b1 (E), and Gapdh mRNAs were quantified as described in Experimental Procedures. Data represent mean ± SD (n = 5–7). Western blots of liver homogenate (40 μg/lane) probed with antibodies to ADH1 (F), ALDH2 (G), ALDH1A1 (H), Catalase (I), ALDH1B1(J), and CYP2E1 (K). The blot was stripped and reprobed with α-tubulin antibody. Bands were quantified and normalized to α-tubulin. Data represent mean ± SD (n = 3–4; 3 control- samples and 4 EtOH-treated samples). *P < 0.05, **P < 0.01, ***P < 0.001, and ****P < 0.0001 between indicated groups.
Figure 4.
Figure 4.. Hepatic gene expression, nuclear translocation of SREBP1, and immunoblot analysis of mouse hepatic enzymes involved in lipid homeostasis.
Female WT and Pxr-null mice were pair-fed control diets or standard Lieber-Decarli liquid diet containing 5% EtOH (EtOH) (representing 27.5% of the total caloric intake) for 8 weeks. Early growth response-1 (Egr-1) (A), Cyp2a5 (B), aldo-keto reductase (Akr) 1b7 (Akr1b7) (C) farnesoid X receptor (Fxr) (D), peroxisome proliferator-activated receptor α (Pparα) (E), fatty acid binding protein 1 (Fabp1) (F), acyl CoA oxidase 1 (Acox1) (G), uncoupling protein 2 (Ucp2) (H), sterol regulatory element binding protein 1 (Srebp-1c) (I), fatty acid synthase (Fas) (J), and Gapdh mRNAs were quantified as described in Experimental Procedures. Data represent mean ± SD (n = 5–7). Furthermore, Western blots of liver nuclear extract (20 μg/lane), cytosol (20 μg/lane) and homogenate (40 μg/lane). Nuclear extract (K) and cytosol (L) were probed with anti-SREBP1 antibody. Furthermore, liver homogenate was probed with antibodies to microsomal triglyceride transport protein (MTP) (M) and phosphorylated-unphosphorylated forms of adenosine monophosphate-activated protein kinase α (AMPKα) (N). Following initial probing with the SREBP1, MTP, and Phosphorylated-AMPKα (Thr-172 antibodies, the blots were stripped and reprobed with either proliferating cell nuclear antigen (PCNA), α-tubulin or AMPKα antibodies. Bands were quantified and normalized to PCNA, α-tubulin or AMPKα. Data represent mean ± SD (n = 3–4; 3 control- samples and 4 EtOH-treated samples). *P < 0.05, **P < 0.01, and ***P < 0.001, between indicated groups.
Figure 5.
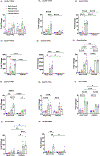
Figure 5.. Immunoblot analysis of mouse hepatic apoptotic, endoplasmic reticulum stress enzymes, blood EtOH concentration (BEC), EtOH elimination, and serum biochemical parameters.
Female WT and Pxr-null mice were pair-fed control diets (control) or standard Lieber-Decarli liquid diet containing 5% EtOH (representing 27.5% of the total caloric intake) for 8 weeks. Western blots of liver homogenate (40 μg/lane) probed with antibodies to BCL-xL (A), BAX (B), and phospho-Elf2α (C). Following initial probing, the blots were stripped and reprobed with α-tubulin antibody. Bands were quantified and normalized to α-tubulin. Data represent mean ± SD (n = 3–4). Furthermore, serum was assayed for triglycerides (D), BEC (E), EtOH elimination rates after a single oral dose of 5.0 g/kg EtOH after a 12-hour starvation (F), Lipid peroxidation in liver homogenates quantified as the thiobarbituric acid (TBA)-reactive product, malondialdehyde (MDA) (G) and alanine aminotransferases (ALT) (H), as described in Experimental Procedures. Data represent mean ± SD (n = 5–7). *P < 0.05, **P < 0.01, ***P < 0.001, and ****P < 0.0001 between indicated groups.
Figure 6.
Figure 6.. Characterization of hepatic histology and hepatic lipids in male and female wild-type (WT) and Pxr-null mice pair-fed control diets or ethanol (EtOH)-containing diets.
Male and female WT and Pxr-null mice were pair-fed control diets (control) or standard Lieber-Decarli liquid diet containing 5% ethanol (EtOH) (representing 27.5% of the total caloric intake) for 8 weeks. Hematoxylin and eosin (H & E) staining (original magnification ×400) (A), Pathology scores from histology of liver sections for macroversicular steatosis (B) and microvesicular steatosis (C) in pair-fed control diets (control) and EtOH-fed WT and Pxr-null mice. A scale of 0 (no injury) to 5 (most severe injury) was used to assign the pathology scores in a double-blinded manner by a licensed pathologist. Furthermore, serum was assayed for alanine aminotransferases (ALT) (D), as described in Experimental Procedures. Chronic EtOH feeding produced both macrovesicular (indicated by arrows) and microvesicular steatosis (indicated by arrowheads) in male and female WT mice, but not in their Pxr-null mice counterparts. Data represent mean ± SD (n = 4–7). *P < 0.05, ***P < 0.001, and ****P < 0.0001 between indicated groups.
Figure 7.
Figure 7.. The effect ethanol on hepatic transcriptome in male and female WT and PXR-KO mice from the liver microarray experiments.
Total RNA was isolated with Trizol from liver tissues (n = 4) of male and female WT and Pxr-null mice were pair-fed control diets (control) or standard Lieber-Decarli liquid diet containing 5% EtOH (representing 27.5% of the total caloric intake) for 8 weeks. Transcriptomic profiling in livers was performed using Affymetrix GeneChip® arrays. A Venn Diagram showing the common and uniquely regulated genes by EtOH in each paired comparison (MWTEtOH-MWTCT: effect of EtOH over control in livers of male WT (MWT) mice; FWTEtOH-FWTCT: effect of EtOH over control in livers of female WT (FWT)mice; MPXRKOEtOH-MPXRKOCT: effect of EtOH over control in livers of male PXR-KO (MPXRKO) mice; FPXRKOEtOH-FPXRKOCT: effect of EtOH over control in livers of female PXR-KO (FPXRKO) mice) (A). Data were analyzed using the limma R package and controlled for errors of multiple testing (adjusted p-value < 0.05). Two-way hierarchical clustering dendrograms of differentially regulated genes by EtOH in MWT, FWT, MPXRKO, and FPXRKO conditions, as generated by the heatmap.2 function in the gplots R package (B). The numbers of the y-axis indicate the total number of differentially regulated genes by EtOH (adjusted p-value < 0.05). Red represents relatively high expression and blue represents relatively low expression.
Figure 8.
Figure 8.. Volcano plots depicting chronic EtOH effect on hepatic genes in male and female WT and Pxr-null mice.
Total RNA was isolated with Trizol from liver tissues (n = 4) of male and female WT and Pxr-null mice were pair-fed control diets (control) or standard Lieber-Decarli liquid diet containing 5% EtOH (representing 27.5% of the total caloric intake) for 8 weeks. Transcriptomic profiling in livers was performed using Affymetrix GeneChip® arrays. Data that were analyzed using the limma R package and controlled for errors of multiple testing (adjusted p-value < 0.05) and volcano plots were generated. Volcano plot showing the gene expression fold changes and p-values in EtOH-fed male mice vs male WT mice fed the control diet (A), EtOH-fed female WT mice vs female WT mice fed the control diet (B), EtOH-fed male Pxr-null mice vs male Pxr-null mice fed the control diet (C), and EtOH-fed female Pxr-null mice vs female Pxr-null mice fed the control diet (D).
Figure 9.
Figure 9.. Hepatic mRNA expression of eleven (11) differentially regulated genes from the microarray analysis validated using qRT-PCR.
Male and female WT and Pxr-null mice were pair-fed control diets (control) or standard Lieber-Decarli liquid diet containing 5% EtOH (EtOH) (representing 27.5% of the total caloric intake) for 8 weeks. Cyp26a1 (A), Cyp26b1 (B), Cyp2b9 (C), Cyp2b10 (D), Cyp2b13 (E), Cyp2c29 (F), Cyp2c37(G), Cyp4f15 (H), Acss3 (I), Akr1b7 (J), Akr1b10 (K) and Gapdh mRNAs were quantified as described in Experimental Procedures. Data represent mean ± SD (n = 5–7). P < 0.05, **P < 0.01, ***P < 0.001, and ****P < 0.0001, between indicated groups.
Figure 10.
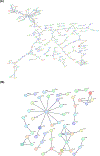
Figure 10.. String analysis description of differentially regulated KEGG pathways of PXR dependent EtOH effect in males and female WT and Pxr-null mice.
Total RNA was isolated with Trizol from liver tissues (n = 4) of male and female WT and Pxr-null mice pair-fed control diets (control) or standard Lieber-Decarli liquid diet containing 5% EtOH (representing 27.5% of the total caloric intake) for 8 weeks. Transcriptomic profiling in livers was performed using Affymetrix GeneChip® arrays. String analysis showing the differentially regulated KEGG pathways of PXR dependent EtOH effect in males (adjusted p-value < 0.05) (A) and female mice (adjusted p-value < 0.05) (B). The full network with the edges based on highest confidence indicating both functional and physical protein associations was examined. Disconnected nodes in the network are not shown.

References

    1. Gao B, Bataller R, Alcoholic liver disease: pathogenesis and new therapeutic targets, Gastroenterology 141 (2011) 1572–1585. 10.1053/j.gastro.2011.09.002. - DOI - PMC - PubMed
    1. Gyamfi MA, Wan YJ, Pathogenesis of alcoholic liver disease: the role of nuclear receptors, Experimental biology and medicine 235 (2010) 547–560. 10.1258/ebm.2009.009249. - DOI - PMC - PubMed
    1. Zakhari S, Li TK, Determinants of alcohol use and abuse: Impact of quantity and frequency patterns on liver disease, Hepatology 46 (2007) 2032–2039. 10.1002/hep.22010. - DOI - PubMed
    1. Altamirano J, Bataller R, Cigarette smoking and chronic liver diseases, Gut 59 (2010) 1159–1162. 10.1136/gut.2008.162453. - DOI - PubMed
    1. Pessione F, Ramond MJ, Peters L, Pham BN, Batel P, Rueff B, Valla DC, Five-year survival predictive factors in patients with excessive alcohol intake and cirrhosis. Effect of alcoholic hepatitis, smoking and abstinence, Liver Int 23 (2003) 45–53. 10.1034/j.1600-0676.2003.01804.x. - DOI - PubMed

Publication types