. 2024 Aug 28:598:217110.
doi: 10.1016/j.canlet.2024.217110. Epub 2024 Jul 8.

PP2A B55α inhibits epithelial-mesenchymal transition via regulation of Slug expression in non-small cell lung cancer

Affiliations

PP2A B55α inhibits epithelial-mesenchymal transition via regulation of Slug expression in non-small cell lung cancer

Deepika Singh et al. Cancer Lett. .

Abstract

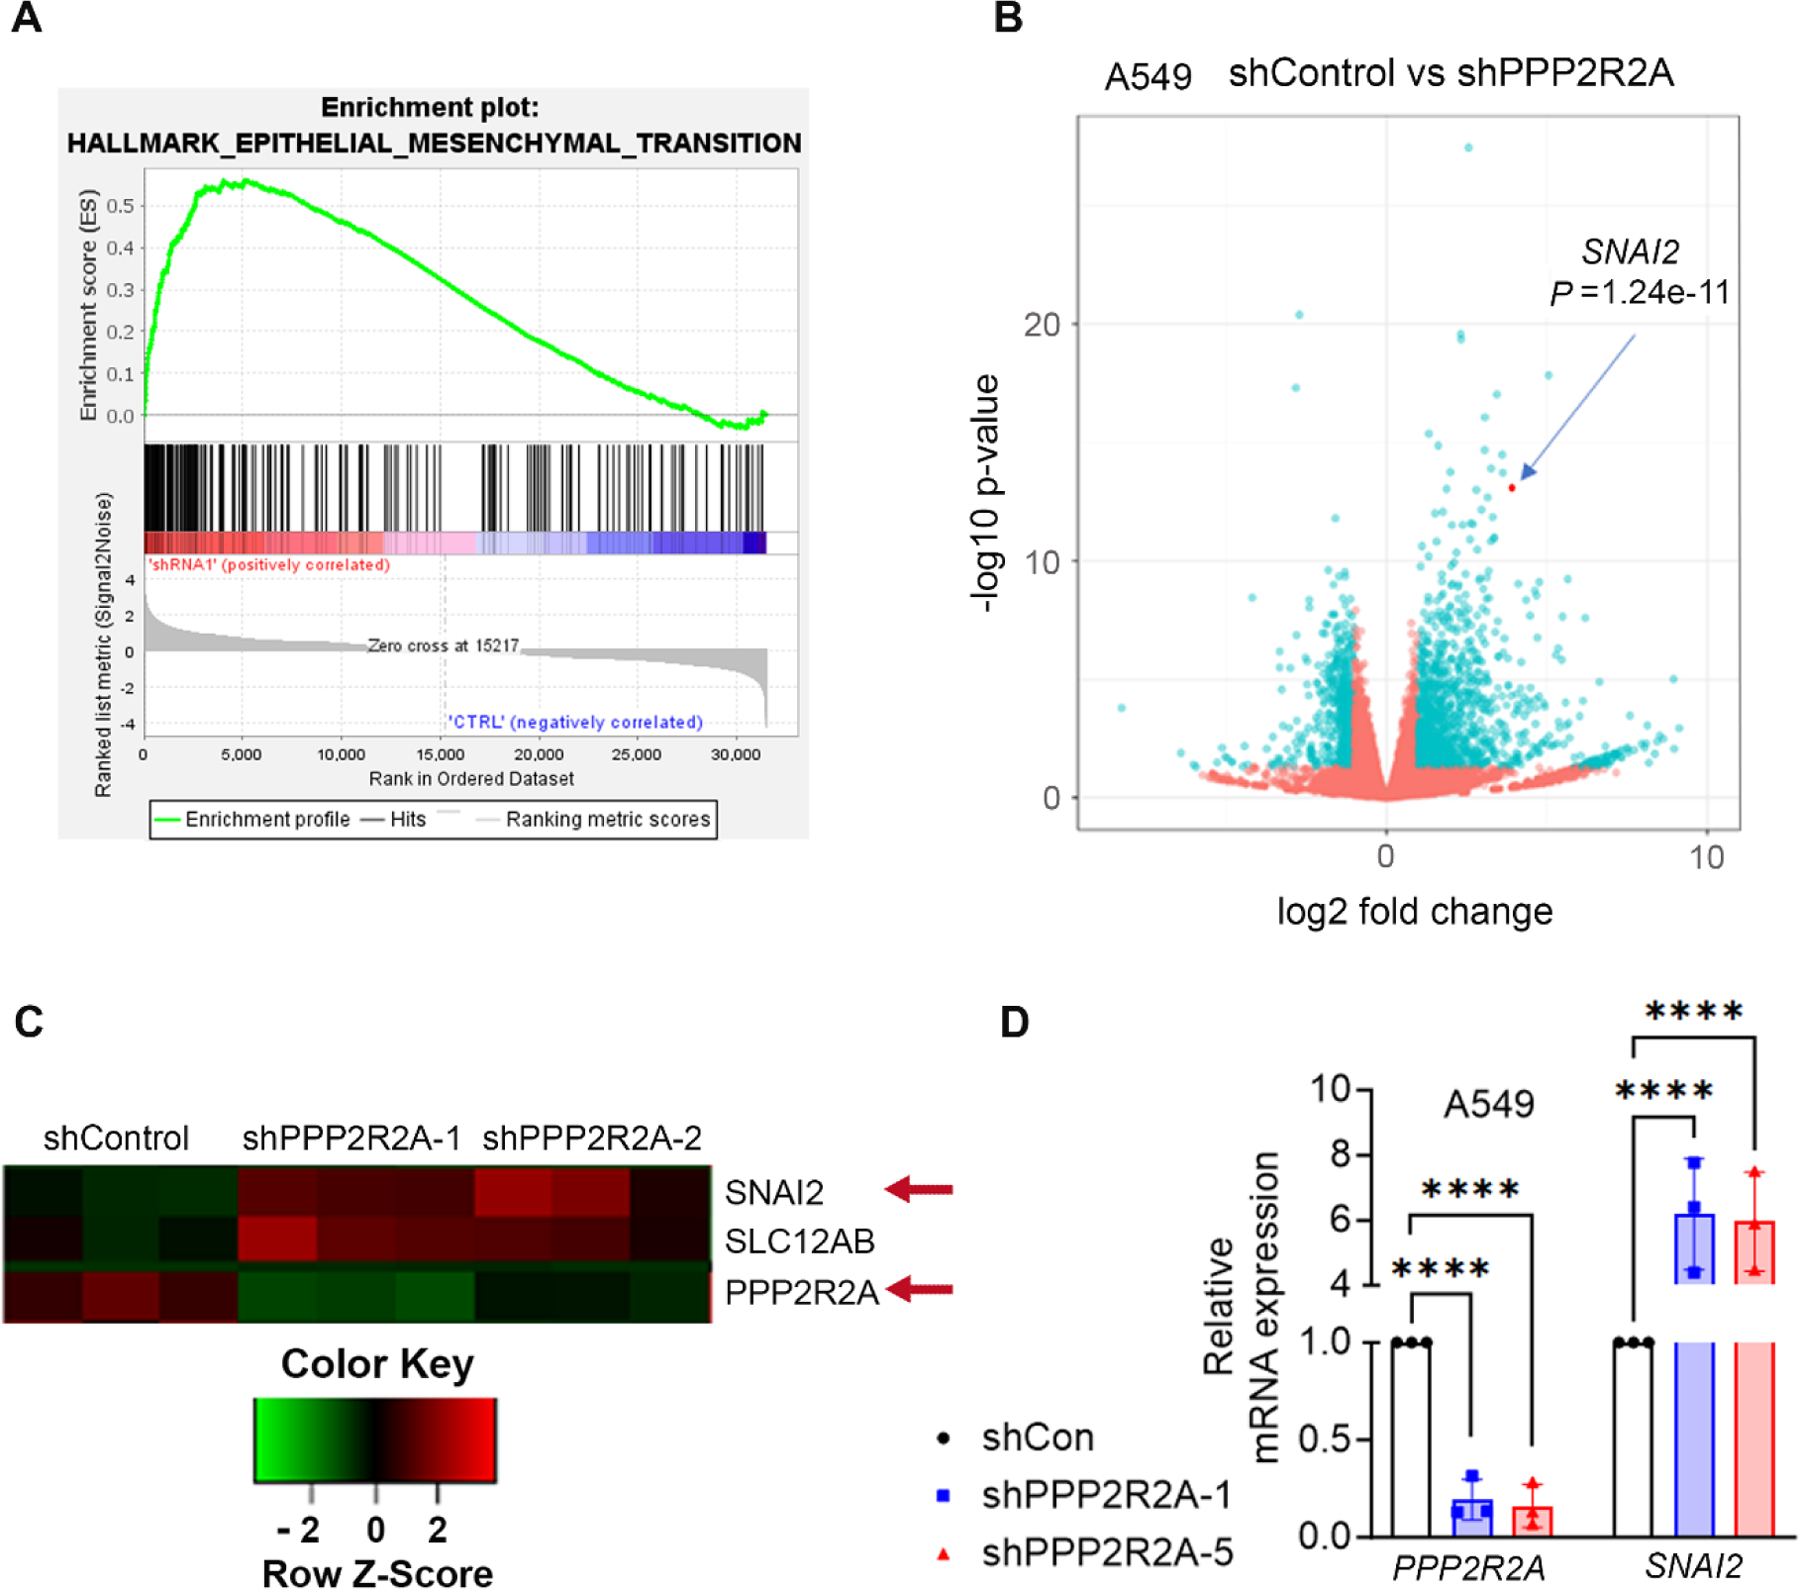
PP2A B55α, encoded by PPP2R2A, acts as a regulatory subunit of the serine/threonine phosphatase PP2A. Despite a frequent loss of heterozygosity of PPP2R2A in cases of non-small cell lung cancer (NSCLC), research on PP2A B55α's functions remains limited and controversial. To investigate the biological roles of PP2A B55α, we conducted bulk RNA-sequencing to assess the impact of PPP2R2A knockdown using two shRNAs in a NSCLC cell line. Gene set enrichment analysis (GSEA) of the RNA-sequencing data revealed significant enrichment of the epithelial-mesenchymal transition (EMT) pathway, with SNAI2 (the gene encoding Slug) emerging as one of the top candidates. Our findings demonstrate that PP2A B55α suppresses EMT, as PPP2R2A deficiency through knockdown or homozygous or hemizygous depletion promotes EMT and metastatic behavior in NSCLC cells, as evidenced by changes in EMT biomarkers, invasion and migration abilities, as well as metastasis in a tail vein assay. Mechanistically, PP2A B55α inhibits EMT by downregulating SNAI2 expression via the GSK3β-β-catenin pathway. Importantly, PPP2R2A deficiency also slows cell proliferation by disrupting DNA replication, particularly in PPP2R2A-/- cells. Furthermore, PPP2R2A deficiency, especially PPP2R2A-/- cells, leads to an increase in the cancer stem cell population, which correlates with enhanced resistance to chemotherapy. Overall, the decrease in PP2A B55α levels due to hemizygous/homozygous depletion heightens EMT and the metastatic or stemness/drug resistance potential of NSCLC cells despite their proliferation disadvantage. Our study highlights the significance of PP2A B55α in EMT and metastasis and suggests that targeting EMT/stemness could be a potential therapeutic strategy for treating PPP2R2A-deficient NSCLC.


Conflict of interest statement

Declaration of competing interest The authors declare that they have no known competing financial interests or personal relationships that could have appeared to influence the work reported in this paper.

Figures

Figure 1.
Figure 1.. Bulk RNA-sequencing (RNA-seq) identifies SNAI2 as an upregulated EMT gene in A549 cells with PPP2R2A KD.
A, Differential gene expression analysis using DESeq2. The candidate genes that passed the filter criteria were subjected to Gene Set Enrichment Analysis (GSEA). Normalized Enrichment Score (NES), 2.5795555; Nominal P-value. B, SNAI2 expression in PPP2R2A knockdown A549 cells as indicated by Volcano plot. C, Heat map of SNAI2 and PPP2R2A expression in two different PPP2R2A KD cell groups compared to a scrambled shRNA control group (shCon). D, Relative SNAI2 expression in the indicated PPP2R2A KD cells compared to shCon group. Statistical information: RNA sequencing data was obtained from three biological repeats and all the experiment was repeated at least three times (n = 3) Data is presented as mean ± SD. The P value of D was determined by one-way ANOVA. ****P < 0.0001.
Figure 2.
Figure 2.. PPP2R2A deficiency leads to increased expression of EMT markers and enhanced migration and invasion.
A-C, Representative Western blots indicating the markers of EMT pathway in the indicated cells following PPP2R2A KD. D, A pie chart showing the shallow deletion as a major form of PPP2R2A deficiency in NSCLC. (n = 1144 source- cBioPortal). E, Representative western blots of the indicated markers of EMT pathway in the A549 cells with or without PPP2R2A deletion (+/−, −/−). F, Representative images showing the morphology of A549 cells after PPP2R2A deletion (+/−, −/−) (magnification, 10X; Scale bar, 210 μm). G, Representative images of migrated and invaded A549 cells with PPP2R2A deficiency (+/−, −/−), as detected by transwell assay (magnification, 10X; Scale bar, 210 μm). H, The quantification of data from G. Statistical information: n = 3, Data are presented as the mean ± SD and the P value was determined by one way ANOVA. **P < 0.01; ***P < 0.001; ****P < 0.0001.
Figure 3.
Figure 3.. PPP2R2A repletion leads to the reversal of the PPP2R2A deficiency-induced EMT phenotype, which is dependent on SNAI2 expression.
A, Representative Western blots of the indicated EMT protein in PPP2R2A deficient (+/−, −/−) A549 cells, in the presence or absence of PPP2R2A reconstitution. B, Representative images of migration following PPP2R2A reconstitution in PPP2R2A deficient A549 cells (+/−, −/−) as detected by transwell assay after 24 hours of incubation. C, The quantification of the data from B. D, Representative image of invasion following PPP2R2A reconstitution in PPP2R2A deficient (+/−, −/−) A549 cells as detected using transwell assay after 48 hours of incubation E, The quantification of data from D. F, Representative western blots of indicated proteins of EMT pathway in PPP2R2A-deficient A549 cells, with or without SNAI2 knockout. G, Representative images of PPP2R2A deficiency-induced migration in A549 cells with or without SNAI2 knockout, as detected by transwell assay. H, The quantification of the data from G. I, Representative images of PPP2R2A deficiency-induced invasion in A549 cells with or without SNAI2 knockout, as detected by transwell assay. J, The quantification of the data from I. Statistical information: n = 3, Data is presented as the mean ± SD. All the P values in C and E was evaluated using Student’s t-test while P-values in H and J were calculated using one way ANOVA for multiple comparisons. *P < 0.05; **P < 0.01; ***P < 0.001; ns, nonsignificant. (magnification, 10X; Scale bars, 210 μm). WT: wild-type; RE: reconstitution.
Figure 4.
Figure 4.. PPP2R2A deficiency results in slower proliferation.
A, Representative graph indicating proliferation rate of A549 cells with or without PPP2R2A deletion (+/−, −/−), as detected by Incucyte. B, Bar graph showing effect of PPP2R2A deficiency on different phases of cell cycle. C, Representative Western blot of cycle regulatory proteins in A549 cells with or without PPP2R2A deletion (+/−, −/−). D, The cells were pulsed labeling with BrdU and collected at indicated time point to analyze the progress of the BrdU labelled S phase cells. The percentage of Brdu+ A549 cells with or without PPP2R2A deletion (+/−, −/−) and E, The quantification of the results from D. (n = 2). F, Representative image of DNA fiber tracks in the indicated groups after 40 min pulses with IdU and CldU. G, Effect of PPP2R2A deletion (+/−, −/−) on replication fork speed in A549 cells. ≥100 fibers were counted per conditions/experiment and the ratio of each fiber is represented in dot plot. Statistical information: n = 3, Data are presented as mean ± SD. All the P values were evaluated by two-way ANOVA and the Bonferroni post hoc test. Red line in dot plot indicates mean; *P < 0.05; ***P < 0.001; ****P < 0.0001; ns, nonsignificant.
Figure 5.
Figure 5.. PPP2R2A deficiency promotes metastasis in vivo.
A, Representative bioluminescence imaging of mice after tail vein injection of A549 cells with or without PPP2R2A deletion (+/−, −/−) at different time point. Arrowhead indicates the distant metastasis. B, Quantification of metastasis from the indicated group. The P value was obtained using Fischer exact test. C, Representative images of EMT markers in the lung tissue excised from the indicated group at the end of the experiment (magnification: 40X; scale bar: 33 μm).
Figure 6.
Figure 6.. SNAI2 KO abrogates the PPP2R2A deficiency-induced chemoresistance.
A, B, Cellular toxicity assay was performed in the indicated cell lines following PPP2R2A KD. The cells were treated with cisplatin and paclitaxel for 72 hours. C,D, Cellular toxicity assay was performed in PPP2R2A deleted cells (+/−, −/−) A549 cells with and without SNAI2 KO. The cell survival was measured after treatment with cisplatin or paclitaxel for 72 hours. E, Representative dot plot of A549 cells with or without PPP2R2A deletion (+/−, −/−) using the ALDH fluor assay. Baseline fluorescence was established by inhibiting ALDH activity with DEAB (top panel) and used to generate a gate to identify ALDH+ cells that have not been incubated with DEAB (lower panel). F, The quantification of the result from E. G, Representative dot plot of A549 cells with or without PPP2R2A KO (+/−, −/−). The cells were incubated with CD133-APC antibody to determine CD133+ population. H, The quantification of the result from G. Statistical information: n = 3, Data are presented as the mean ± SD. The P value was calculated using Student t-test (F and H) in or two-way ANOVA (A, B, C and D) followed by Bonferroni post hoc test for multiple comparisons. *P < 0.05; **P < 0.01; ***P < 0.001; ****P < 0.0001; ns, nonsignificant. WT; wild type, KO; knockout.
Figure 7.
Figure 7.. PP2A-B 55α regulates Slug-mediated EMT via a GSK3β-β-catenin pathway.
A-B, Representative Western blots of p-GSK3β and active (non-phospho) form of β-catenin in A549 cells with PPP2R2A deficiency. C, Representative Western blot of p-GSK3β and active (non-phospho) form of β-catenin protein after PPP2R2A reconstitution in PPP2R2A deleted (+/−, −/−) A549 cells. D, Representative image of immunohistochemistry of indicated markers in the lung tissue excised from in vivo tail vein assay (Magnification; 40X; Scale bar, 33 μm). E, Representative western blot of indicated EMT markers in A549 cells expressing wild-type (WT) and phospho-mutant GSK3βS9A. F, G, Representative Western blots of p-GSK3β from endogenous PP2A B55α immunoprecipitated from A549 cells (F) and PP2A B55α from endogenous GSK3β immunoprecipitated from A549 cells (G). H, Representative immunofluorescent images showing a positive interaction between p-GSK3β and PP2A B55α, and between GSK3β and PP2A B55α using a proximity ligation assay in A549 cells (Magnification; 63X; Scale bar, 50 μm). I, A schematic diagram illustrating the working model. Deficiency in PPP2R2A leads to a proliferation defect, but through a GSK3β-β-catenin pathway it also leads to elevated SNAI2 expression and thus an EMT that promotes metastasis and resistance to anti-tumor drug therapy via increased stemness. (Illustration was created using BioRender)

References

    1. Mehlen P, Puisieux A. Metastasis: a question of life or death. Nat Rev Cancer 2006;6:449–58 - PubMed
    1. Herbst RS, Morgensztern D, Boshoff C. The biology and management of non-small cell lung cancer. Nature 2018;553:446–54 - PubMed
    1. Siegel RL, Miller KD, Jemal A. Cancer statistics, 2018. CA: a cancer journal for clinicians 2018;68:7–30 - PubMed
    1. Polyak K, Weinberg RA. Transitions between epithelial and mesenchymal states: acquisition of malignant and stem cell traits. Nat Rev Cancer 2009;9:265–73 - PubMed
    1. Zhang Y, Weinberg RA. Epithelial-to-mesenchymal transition in cancer: complexity and opportunities. Front Med 2018;12:361–73 - PMC - PubMed

MeSH terms

Substances