. 2024 Oct;1870(7):167348.
doi: 10.1016/j.bbadis.2024.167348. Epub 2024 Jul 8.

Loss of Fic causes progressive neurodegeneration in a Drosophila model of hereditary spastic paraplegia

Affiliations

Loss of Fic causes progressive neurodegeneration in a Drosophila model of hereditary spastic paraplegia

Amanda G Lobato et al. Biochim Biophys Acta Mol Basis Dis. 2024 Oct.

Abstract

Hereditary Spastic Paraplegia (HSP) is a group of rare inherited disorders characterized by progressive weakness and spasticity of the legs. Recent newly discovered biallelic variants in the gene FICD were found in patients with a highly similar phenotype to early onset HSP. FICD encodes filamentation induced by cAMP domain protein. FICD is involved in the AMPylation and deAMPylation protein modifications of the endoplasmic reticulum (ER) chaperone BIP, a major constituent of the ER that regulates the unfolded protein response. Although several biochemical properties of FICD have been characterized, the neurological function of FICD and the pathological mechanism underlying HSP are unknown. We established a Drosophila model to gain mechanistic understanding of the function of FICD in HSP pathogenesis, and specifically the role of BIP in neuromuscular physiology. Our studies on Drosophila Fic null mutants uncovered that loss of Fic resulted in locomotor impairment and reduced levels of BIP in the motor neuron circuitry, as well as increased reactive oxygen species (ROS) in the ventral nerve cord of Fic null mutants. Finally, feeding Drosophila Fic null mutants with chemical chaperones PBA or TUDCA, or treatment of patient fibroblasts with PBA, reduced the ROS accumulation. The neuronal phenotypes of Fic null mutants recapitulate several clinical features of HSP patients and further reveal cellular patho-mechanisms. By modeling FICD in Drosophila, we provide potential targets for intervention for HSP, and advance fundamental biology that is important for understanding related rare and common neuromuscular diseases.


Conflict of interest statement

Declaration of competing interest Authors declare that they have no competing interests.

Figures

Figure 1:
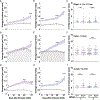
Figure 1:. Fic null flies have impaired locomotion.
Locomotor activity of w1118 and Fic30C females at 5DAE, 20DAE, and 27DAE for (A) movement direction (in degrees) and (B) average speed (in mm/s). Gray line is w1118 age-dependent mean speed with shaded area as confidence interval. Purple line is Fic30C age-dependent mean speed with shaded area as confidence interval. Data are presented as mean ± 95% CI, N=120–420 tracks. Locomotor activity of w1118 and Fic30C males at 5DAE, 20DAE, and 27DAE for (C) movement direction (in degrees) and (D) average speed (in mm/s). Gray line is w1118 age-dependent mean speed with shaded area as confidence interval. Blue line is Fic30C age-dependent mean speed with shaded area as confidence interval. Data are presented as mean ± 95% CI, N=120–700 tracks. (E-G) Kymograph of climbing distance (in mm) for the first 5 seconds of w1118 (gray) and Fic30C females (purple) at 5DAE, 20DAE, and 27DAE, respectively. Lighter background traces correspond to each fly in a vial for one trial with 10 tracks. Darker trace is the mean ± SD of all traces at each second. (H-J) Kymograph of climbing distance (in mm) for the first 5 seconds of w1118 (gray) and Fic30C males (blue) at 5DAE, 20DAE, and 27DAE, respectively. Lighter background traces correspond to each fly in a vial for one trial with 10 tracks. Darker trace is the mean ± SD of all traces at each second. Student’s t-test was performed for statistical analysis. *p<0.05, **p<0.01, ***p<0.001, ****p<0.0001.
Figure 2:
Figure 2:. Fic null flies recapitulate patient neurodegenerative phenotype.
(A) Average incidence of slips (per track) for w1118 (gray) and Fic30C (purple) females at 5DAE, 20DAE, and 27DAE. (B) Average incidence of slips (per track) for w1118 (gray) and Fic30C (blue) males at 5DAE, 20DAE, and 27DAE. Data are presented as mean ± 95% CI (shaded area), N=120–350 tracks. (C) Representative distribution of the number of slip incidences (per track) at 20DAE. Data are presented as mean ± SD, N=140–340 tracks. (D) Average incidence of falls (per track) for w1118 (gray) and Fic30C (purple) females at 5DAE, 20DAE, and 27DAE. (E) Average incidence of falls (per track) for w1118 (gray) and Fic30C (blue) males at 5DAE, 20DAE, and 27DAE. Data are presented as mean ± 95% CI, N=120–350 tracks. (F) Representative distribution of the number of fall incidences (per track) at 20DAE. Data are presented as mean ± SD, N=140–340 tracks. (G) Average incidence of jumps (per track) for w1118 (gray) and Fic30C (purple) females at 5DAE, 20DAE, and 27DAE. (H) Average incidence of jumps (per track) for w1118 (gray) and Fic30C (blue) males at 5DAE, 20DAE, and 27DAE. Data are presented as mean ± 95% CI, N=120–350 tracks. (I) Representative distribution of the number of jump incidences (per track) at 20DAE. Data are presented as mean ± SD, N=140–340 tracks. Student’s t-test was performed for statistical analysis. *p<0.05, **p<0.01, ****p<0.0001.
Figure 3:
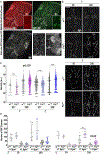
Figure 3:. Fic null flies have reduction of BIP at 5 DAE, followed by age-dependent increase of BIP at 20 DAE.
(A) Ventral nerve cord of 5 DAE fly of genotype UAS-mito-GFP/UAS-nls-GFP;R68A06-GAL4/Cd4-tdTomato were dissected and stained for BIP (gray), as well as imaged for tdTomato (red) and GFP (green). Single channel of tdTomato and GFP are shown in their respective corners (boxed white areas) to highlight the giant fiber axons, as both tdTomato and mitoGFP were expressed in giant fiber neurons, driven by R68A06. Yellow boxed areas are zoom-in of the giant fiber axonal regions and the motor neuron cell body, respectively. (B) Ventral nerve cords of w1118 and Fic30C females and males at 5 DAE and 20 DAE were dissected and stained for BIP (gray). (C) Quantification of BIP intensity. Data are presented as mean ± 95% CI, n=3–5, z-stacks of 15 sections were analyzed. Yellow dotted circles are examples of BIP clusters that were used for quantification. (D) Quantification of the distribution of BIP clusters for females and males at 5 DAE and 20 DAE. Data are presented as mean ± SD. Student’s t-test was performed for statistical analysis. **p<0.01, ***p<0.001, ****p<0.0001. Scale bars (A-B): 30 μm.
Figure 4:
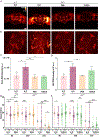
Figure 4:. Chemical chaperones reduce ROS accumulation in Fic null flies.
(A-B) Live DHE staining of the brain (A) and ventral nerve cord (B) from female w1118 flies fed with H2O, and Fic30C flies fed with H2O, PBA, or TUDCA at 5 DAE. Scale bars: 30 μm. Heatmap 0–4095. (C-D) Quantification of DHE fluorescent intensity in the brain (C) and VNC (D), respectively. Data are presented as mean ± SD, n=3–5. (E-F) Average speed of w1118 and Fic30C females fed with H2O, PBA, or TUDCA at 5 DAE, 20 DAE, and 27 DAE. Data are presented as mean ± 95% CI, N=120–300 tracks. One-way ANOVA was performed for statistical analysis. *p<0.05, **p<0.01, ***p<0.001, ****p<0.0001.
Figure 5.
Figure 5.. PBA reduces ROS accumulation in patient-derived fibroblasts.
(A) Live DHE staining in patient-derived fibroblasts. A series of six random microscopic fields were analyzed, and representative images are exhibited. Yellow-boxed rectangles show zoomed-in cell. Scale bar: 50 μm. Heatmap 0–4095. (B) Quantification of DHE fluorescent intensity in (A). Student’s t-test was performed for statistical analysis. ****p<0.0001.

References

    1. Mackay-Sim A, Hereditary Spastic Paraplegia: From Genes, Cells and Networks to Novel Pathways for Drug Discovery. Brain Sci, 2021. 11(3). - PMC - PubMed
    1. Blackstone C, O’Kane CJ, and Reid E, Hereditary spastic paraplegias: membrane traffic and the motor pathway. Nat Rev Neurosci, 2011. 12(1): p. 31–42. - PMC - PubMed
    1. Kumar KR, Blair NF, and Sue CM, An Update on the Hereditary Spastic Paraplegias: New Genes and New Disease Models. Mov Disord Clin Pract, 2015. 2(3): p. 213–223. - PMC - PubMed
    1. Martinello C, Panza E, & Orlacchio A, Hereditary spastic paraplegias proteome: common pathways and pathogenetic mechanisms. Expert Review of Proteomics, 2023. 20(7–9): p. 171–188. - PubMed
    1. Gumeni S, et al. , Hereditary Spastic Paraplegia and Future Therapeutic Directions: Beneficial Effects of Small Compounds Acting on Cellular Stress. Front Neurosci, 2021. 15: p. 660714. - PMC - PubMed

Publication types

MeSH terms

Substances

LinkOut - more resources