. 2024 Jul 10;15(1):5778.
doi: 10.1038/s41467-024-50223-1.

Ribonuclease 4 functions as an intestinal antimicrobial protein to maintain gut microbiota and metabolite homeostasis

Affiliations

Ribonuclease 4 functions as an intestinal antimicrobial protein to maintain gut microbiota and metabolite homeostasis

Jun Sun et al. Nat Commun. .

Abstract

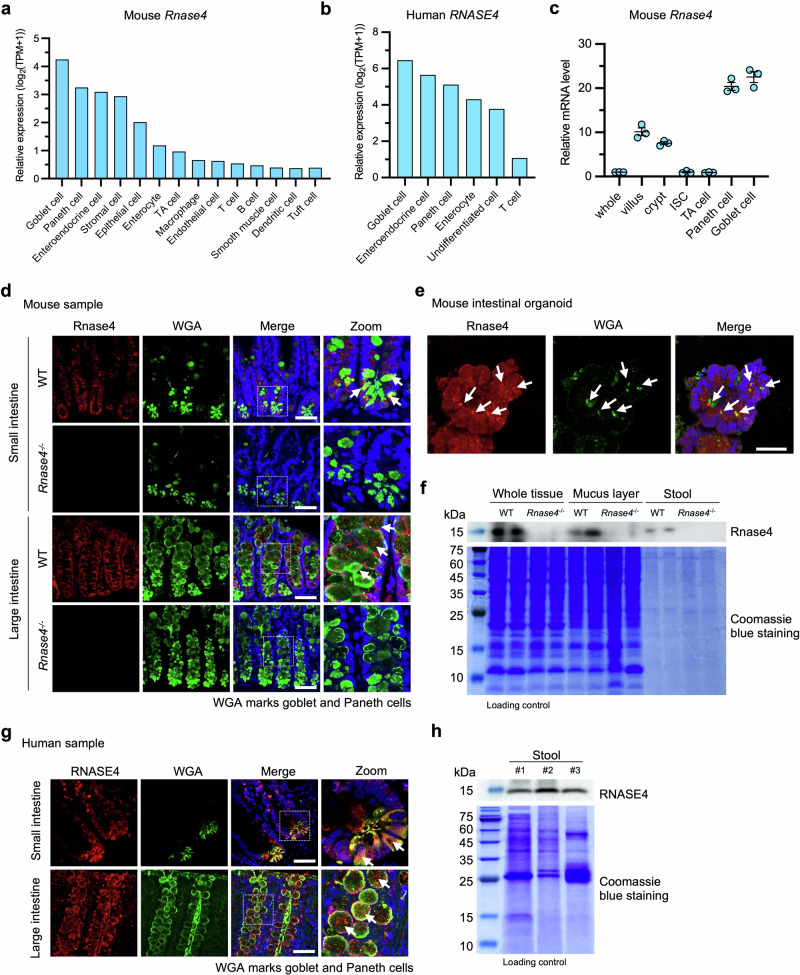
Antimicrobial proteins contribute to host-microbiota interactions and are associated with inflammatory bowel disease (IBD), but our understanding on antimicrobial protein diversity and functions remains incomplete. Ribonuclease 4 (Rnase4) is a potential antimicrobial protein with no known function in the intestines. Here we find that RNASE4 is expressed in intestinal epithelial cells (IEC) including Paneth and goblet cells, and is detectable in human and mouse stool. Results from Rnase4-deficient mice and recombinant protein suggest that Rnase4 kills Parasutterella to modulate intestinal microbiome, thereby enhancing indoleamine-2,3-dioxygenase 1 (IDO1) expression and subsequently kynurenic and xanthurenic acid production in IECs to reduce colitis susceptibility. Furthermore, deceased RNASE4 levels are observed in the intestinal tissues and stool from patients with IBD, correlating with increased stool Parasutterella. Our results thus implicate Rnase4 as an intestinal antimicrobial protein regulating gut microbiota and metabolite homeostasis, and as a potential diagnostic biomarker and therapeutic target for IBD.


Conflict of interest statement

The authors declare no competing interests.

Figures

Fig. 1
Fig. 1. Rnase4 is expressed in intestinal epithelium and detected in stool samples.
a, b Rnase4 expression levels in different intestinal cell types based on single-cell RNA sequencing data, sourced from Mouse Cell Atlas (bis.zju.edu.cn/MCA) and Human Protein Atlas (www.proteinatlas.org). c Rnase4 expression levels in different mouse intestinal epithelial cell types by quantitative PCR (n = 3 mice). ISC intestinal stem cell, TA transit-amplifying. d, e Rnase4 localization in small and large intestines of WT and Rnase4−/ mice, and intestinal organoids cultured from WT by immunofluorescence staining. The nuclei were stained with Hoechst 33342. The white arrows indicate the localization of Rnase4 in secretory, granule-like structure of goblet and Paneth cells. Scale bar, 25 μm. f Rnase4 protein levels in colon, mucus layer, and stool sample of WT and Rnase4−/− mice by immunoblotting. Coomassie blue staining shows the total protein loading amount. g RNASE4 localization in human small and large intestines by immunofluorescence staining. The nuclei were stained with Hoechst 33342. The white arrows indicate the localization of RNASE4 in secretory, granule-like structure of goblet and Paneth cells. Scale bar, 25 μm. h RNASE4 protein levels in three human stool samples by immunoblotting. Coomassie blue staining shows the total protein loading amount. Data are presented as mean ± SEM (c). Representative images from three independent experiments are shown (d, e and g).
Fig. 2
Fig. 2. Mice lacking Rnase4 have an altered intestinal microbiota.
a High-throughput 16 S rDNA sequencing of stool bacterial DNAs from WT and Rnase4−/− mice. The y-axis represents the mean of the observed species, indicative of bacterial diversity within each group (n = 6). b Unweighted UniFrac principal-coordinate analysis of the β-diversity of microbiota composition in WT or Rnase4−/− mice (n = 6). c Quantification of unweighted UniFrac distance in (b). The boxplot represents the minimum value, first, median, and third quartiles, and maximum value. d Linear discriminant analysis effect size showing the most differentially abundant taxa of the gut microbiota between WT and Rnase4−/− mice (n = 6). e The abundance of Mucispirillum and Parasutterella in the gut microbiota of WT or Rnase4−/− mice by quantitative PCR analysis (n = 6). f Fluorescent in situ hybridization of colonic lumen sections from WT or Rnase4−/− mice showing the presence of Parasutterella (red) and Mucispirillum (cyan) in the lumen. Scale bar, 25 μm. g Analysis of the number of Parasutterella and Mucispirillum in the lumen. At least 10 sections per mouse were analyzed (n = 6). Data are presented as mean ± SEM; * p < 0.05; ** p < 0.01; *** p < 0.001 by two-tailed unpaired Student’s t-test (a, e, and g) or two-way analysis of similarities (ANOSIM) test (c).
Fig. 3
Fig. 3. Rnase4 deficiency exacerbates mouse colitis.
a, b Body weight loss (a) and disease activity index (b) of WT and Rnase4−/− mice during 2.5% DSS treatment (n = 6). cf Colon length (c), serum fluorescein isothiocyanate-dextran level (d), representative H&E staining image (e) and histological score of colonic sections (f) from WT and Rnase4−/− mice 8 days after 2.5% DSS administration (n = 6). g, h Quantitative mRNA expression (g) and protein level (h) of indicated cytokines in the colons of WT and Rnase4−/− mice 8 days after 2.5% DSS treatment (n = 6). Scale bar, 50 μm in H&E staining. Data are presented as mean ± SEM for (ad, f and h) and as mean for (g); * p < 0.05; ** p < 0.01; *** p < 0.001 by two-tailed unpaired Student’s t-test (ad and h) or two-tailed Mann–Whitney U test (f).
Fig. 4
Fig. 4. Rnase4-regulated bacteria play a key role in colitis.
a Diagram of the co-housing experiment. The heatmap shows the relative abundance of Parasutterella in each mouse after normalization to the average of WT (co-WT) group. b, c Body weight loss (b) and colon length (c) of WT (co-WT) and WT (co-Rnase4−/−) mice with DSS-induced colitis (n = 6). d Diagram of the gut microbiota transplantation experiment. The heatmap shows the relative abundance of Parasutterella in each mouse after normalization to the average of the WT → WT group. e, f Body weight loss (e) and colon length (f) of WT → WT and Rnase4−/− → WT mice with DSS-induced colitis (n = 6). g Diagram of Parasutterella gavage and DSS induction to analyze the relationship between Parasutterella and colitis progression. The heatmap shows the relative abundance of Parasutterella in each mouse after normalization to the average of the WT–BHI group. h, i Body weight loss (h) and colon length (i) of WT–BHI, WT–PARA, Rnase4−/−–BHI and Rnase4−/−–PARA mice with DSS-induced colitis (n = 6). Data are presented as mean ± SEM for (b, c, e, f, h and i) and as mean for (a, d and g); * p < 0.05; ** p < 0.01; *** p < 0.001 by two-tailed unpaired Student’s t-test (b, c, e, f, h and i).
Fig. 5
Fig. 5. Rnase4 directly kills Parasutterella.
a Antibacterial efficacy of recombinant Rnase4 and its enzymatic null mutant Rnase4-K40A against Parasutterella. Bovine serum albumin (BSA) served as a control (n = 3 independent experiments). b, c Transmission (b) and scanning (c) electron microscopic micrographs of Parasutterella treated with different concentrations of Rnase4. The bottom panel of images provides a zoomed-in view of the regions indicated in the top images. The red arrows show the damage to the bacterial cell wall. Scale bar, 1 μm. d PI staining of Parasutterella treated with different concentrations of Rnase4. The left panel shows the percent of PI positive bacteria in each group (n = 9 fields per group). Scale bar, 1 μm. e Immunofluorescence staining of RNASE4 in Parasutterella after incubation with Rnase4. Scale bar, 1 μm. Data are presented as mean ± SEM. Representative images from four independent experiments are shown (be).
Fig. 6
Fig. 6. Rnase4 associated Parasutterella regulates intestinal tryptophan metabolism.
a Unweighted UniFrac principal-coordinate analysis of the β-diversity of metabolite composition in stool samples of WT or Rnase4−/− mice (n = 6). b Volcano plot showing differentially expressed metabolites between WT and Rnase4−/− mice (n = 6). c KEGG enrichment analysis of differential metabolites between WT and Rnase4−/− mice. d Relative levels of kynurenic acid and xanthurenic acid in stool samples of WT and Rnase4−/− mice (n = 6). e Quantitative mRNA expression of selected tryptophan metabolizing genes in colonic tissues from WT, Rnase4−/−, and Parasutterella gavaged mice (WT + PARA) as measured by quantitative PCR (n = 5 independent experiments). f IDO1 protein levels in colonic tissues from the three groups in (e) by immunoblotting. gi Quantitative mRNA (g, n = 5 independent experiments) and protein expressions of IDO1 (h), and relative levels of kynurenic acid and xanthurenic acid (i, n = 3 independent experiments) in human intestinal epithelial cells (HIEC-6) treated with Parasutterella culture medium. Data are presented as mean ± SEM for (d, e, g, and i); ** p < 0.01; *** p < 0.001 by two-tailed unpaired Student’s t-test (d, e, g, and i). Significantly altered metabolites were determined using the two-tailed Mann–Whitney U test, and adjusted p < 0.05 were considered statistically significant (b). KEGG enrichment analyses were carried out with the Fisher’s exact test, and FDR correction for multiple testing was performed (c).
Fig. 7
Fig. 7. RNASE4 is a potential IBD diagnostic biomarker and therapeutic target.
a Quantitative mRNA expression of RNASE4 in colon samples from healthy participants (Ctrl, n = 25) and patients with IBD (n = 73), including ulcerative colitis (n = 27) and Crohn’s disease (n = 46). Expression values were normalized to β-actin. b Quantitative mRNA expression of RNASE4 in normal and inflamed colon samples from patients with IBD (n = 40). c, d Representative immunoblotting pictures (c) and quantitative results (d) of RNASE4 protein in normal and inflamed colonic tissues from patients with IBD (n = 20). e, f RNASE4 concentration (e) and relative abundance of Parasutterella (f) in stool samples from healthy participants (Ctrl, n = 45) and patients with IBD (n = 64), including UC (n = 15) and CD (n = 49). g Correlation between RNASE4 level and the abundance of Parasutterella in stool samples. h Scheme of oral RNASE4 treatment in Rnase4−/− mice to analyze its preventive potential. i, j Body weight loss (i) and colon length (j) of WT, Rnase4−/−, and Rnase4−/− supplemented with the recombinant RNASE4 protein (Rnase4−/−+RNASE4) mice during DSS-induced colitis (n = 6). k Relative abundance of Parasutterella in stool samples from WT, Rnase4−/−, and Rnase4−/−+ RNASE4 mice (n = 6). Data are presented as mean ± SEM for (a, e, f, i, j and k); * p < 0.05; ** p < 0.01; ** p < 0.001 by two-tailed paired Student’s t-test (b and d), and two-tailed unpaired Student’s t-test (a, e, f, i, j and k). The correlation was assessed by simple linear regression analysis (g).

References

    1. de Vos WM, Tilg H, Van Hul M, Cani PD. Gut microbiome and health: mechanistic insights. Gut. 2022;71:1020–1032. doi: 10.1136/gutjnl-2021-326789. - DOI - PMC - PubMed
    1. Zheng D, Liwinski T, Elinav E. Interaction between microbiota and immunity in health and disease. Cell Res. 2020;30:492–506. doi: 10.1038/s41422-020-0332-7. - DOI - PMC - PubMed
    1. Caruso R, Lo BC, Núñez G. Host-microbiota interactions in inflammatory bowel disease. Nat. Rev. Immunol. 2020;20:411–426. doi: 10.1038/s41577-019-0268-7. - DOI - PubMed
    1. Ju T, Kong JY, Stothard P, Willing BP. Defining the role of Parasutterella, a previously uncharacterized member of the core gut microbiota. ISME J. 2019;13:1520–1534. doi: 10.1038/s41396-019-0364-5. - DOI - PMC - PubMed
    1. Ricanek P, et al. Gut bacterial profile in patients newly diagnosed with treatment-naïve Crohn’s disease. Clin. Exp. Gastroenterol. 2012;5:173–186. doi: 10.2147/CEG.S33858. - DOI - PMC - PubMed

MeSH terms