. 2024 Jul 10;15(1):5818.
doi: 10.1038/s41467-024-50222-2.

Compartmentalized mitochondrial ferroptosis converges with optineurin-mediated mitophagy to impact airway epithelial cell phenotypes and asthma outcomes

Affiliations

Compartmentalized mitochondrial ferroptosis converges with optineurin-mediated mitophagy to impact airway epithelial cell phenotypes and asthma outcomes

Kazuhiro Yamada et al. Nat Commun. .

Abstract

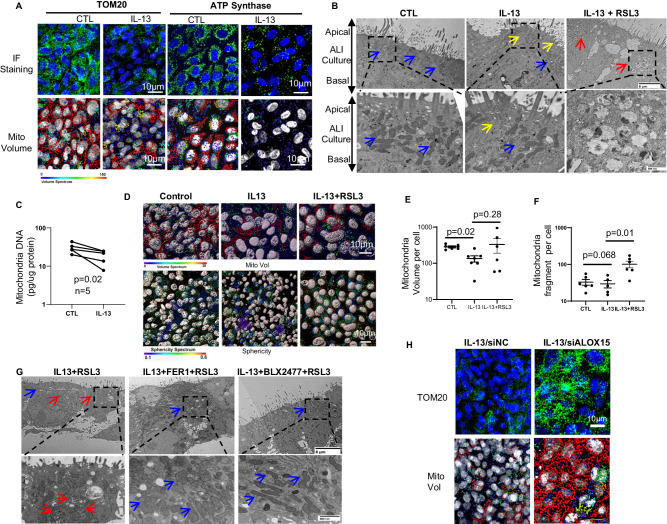
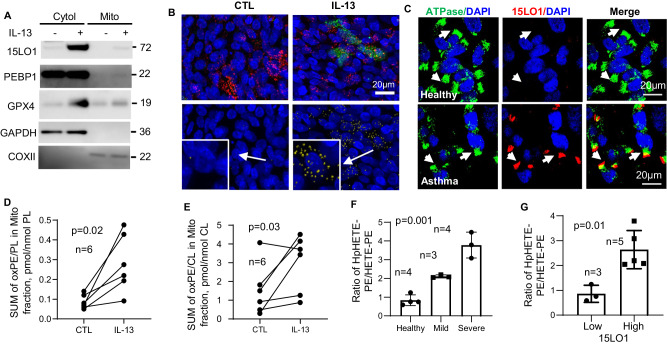
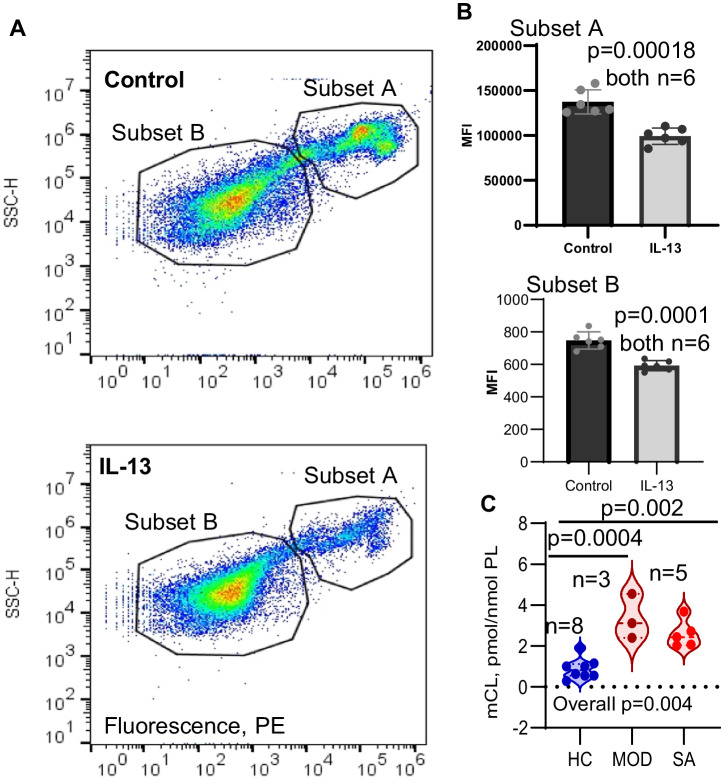
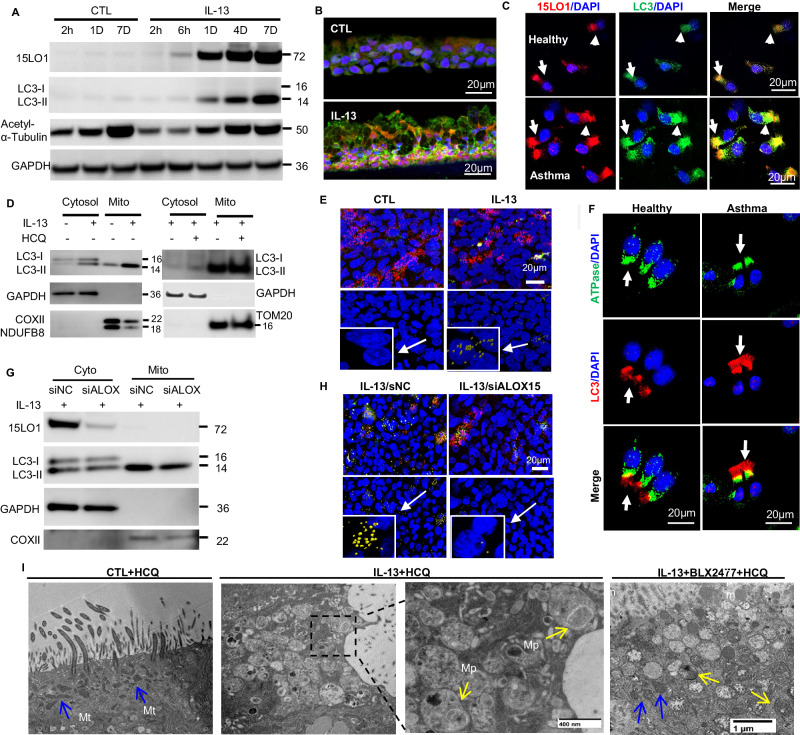
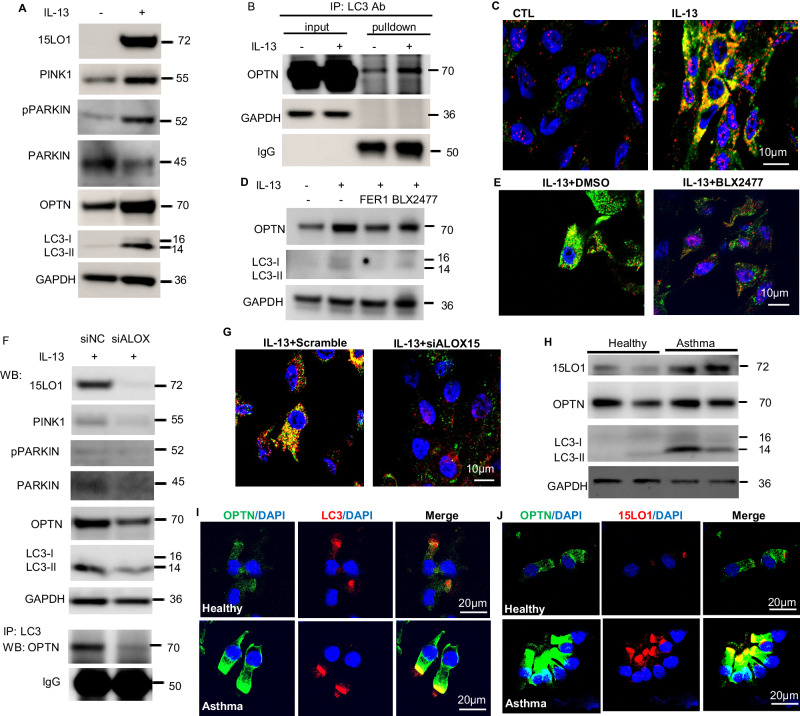
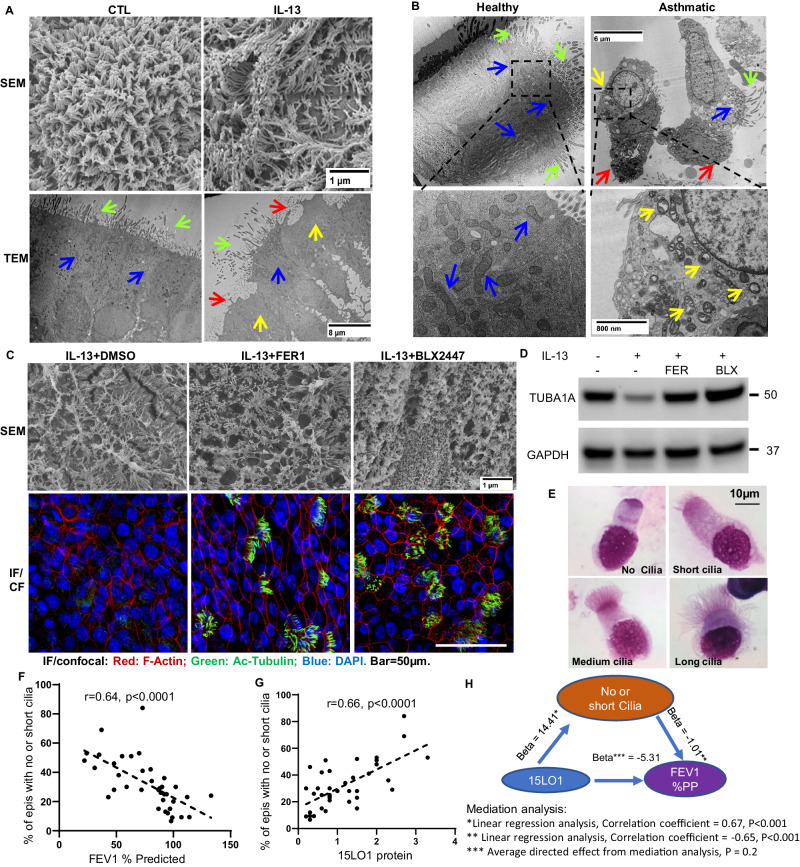
A stable mitochondrial pool is crucial for healthy cell function and survival. Altered redox biology can adversely affect mitochondria through induction of a variety of cell death and survival pathways, yet the understanding of mitochondria and their dysfunction in primary human cells and in specific disease states, including asthma, is modest. Ferroptosis is traditionally considered an iron dependent, hydroperoxy-phospholipid executed process, which induces cytosolic and mitochondrial damage to drive programmed cell death. However, in this report we identify a lipoxygenase orchestrated, compartmentally-targeted ferroptosis-associated peroxidation process which occurs in a subpopulation of dysfunctional mitochondria, without promoting cell death. Rather, this mitochondrial peroxidation process tightly couples with PTEN-induced kinase (PINK)-1(PINK1)-Parkin-Optineurin mediated mitophagy in an effort to preserve the pool of functional mitochondria and prevent cell death. These combined peroxidation processes lead to altered epithelial cell phenotypes and loss of ciliated cells which associate with worsened asthma severity. Ferroptosis-targeted interventions of this process could preserve healthy mitochondria, reverse cell phenotypic changes and improve disease outcomes.


Conflict of interest statement

Dr. Wenzel is principal investigator on an investigator initiated/single center study of mucociliary clearance and the IL-4R antibody dupilumab in asthma patients funded by Regeneron. No other authors declare any conflicts.

Figures

Fig. 1
Fig. 1. IL-13 induces mitochondria loss via 15LO1-dependent compartmentalized ferroptosis.
A IL-13 decreases TOM20 and ATPsynthase staining (top panel; Green: TOM20 or ATPsynthase; Blue: DAPI) and measurements of mitochondria volume (bottom panel, the volume is pseudo-colored with red indicating the regions with the highest mitochondrial volume, as shown in the “volume spectrum”) (Representative immunofluorescence (IF) staining-confocal (ICF) microscopy). Representative images from n = 4 biologic replicates (quantitative analysis in Supplementary Fig. 1A, B). B Mitochondria are enriched in apical/ciliary area and decreased by IL-13 under transmission electron microscopy (TEM). RSL3 induces mitochondrial swelling and damage (last panel). Blue arrows: high density normal mitochondria; Yellow arrows: low density mitochondria and loss. Red arrows: Swollen and damaged mitochondria (representative sample from multiple sections, n = 1). Scale bar, 8 µm (upper panel) and 800 nm (lower panel). C IL-13 decreases intracellular mitochondria DNA (paired T-testing), as measured by qPCR, normalized to total cell lysate protein. HAECs were stimulated with/without IL-13 for 7 days at day 0 of ALI. Paired T-testing of n = 5 biological replicates. D RSL3 induces mitochondrial fragmentation in IL-13-treated HAECS (IF/CF). HAECs stimulated with IL-13 for 7 days at Day 0 of ALI before RSL3 treatment (10 µM, 2 h). Cells fixed and stained with TOM20. E Mitochondria volume assessed using surface rendering of confocal z-stacks (Imaris, Bitplane) pseudo-colored as indicated by “volume spectrum” in (D) (top panel) by paired t-testing (F) mitochondria fragmentation assessed based on size and shape of mitochondria as reflected by sphericity in (D) (bottom panel, mitochondria are progressively smaller and rounder as color changes from purple to red). Data presented as mean ± s.d, and analyzed using unpaired T-testing based on n = 5–7 biological replicates. G Pretreatment of FER-1 and/or BLX2477 limit IL-13-induced mitochondrial damage. Red arrows: swollen damaged mitochondria. Blue arrows: high density and normal mitochondria (representative sample from multiple sections, n = 1). Scale bar 8 µm (upper panel) and 800 nm (lower panel). H siALOX15 transfection restores IL-13-induced mitochondria loss indicated by increases in mitochondrial volume (IF/CF). Representative images from n = 4 biologic replicates. Data quantification and RSL3 impact under control conditions in Supplementary Fig. 1G, H. Source data are provided as Source Data file.
Fig. 2
Fig. 2. Mitochondrial 15LO1 pathway activity drives compartmentalized ferroptosis.
A IL-13 induces ferroptosis-associated 15LO1 protein expression in the mitochondrial fractions. HAECs were stimulated with/without IL-13 for 7 days. Cytosolic and mitochondrial fractions were isolated by ultracentrifugation for WB analysis. Representative images from n = 3 biologic replicates, with data quantification analysis in Supplementary Fig. 2A–F. B IL-13 increases 15LO1/ATPsynthase colocalized puncta in HAECs in vitro. Top panel: IF/CF staining. Red: ATPsynthase; Green: 15LO1; Blue: DAPI; Yellow: colocalization. Bottom panel: co-localized 15LO1/ATPsynthase puncta in yellow. Lower left corner digitally magnified. Representative images from n = 3 biologic replicates, with quantitative analysis in Supplementary Fig. 2H. C 15LO1/ATPsynthase colocalization (IF/CF) in freshly blushed HAECs from healthy and asthmatic participants. Green: ATPsynthase; Red: 15LO1; Blue: DAPI; Yellow: colocalization. White arrows: cilia area. Representative images from n = 3 biologic samples from individual donors in each group. D IL-13 increased oxPE in mitochondrial fractions in HAECs in vitro as normalized to the total intracellular phospholipid (PL) or (E) cardiolipin (CL) by LC/MS analysis. Significance analyzed by paired T-testing of n = 6 biological replicates. F The ratio of 15-HpETE-PE to 15 HETE-PE is higher in freshly brushed HAECs from severe asthmatic as compared to healthy control participants (one way ANOVA) (G) and higher in those participants (mild to severe asthma) with high 15LO1 protein (by WB). Data are presented as mean ± s.d, and differences determined by one-way ANOVA (F) and unpaired t-test (G) based on n = 3–5 biological samples from individual donors. Source data are provided as a Source Data file.
Fig. 3
Fig. 3. IL-3 treatment decreases mitochondrial membrane potential in HAEC.
HAECs were cultured with media alone under ALI for 9 days and then stimulated or not with IL-13 for 5 days before harvested for membrane potential assessment by Tetramethylrhodamine, methyl ester (TMRM). A Scatter plot of side-scatter intensity versus TMRM fluorescence intensity for untreated (upper panel) and IL-13 treated cells (bottom panel). B The mean of fluorescence intensities (MFI) of subset A and subset B in control and IL-13 treated cells. Data are presented as mean ± s.d, and significance analyzed by unpaired T-testing of n = 6 biological replicates. C LC/MS analysis showing elevated levels of mCLs in Mild-Moderate (MOD) and Severe Asthma (SA) as compared to HC samples (LC/MS analysis). Differences were determined by one-way ANOVA followed by intergroup unpaired t-testing of n = 3 to 8 biological samples per group from individual donors (see Table 1 for details). oxCL data in Supplementary Fig. 3. Source data are provided as a Source Data file.
Fig. 4
Fig. 4. Compartmentalized ferroptosis increases mitochondrial LC3 and mitophagy.
A IL-13-induces 15LO1 and LC3-II expression by WB over time, and 15LO1 increases prior to LC3-II. Representative image of n = 3 biological replicates. B IL-13 increased 15LO1/LC3 expression and colocalization in HAECs in vitro compared to control (CTL) (IF/CF on cross section of ALI membranes). Representative image of n = 3 biological replicates. C 15LO1 and LC3 colocalization in fresh healthy and asthmatic HAECs using IF/CF. Red: 15LO1; Green: LC3; Blue: DAPI; Yellow: colocalization. Representative images of n = 3 individual donors/group. D IL-13 induces LC3 expression with enrichment of activated LC3-II in mitochondrial fractions. HCQ (10 µM, overnight) pretreatment further increases LC3-II in mitochondria fractions (GAPDH as loading control). Representative images from n = 3 biologic replicates. E IL-13 increases LC3/ATPsynthase colocalization in HAECs in vitro. Top panel: IF staining, Red: ATPsynthase; Green: LC3; Blue: DAPI; Yellow: colocalization. Bottom panel: Colocalized LC3/ATPsynthase puncta indicated as yellow. Lower left corner: digitally magnified view of cells at tail of arrow. Representative images from n = 3 biologic replicates. F LC3/ATPsynthase colocalization in fresh HAECs using IF. Green: ATPsynthase; Red: LC3; Blue: DAPI; Yellow: colocalization. White arrow: cilia area. Representative images of n = 3 individual donors/group. G 15LO1 KD (siALOX15) lowered mitochondrial LC3-II under IL-13 conditions. H 15LO1 KD/siALOX reduced LC3/ATPsynthase colocalization under IL-13 conditions. Top panel: IF staining, Red: ATPsynthase; Green: LC3; Blue: DAPI; Yellow: colocalization. Bottom panel: “Having” analysis of co-localized LC3/ATPsynthase puncta (indicated in yellow). Lower left corner: digitally magnified view of cells at tail of arrow. IF image scale bar: 20 µm. Representative images of n = 3 biologic replicates. I Mitophagic membranes are present in HAECs under IL-13 + HCQ conditions by TEM. The 15LO1 inhibitor BXL2477 (2 µM, overnight) lessens mitophagy and partially rescues mitochondria as compared to IL-13 + HCQ. HAECs cultured under ALI (9 days) before stimulation with IL-13 for 5 days), BLX2447 (2 µM, overnight), HCQ (10 µM) added 2 hrs before fixation. Blue arrows: intact mitochondria (Mt); yellow arrows/star: mitophagy (Mp) (representative sample from multiple sections, n = 1). Scale bar, 1 µm (regular panel) and 400 nm (enlarged panel). Data quantification and individual images by antibody in Supplementary Fig. 4. Source data provided as Source Data file.
Fig. 5
Fig. 5. 15LO1-dependent ferroptotic processes activate PINK/Parkin/Optineurin mitophagy.
A PINK1/pParkin/Optineurin (OPTN) /LC3-II are increased under IL13 conditions using Western Blot analysis (n = 3 biological replicates). B IL-13 increases OPTN co-immunoprecipitation with LC3 (Co-IP/WB) (n = 3 biological replicates). C Increased OPTN co-localization with LC3 under IL-13 conditions. IF/CF: Green: OPTN; Red: LC3; Blue: DAPI; Yellow: merge (n = 3 biological replicates). Scale bar as indicated. D Pretreatment with FER-1 and/or BLX2477 suppress IL-13-induced LC3-II ALI for 9 days and IL-13 for 5 days, with/without simultaneous FER-1 (1 µM) and/or BLX2477 (2 µM) each for days (n = 3 biological replicates). E 15LO1 inhibition with BLX2477 lowers LC3 colocalization with OPTN under IL-13 conditions. Green: OPTN; Red: LC3; Blue: DAPI; Yellow: merge. (n = 3 biological replicates). Scale bar as indicated. F 15LO1 KD/siLALOX15 lowers PINK1/PARKIN pathway activation (WB) and OPTN-LC3 binding (Co-PI/WB) under IL-13 conditions (n = 3 biological replicates), and (G) 15LO1/siALOX15 lowers LC3 colocalization with OPTN under IL-13 conditions. Green: OPTN; Red: LC3; Blue: DAPI; Yellow: merge (n = 3 biological replicates). H Higher OPTN expression in association with 15LO1 and LC3 in freshly brushed asthmatic HAECs as compared to healthy controls by WB (n = 32 individual donors, see Table 2 and supp Fig S5T for densitometry quantification). I Representative IF/CF images showing OPTN-LC3 and (J) OPTN-15LO1 colocalization in freshly blushed HAECs from healthy and asthmatic participants (n = 3 individual donors/group). Green: OPTN; Red: LC3 or 15LO1; Blue: DAPI; merge. Source data provided as Source Data file.
Fig. 6
Fig. 6. Functional implication of 15LO1-dependent ferroptosis.
A Fewer ciliated cells under IL-13 compared to control conditions by SEM (upper panel) and TEM (lower panel) (n = 3 biological replicates). Green arrows: cilia; Red arrows: areas denuded of cilia. Blue arrows: “healthy” mitochondria; Yellow arrows: decreased mitochondria. B Loss of cilia and mitochondria, as well as presence of swollen mitochondria in fresh epithelial cells from a severe asthmatic compared to HC participant (TEM) (n = 3–5 samples from individual donors in each group). Green arrows: cilia; Red arrows: areas denuded of cilia. Blue arrows: “healthy” mitochondria; Yellow arrows: swollen mitochondria. C FER-1 (1 µM, 5 days) and/or BLX2477(2 µM, 5 days) prevent IL-13-induced cilia structural changes and ciliated cell loss by SEM (upper panel) and by tubulin staining (IF/CF, bottom panel). D Under the same conditions, FER-1 and BLX2477 increase TUB1A expression by WB under IL-13 conditions. Representative images n = 3 biological replicates. E Representative images of fresh epithelial cells with varying cilia length (Diff-Quik staining) (n = 38 individual donors, see Table 3 for Demographics). F Percentages of total mature epithelial cells ex vivo with no/or short cilia negatively correlate with FEV1% predicted and (G) 15LO1 protein (by WB of same cells) positively correlate with percentage of cells with no/short cilia (Bivariate linear correlation). H Mediation analysis supports that the majority of the potential impact of 15LO1 on lung function (FEV1% predicted) is through effects on ciliated cell phenotype. Data quantification and individual antibody images in Supplementary Fig. 6. Source data provided as Source Data file.

Similar articles

Cited by

References

    1. Dixon SJ, et al. Ferroptosis: an iron-dependent form of nonapoptotic cell death. Cell. 2012;149:1060–1072. doi: 10.1016/j.cell.2012.03.042. - DOI - PMC - PubMed
    1. Gao M, et al. Role of Mitochondria in Ferroptosis. Mol. Cell. 2019;73:354–363.e353. doi: 10.1016/j.molcel.2018.10.042. - DOI - PMC - PubMed
    1. Gan, B. Mitochondrial regulation of ferroptosis. J. Cell Biol.220, 1–10 (2021). - PMC - PubMed
    1. Chu HW, et al. Expression and activation of 15-lipoxygenase pathway in severe asthma: relationship to eosinophilic phenotype and collagen deposition. Clin. Exp. Allergy. 2002;32:1558–1565. doi: 10.1046/j.1365-2222.2002.01477.x. - DOI - PubMed
    1. Wenzel SE, et al. PEBP1 Wardens Ferroptosis by Enabling Lipoxygenase Generation of Lipid Death Signals. Cell. 2017;171:628–641.e626. doi: 10.1016/j.cell.2017.09.044. - DOI - PMC - PubMed

MeSH terms