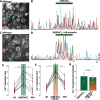
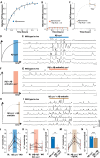
. 2024 Jul 10;15(1):5819.
doi: 10.1038/s41467-024-50153-y.

β-amyloid monomer scavenging by an anticalin protein prevents neuronal hyperactivity in mouse models of Alzheimer's Disease

Affiliations

β-amyloid monomer scavenging by an anticalin protein prevents neuronal hyperactivity in mouse models of Alzheimer's Disease

Benedikt Zott et al. Nat Commun. .

Abstract

Hyperactivity mediated by synaptotoxic β-amyloid (Aβ) oligomers is one of the earliest forms of neuronal dysfunction in Alzheimer's disease. In the search for a preventive treatment strategy, we tested the effect of scavenging Aβ peptides before Aβ plaque formation. Using in vivo two-photon calcium imaging and SF-iGluSnFR-based glutamate imaging in hippocampal slices, we demonstrate that an Aβ binding anticalin protein (Aβ-anticalin) can suppress early neuronal hyperactivity and synaptic glutamate accumulation in the APP23xPS45 mouse model of β-amyloidosis. Our results suggest that the sole targeting of Aβ monomers is sufficient for the hyperactivity-suppressing effect of the Aβ-anticalin at early disease stages. Biochemical and neurophysiological analyses indicate that the Aβ-anticalin-dependent depletion of naturally secreted Aβ monomers interrupts their aggregation to neurotoxic oligomers and, thereby, reverses early neuronal and synaptic dysfunctions. Thus, our results suggest that Aβ monomer scavenging plays a key role in the repair of neuronal function at early stages of AD.


Conflict of interest statement

A.S. is founder and shareholder of Pieris Pharmaceuticals, Inc. Anticalin® is a registered trademark of Pieris Pharmaceuticals GmbH, Germany. All other authors declare no competing interests.

Figures

Fig. 1
Fig. 1. Aβ-anticalin treatment suppresses neuronal hyperactivity in vivo.
A X-ray structure (PDB ID: 4MVL) of the Aβ-anticalin with its β-barrel formed by eight anti-parallel β-strands and four hypervariable loops shown in ribbon presentation. The bound central segment of the Aβ(1-40) peptide is shown as sticks and colored green. B Two-photon imaging setup for in vivo imaging of the hippocampal CA1 region. The filled pipette for the application of the Aβ-anticalin is indicated in orange. ACSF, arterial cerebrospinal fluid; CA1, cornu ammonis 1; DG, dentate gyrus. C Representative two-photon image of the pyramidal layer of the hippocampal CA1 region in a 2-month-old APP23xPS45 mouse after staining with the organic Ca2+-indicator Cal-520 AM. The injection pipette for the application of Aβ-anticalin is visible as a dark shadow on the left side of the image and schematically outlined for clarity. Scale bar: 10 µm. D Ca2+-traces recorded from the six representative neurons labeled in C under baseline conditions (left), during the application of 10 µM Aβ-anticalin (middle) and after a washout period of 5 min (right). E Percentage of hyperactive cells (more than 20 Ca2+-transients per min) in untreated (left) and Aβ-anticalin-treated APP23xPS45 (middle) as well as in untreated wild-type animals (right). F Cumulative probability of the neuronal activity in untreated (black) and Aβ-anticalin-treated APP23xPS45 mice (orange) and in untreated wild-type mice (blue). *p < 0.05, ***p < 0.001, n.s. not significant. Two-sided Wilcoxon signed-rank or rank sum test (E), two-sided Kolmogorow–Smirnow-test (F).
Fig. 2
Fig. 2. The Aβ-anticalin normalizes glutamate transmission in young APP23xPS45 mice.
A Schematic depiction of the SF-iGluSnFR-based glutamate imaging experiment. AAV injection in vivo (top) followed by in vitro population imaging (bottom). B Individual synaptically evoked glutamate transients (gray) and average (colored) from 2-month-old APP23xPS45 (top) or age-matched wild-type (bottom) mice for one, two, five and ten stimuli as indicated by black triangles. Inset: Two-photon image of iGluSnFR3-expressing CA1 pyramidal neurons and the positions of the pipettes. Appl: application pipette, Stim: stimulation pipette, FOV: field of view (scale bar: 50 µm). C Area under the curve (AUC) of individual glutamate transients from wild-type (40 transients in N = 8 slices) and APP23xPS45 (65 transients in N = 13 slices) mice for one, two, five and ten stimuli. The error bars depict SEM. D Same as (B) for ten stimuli in a slice from an APP23xPS45 mouse during baseline conditions (left), during the application of Aβ-anticalin (10 µM; middle) and after washout (right). E Summary data of the experiments in (D) from N = 6 slices. Dots represent the mean area under the curve (AUC) of one slice. Box plot is represented as median and quartiles (bounding box).Whisker length is the distance to the furthest observation, but no further than 1.5 times the range from the median to the respective quartile. F Comparison of the AUC of glutamate transients during application of Aβ-anticalin (10 µM) or lipocalin 2 (10 µM, N = 7 slices) in APP23xPS45 mice normalized to the respective AUC under baseline conditions (mean +/− SEM). Source data for Fig. 2E, F are provided as a Source Data file. n.s. not significant, *p < 0.05, **p < 0.005. Two-sided Wilcoxon rank sum test (C, F), two-sided Wilcoxon signed-rank test (E).
Fig. 3
Fig. 3. Ineffectivity of the Aβ-anticalin to prevent Aβ-dimer-induced neuronal hyperactivity.
A Representative two-photon image of the pyramidal layer of the hippocampal CA1 region in a 2-month-old wild-type mouse after staining with the organic Ca2+-indicator Cal-520 AM. B Superimposed representative Ca2+-traces of the six neurons cycled in (A) under baseline conditions (left), during the application of 500 nM [AβS26C]2 and after 5 min washout. The colors of the Ca2+-traces correspond to the circles in (A). C, D same as (A and B) for the co-application of [AβS26C]2 (500 nM) and Aβ-anticalin (1 µM). E Summary data of the application experiments in (B) from N = 7 mice. Each dot represents the mean number of Ca2+ transients per minute for all observed neurons in one mouse under baseline conditions (BL, left), during the application of [AβS26C]2 (middle), and after washout (WO, right). Data are presented as mean values +/− SEM. (F) Same as (E) for the experiment in (D). G Number of Ca2+-transients during the application of [AβS26C]2 alone (N = 7 mice) or mixed with Aβ-anticalin (N = 7), normalized to the respective mean baseline activity (mean +/− SEM). Source data for Fig. 3G are provided as a Source Data file. Scale bars: 5 µm. n.s. not significant. *p < 0.05. Two-sided Wilcoxon signed-rank test (E, F), two-sided Wilcoxon rank sum test (G).
Fig. 4
Fig. 4. Aβ-anticalin binds inactive Aβ monomers.
A Coomassie-stained SDS/PAGE depicting the size of Aβ-anticalin (21.3 kDa) and Aβ monomer (4.4 kDa). The experiment was repeated twice. B Size exclusion chromatography (SEC) of the Aβ-anticalin shows a peak at an elution volume of 12.48 ml, corresponding to an apparent molar weight of 22.7 kDa. C SEC of freshly prepared Aβ(1-40) monomers (calculated molar weight: 4430 Da) in combination with Aβ-anticalin demonstrate a shift of the peak from 12.48 to 12.07 ml, suggesting binding of the 4.4 kDa-peptide by the anticalin. D Representative Ca2+-traces recorded from six hippocampal CA1 neurons of a wild-type mouse under baseline conditions, during the application of Aβ monomers (10 µM, applied 5 min after preparation of the solution) and after a washout period of 5 min. E Summary data of the experiments in (D) from N = 6 mice. Each dot represents the mean number of Ca2+- transients per minute, for all observed neurons in one mouse under baseline conditions (BL), during the application of Aβ monomers (Aβ mon) and under washout conditions (WO). F Ca2+-transients from six representative CA1 pyramidal neurons in a bicuculline-treated hippocampal slice from a wild-type mouse under baseline conditions (left), during the application of Aβ(1-40) monomers (1 µM, applied 5 min after preparation of the aqueous solution) through a patch pipette (middle) and after washout for 5 min (right). G Number of Ca2+-transients during the application of 1 µM Aβ monomers (N = 6 slices), 100 µM Aβ monomers (N = 10) or ACSF as vehicle solution (N = 6), normalized to the respective mean baseline activity. n.s. not significant. Source data for Fig. 4G are provided as a Source Data file. Error bars depict SEM. Two-sided Wilcoxon signed-rank test (E) or Kruskal–Wallis test with Dunn-Sidac post-hoc comparison (G).
Fig. 5
Fig. 5. Prevention of the formation of toxic aggregates of the Aβ-anticalin.
A In vitro aggregation assay of synthetic Aβ(1-40) monomers. Average (n = 3 experiments) and SEM are shown. The values were normalized to the maximum fluorescence. B same as (A) for samples taken from the Aβ aggregation assay in the presence of the Aβ-anticalin (Aβ-AC). C Same as (B) after aggregation for 90 min and following the addition of the Aβ-anticalin D Scheme depicting the aggregation curve of Aβ(1-40) monomers in the ThT assay. f, fluorescence (E) Representative Ca2+-traces recorded from seven hippocampal CA1 neurons of a wild-type mouse during baseline, during the application of putative Aβ oligomers (10 µM monomer equivalent) and after washout. F Scheme depicting the ThT-aggregation assay in the presence of Aβ and the Aβ-anticalin (10 µM, respectively). G Same as (E) for the application of putative protein-bound Aβ monomers. H Scheme depicting the aggregation of Aβ monomers alone for 90 min and after the addition of Aβ-anticalin. I Same as (E) for the application of ‘aged’ Aβ (10 µM monomer equivalent), incubated with 10 µM Aβ-anticalin for a further 30 min. J Summary data of the experiments in (E) from N = 6 mice under baseline conditions (BL), during the application of ‘aged’ Aβ and after washout (WO). K same as (J) for the experiment in (G) and the application of Aβ/Aβ-anticalin. L Number of Ca2+-transients during the application of ‘aged’ Aβ (N = 6) or Aβ/Aβ-anticalin (N = 6), normalized to the respective mean baseline. M same as (J) for the experiment in (I) and the application of ‘aged’ Aβ, incubated with Aβ-anticalin. N Number of Ca2+-transients during the application of ‘aged’ Aβ (N = 6) or ‘aged’ Aβ, incubated with Aβ-anticalin (N = 6), normalized to the respective mean baseline activity. Data in 5C and 5J–N are presented as mean +/− SEM. Source data for Fig. 5L and N are provided as a Source Data file. Data in n.s. not significant, *p < 0.05, **p < 0.005, Two-sided Wilcoxon signed-rank test (J, K, M), Two-Wilcoxon rank sum test (C, L, N).
Fig. 6
Fig. 6. The Aβ-anticalin prevents Aβ-dependent synaptic dysfunctions.
A Top: representative two-photon image of the SF-iGluSnFRA184S-expressing CA1 region of a wild-type mouse. The locaton of the application (Appl) and the stimulation (Stim) pipette, as well as the region of interest (ROI) from which glutamate transients were recorded, are outlined in white. Bottom: post-hoc confocal image of the SF-iGluSnFr-expressing neurons in CA1 (green) and DAPI counterstaining (cyan). DG: dentate gyrus, CA: cornu ammonis. Scale bars: 100 µm. B Individual synaptically evoked glutamate transients (gray) and average (black) from one slice during baseline conditions (left), during the application of ‘aged’ Aβ (50 µM monomer equivalent, incubated for 20 min in ACSF; middle) and after washout (right). C Area under the curve (AUC) of the evoked glutamate transients during the application of ‘aged’ Aβ(1-40) (N = 10 slices) or ‘aged’ reverse Aβ(40-1) (N = 9), normalized to the respective AUC registered under baseline conditions. Data are presented as mean values +/- SEM. D Same as (C) for the application of Aβ + Aβ-anticalin (50 µM Aβ monomer equivalent, incubated in ACSF containing 50 µM of the Aβ-anticalin for 20 min). E Comparison of the amplitudes of glutamate transients before (left) and during (right) the application of 50 µM equivalent Aβ monomer, incubated for 20 min without (blue) or with (orange) Aβ-anticalin (mean +/- SEM). F Scheme depicting the mechanism of action of the Aβ-anticalin. Under disease conditions, nascent Aβ monomers rapidly aggregate into toxic dimers and oligomers, which cause neuronal hyperactivity (top). Scavenging these monomers by the Aβ-anticalin disrupts the formation of toxic dimers/oligomers, thus preventing neuronal hyperactivation (bottom). Source data for Fig. 6C are provided as a Source Data file. n.s. not significant, **p < 0.005, ***p < 0.001. Two-sided Wilcoxon rank sum test (C, E across groups); Wilcoxon signed-rank test (E, baseline vs. application).

Similar articles

Cited by

References

    1. Selkoe DJ, Hardy J. The amyloid hypothesis of Alzheimer’s disease at 25 years. EMBO Mol Med. 2016;8:595–608. doi: 10.15252/emmm.201606210. - DOI - PMC - PubMed
    1. Hong S, et al. Complement and microglia mediate early synapse loss in Alzheimer mouse models. Science. 2016;352:712–716. doi: 10.1126/science.aad8373. - DOI - PMC - PubMed
    1. Jin M, et al. Soluble amyloid beta-protein dimers isolated from Alzheimer cortex directly induce Tau hyperphosphorylation and neuritic degeneration. Proc Natl Acad Sci USA. 2011;108:5819–5824. doi: 10.1073/pnas.1017033108. - DOI - PMC - PubMed
    1. Kadowaki H, et al. Amyloid β induces neuronal cell death through ROS-mediated ASK1 activation. Cell Death Differ. 2004;12:19. doi: 10.1038/sj.cdd.4401528. - DOI - PubMed
    1. Panza F, Lozupone M, Logroscino G, Imbimbo BP. A critical appraisal of amyloid-beta-targeting therapies for Alzheimer disease. Nat Rev Neurol. 2019;15:73–88. doi: 10.1038/s41582-018-0116-6. - DOI - PubMed

MeSH terms