. 2024 Jul 10;7(1):840.
doi: 10.1038/s42003-024-06528-4.

Composite branched and linear F-actin maximize myosin-induced membrane shape changes in a biomimetic cell model

Affiliations

Composite branched and linear F-actin maximize myosin-induced membrane shape changes in a biomimetic cell model

Ryota Sakamoto et al. Commun Biol. .

Abstract

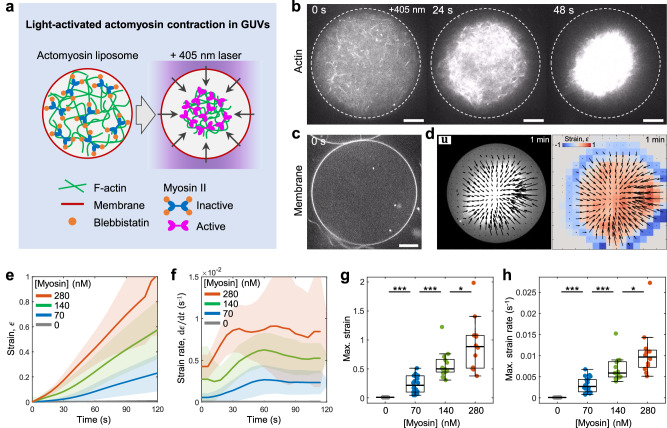
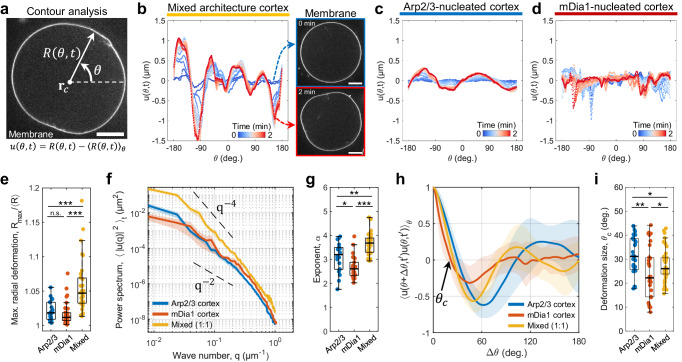
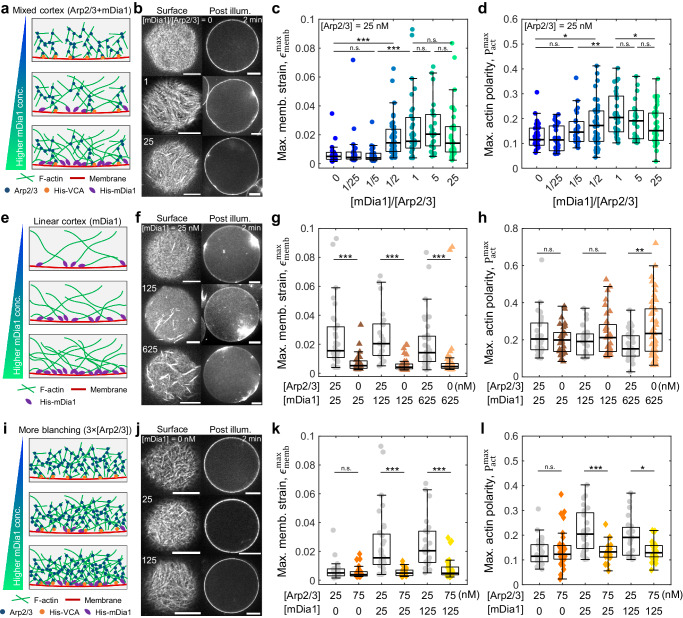
The architecture of the actin cortex determines the generation and transmission of stresses, during key events from cell division to migration. However, its impact on myosin-induced cell shape changes remains unclear. Here, we reconstitute a minimal model of the actomyosin cortex with branched or linear F-actin architecture within giant unilamellar vesicles (GUVs, liposomes). Upon light activation of myosin, neither the branched nor linear F-actin architecture alone induces significant liposome shape changes. The branched F-actin network forms an integrated, membrane-bound "no-slip boundary" -like cortex that attenuates actomyosin contractility. By contrast, the linear F-actin network forms an unintegrated "slip boundary" -like cortex, where actin asters form without inducing membrane deformations. Notably, liposomes undergo significant deformations at an optimized balance of branched and linear F-actin networks. Our findings highlight the pivotal roles of branched F-actin in force transmission and linear F-actin in force generation to yield membrane shape changes.


Conflict of interest statement

The authors declare no competing interests.

Figures

Fig. 1
Fig. 1. Light-activated contraction of the actomyosin networks within liposomes.
a Schematic of the light-activation of actomyosin contractility within a liposome encapsulating purified actin and myosin. b Timelapse images showing the mid-plane of the light-activated contracting actomyosin network within a liposome. The dashed line represents the position of the membrane. c The snapshot showing the fluorescently labeled lipid bilayer membrane in a mid-plane. d Actomyosin network contraction with 280 nM myosin. Black arrows are the total displacement, u, over 1 min, and vector magnitudes are normalized by its maximum. Colormap represents local strain fields. Mean compressive strain (e) and strain rate (f) over time (n = 12 liposomes and N = 2 independent experiments in 0 nM; n = 20 and N = 2 in 70 nM; n = 13 and N = 2 in 140 nM; n = 12 and N = 3 in 280 nM). Maximum strain (g) and maximum strain rate (h) extracted from (e) at 120 s and (f) (n = 12 liposomes and N = 2 independent experiments in 0 nM; n = 20 and N = 2 in 70 nM; n = 13 and N = 2 in 140 nM; n = 12 and N = 3 in 280 nM). Curves are mean ± SD. * and *** represent p < 0.05 and p < 0.001, respectively. Scale bars, 10 μm.
Fig. 2
Fig. 2. Assembly of distinct actin cortex architectures within liposomes.
a Schematic of the Arp2/3-nucleated branched F-actin cortex activated via His-VCA ([Arp2/3] = 25 nM). b A snapshot showing the surface of the Arp2/3 cortex liposome before 405 nm illumination. The nematic order parameter, S=cos2θ, is calculated from the director field (black dashes). c Snapshots showing the actin and membrane before and post 405 nm illumination. Membrane curvature is color-coded at 2 min. d Schematic of the mDia1-nucleated linear F-actin cortex ([mDia1] = 25 nM). e A snapshot showing the surface of the mDia1 cortex liposome and nematic order parameter. f Snapshots showing the actin and membrane before and post 405 nm illumination. Membrane curvature is color-coded at 2 min. g Schematic of the mixed F-actin architecture cortex at [mDia1]:[Arp2/3] = 1:1 ([mDia1] = 25 nM; [Arp2/3] = 25 nM). h A snapshot showing the surface of the mixed cortex liposome and nematic order parameter. i Snapshots showing the actin and membrane before and post 405 nm illumination. White arrows indicate local deformations. Membrane curvature is color-coded at 2 min. j Boxplot showing the mean order parameter (n = 8 liposomes and N = 5 independent experiments in Arp2/3; n = 9 and N = 3 in mDia1; n = 11 and N = 2 in Mixed). Membrane strain (k) and actin polarity (l) over time (n = 33 and N = 6 in Arp2/3; n = 24 and N = 5 in mDia1; n = 26 and N = 2 in Mixed). Maximum membrane strain (m) and maximum actin polarity (n) extracted from (k) and (l) (n = 33 and N = 6 in Arp2/3; n = 24 and N = 5 in mDia1; n = 26 and N = 2 in Mixed). Curves are mean ± SD. *, **, and *** represents p < 0.05, p < 0.01, and p < 0.001, respectively. n.s. not significant. Scale bars, 10 μm.
Fig. 3
Fig. 3. Contour shape analysis on deformed membranes.
a Snapshots showing the definition of radial membrane position R(θ, t) and deformation amplitude u(θ, t). b Time evolution of the deformation amplitude in mixed architecture cortex. Time is color-coded. The right snapshots show the mid-plane image of the membrane at 0 min and 2 min. c Time evolution of the deformation amplitude in Arp2/3-nucleated cortex. d Time evolution of the deformation amplitude in mDia1-nucleated cortex. e Boxplot showing maximum radial deformation (n = 24 liposomes and N = 2 independent experiments in Arp2/3; n = 31 and N = 2 in mDia1; n = 31 and N = 3 in Mixed). f Power spectrum of membrane deformation with different F-actin cortex architecture. The power spectrum is averaged over 20 frames for each liposome, which is averaged for all liposomes. Curves are mean ± SEM. Dotted lines are the eye guide for q−4 and q−2 (n = 14 and N = 2 in Arp2/3; n = 13 and N = 2 in mDia1; n = 15 and N = 2 in Mixed). g Boxplot showing scaling exponent α. Scaling exponent is extracted by fitting the power spectrum by a function qa for all q (n = 20 and N = 2 in Arp2/3; n = 26 and N = 2 in mDia1; n = 30 and N = 3 in Mixed). h Autocorrelation of the deformation amplitude. θc is the deformation size calculated at the smallest θ at which autocorrelation becomes 0. The autocorrelation at the time frame t' was shown at which θc takes the smallest value. Curves are mean ± SD (n = 14 and N = 2 in Arp2/3; n = 13 and N = 2 in mDia1; n = 15 and N = 2 in Mixed). i Boxplot showing the deformation size (n = 33 and N = 3 in Arp2/3; n = 32 and N = 3 in mDia1; n = 49 and N = 3 in Mixed). *, **, and *** represent p < 0.05, p < 0.01 and p < 0.001, respectively. n.s. not significant. Scale bars, 10 μm.
Fig. 4
Fig. 4. A fine-tuning of the mixed F-actin architecture facilitates membrane deformation.
a Schematic of the mixed F-actin cortex with increasing mDia1 concentration. b Snapshots of the surface of the liposome and the mid-plane of the actin cortex at post-illumination (after 2 min) for different mDia1 to Arp2/3 ratio. Boxplots showing maximum membrane strain (c) and maximum actin polarity (d) at varied mDia1 to Arp2/3 ratio (n = 33 liposomes and N = 2 independent experiments in [mDia1]/[Arp2/3] = 0; n = 28 and N = 2 in 1/25; n = 26 and N = 2 in 1/5; n = 41 and N = 2 in 1/2; n = 32 and N = 3 in 1; n = 23 and N = 2 in 5; n = 36 and N = 2 in 25). e Schematic of the mDia1-nucleated linear F-actin cortex with increasing mDia1 concentration. f Snapshots of the surface of the liposome and the mid-plane of the actin cortex at post-illumination (after 2 min) for different mDia1 concentrations. Maximum membrane strain (g) and maximum actin polarity (h) at varied mDia1 concentration (n = 31 and N = 2 in [mDia1] = 25 nM; n = 36 and N = 2 in 125 nM; n = 49 and N = 2 in 625 nM). i Schematic of the Arp2/3-nucleated branched F-actin cortex at three times higher Arp2/3 concentration than the control condition in (a) with increasing mDia1 concentration. j Snapshots of the surface of the liposome and the mid-plane of the actin cortex at post-illumination (after 2 min) for different mDia1 concentrations. Maximum membrane strain (k) and maximum actin polarity (l) at varied mDia1 concentration (n = 31 and N = 3 in [mDia1] = 0 nM; n = 22 and N = 2 in 25 nM; n = 29 and N = 3 in 125 nM). *, **, *** represent p < 0.05, p < 0.01, and p < 0.001, respectively. n.s. not significant. Scale bars, 10 μm.
Fig. 5
Fig. 5. F-actin architecture determines force generation, transmission, and membrane deformations.
a A phase diagram of the maximum membrane strain and the maximum actin polarity for different F-actin cortex architectures. The data points with error bars represent mean ± SD (In mixed, n = 33 liposomes and N = 2 independent experiments in [mDia1]/[Arp2/3] = 0; n = 28 and N = 2 in 1/25; n = 26 and N = 2 in 1/5; n = 41 and N = 2 in 1/2; n = 32 and N = 3 in 1; n = 23 and N = 2 in 5; n = 36 and N = 2 in 25. In mDia1 only, n = 31 and N = 2 in [mDia1]=25 nM; n = 36 and N = 2 in 125 nM; n = 49 and N = 2 in 625 nM. In 3 × [Arp2/3], n = 31 and N = 3 in [mDia1]=0 nM; n = 22 and N = 2 in 25 nM; n = 29 and N = 3 in 125 nM). b Schematic represents the F-actin architectural control of membrane deformations shown in (a). c Schematic summarizing the F-actin architectural control of force generation, transmission, and membrane deformations. The Arp2/3-nucleated cortex branches the F-actin network and forms membrane-to-cortex links, which provide a no-slip boundary-like condition. However, the contractility is attenuated within the highly branched actin gel. In contrast, the mDia1-nucleated cortex allows force generation within the network, while the unbranched nature of the network results in the slip boundary-like condition without membrane deformation. When both the Arp2/3-nucleated branch and mDia1-nucleated linear filaments coexist, contractility within the F-actin network is transmitted to the adjacent membrane, inducing a significant membrane deformation.

References

    1. Pollard TD. Actin and actin-binding proteins. Cold Spring Harb. Perspect. Biol. 2016;8:a018226. doi: 10.1101/cshperspect.a018226. - DOI - PMC - PubMed
    1. Salbreux G, Charras G, Paluch E. Actin cortex mechanics and cellular morphogenesis. Trends Cell Biol. 2012;22:536–545. doi: 10.1016/j.tcb.2012.07.001. - DOI - PubMed
    1. Murrell M, Oakes PW, Lenz M, Gardel ML. Forcing cells into shape: the mechanics of actomyosin contractility. Nat. Rev. Mol. Cell Biol. 2015;16:486–498. doi: 10.1038/nrm4012. - DOI - PMC - PubMed
    1. Green RA, Paluch E, Oegema K. Cytokinesis in animal cells. Annu. Rev. Cell Dev. Biol. 2012;28:29–58. doi: 10.1146/annurev-cellbio-101011-155718. - DOI - PubMed
    1. Charras GT, Coughlin M, Mitchison TJ, Mahadevan L. Life and times of a cellular bleb. Biophys. J. 2008;94:1836–1853. doi: 10.1529/biophysj.107.113605. - DOI - PMC - PubMed

Publication types

LinkOut - more resources