. 2024 Jul 11;15(1):5822.
doi: 10.1038/s41467-024-50158-7.

PARG is essential for Polθ-mediated DNA end-joining by removing repressive poly-ADP-ribose marks

Affiliations

PARG is essential for Polθ-mediated DNA end-joining by removing repressive poly-ADP-ribose marks

Umeshkumar Vekariya et al. Nat Commun. .

Abstract

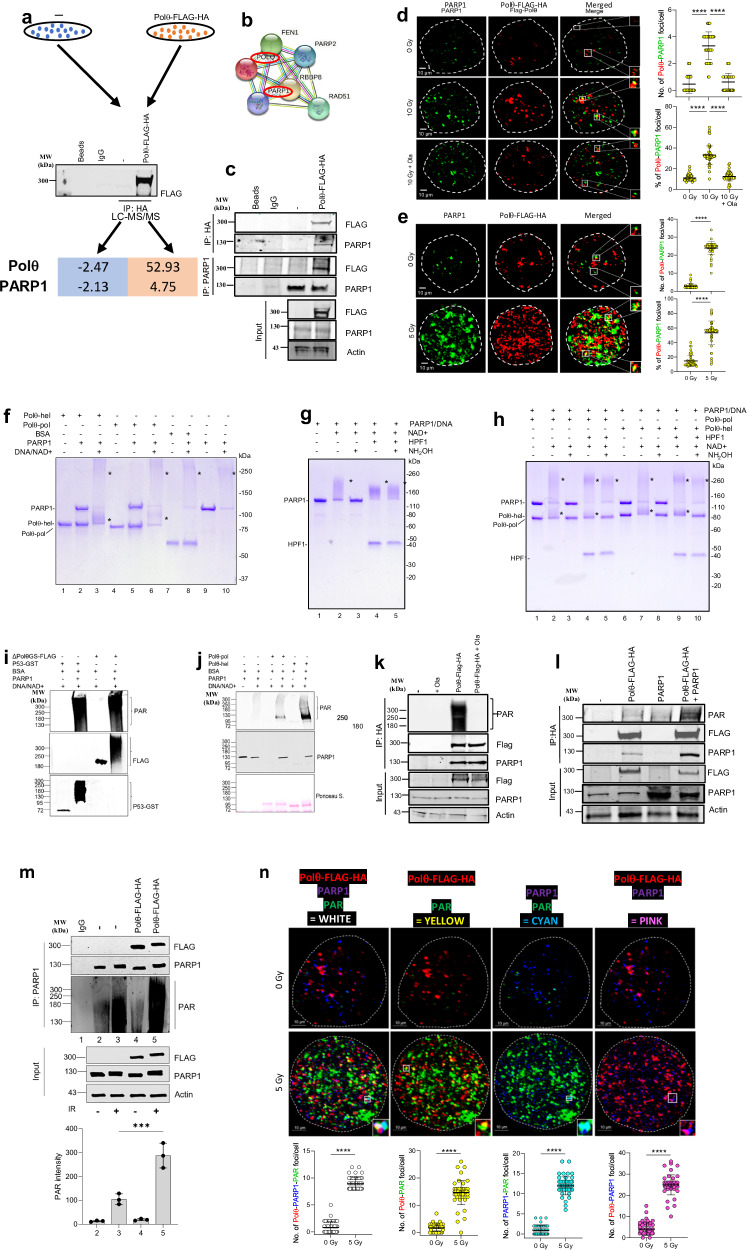
DNA polymerase theta (Polθ)-mediated end-joining (TMEJ) repairs DNA double-strand breaks and confers resistance to genotoxic agents. How Polθ is regulated at the molecular level to exert TMEJ remains poorly characterized. We find that Polθ interacts with and is PARylated by PARP1 in a HPF1-independent manner. PARP1 recruits Polθ to the vicinity of DNA damage via PARylation dependent liquid demixing, however, PARylated Polθ cannot perform TMEJ due to its inability to bind DNA. PARG-mediated de-PARylation of Polθ reactivates its DNA binding and end-joining activities. Consistent with this, PARG is essential for TMEJ and the temporal recruitment of PARG to DNA damage corresponds with TMEJ activation and dissipation of PARP1 and PAR. In conclusion, we show a two-step spatiotemporal mechanism of TMEJ regulation. First, PARP1 PARylates Polθ and facilitates its recruitment to DNA damage sites in an inactivated state. PARG subsequently activates TMEJ by removing repressive PAR marks on Polθ.


Conflict of interest statement

R.T.P. is a co-founder and chief scientific officer of Recombination Therapeutics, LLC. The remaining authors declare no competing interests.

Figures

Fig. 1
Fig. 1. PARP1 forms a complex with Polθ resulting in HPF1-independent Polq PARylation.
a Upper panel—293T cells expressing Polθ-FLAG-HA. Middle panel—Detection of Polθ-FLAG-HA in anti-HA Immunoprecipitates (IP) with anti-FLAG antibody. Lower panel—intensity fold change of PARP1 in anti-HA IP from 293T cells expressing Polθ-FLAG-HA assessed by LC-MS/MS analysis. b STING database prediction of PARP1 interactions. c Polθ –PARP1 interaction detected by anti-HA and anti-PARP1 IP probed with anti-FLAG (Polθ-FLAG-HA) and anti-PARP1. d, e Co-localization of Polθ-FLAG-HA and PARP1 in d 293T cells and e MDA-MB-436 cells overexpressing Polθ-FLAG-HA and exposed to irradiation and 1 µM olaparib using confocal microscopy. Dimentions:10 μm or 100 nm (magnified foci). Quantification of yellow foci in cells (n = 30) stems from three independent repeats: upper panels—mean number ± SD and lower panels -% of Polθ-FLAG-HA + PARP1 foci/cell. ****p < 0.0001 using one-way ANOVA (d) and two-tailed Student’s t test (e). f PARP1 PARylates Polθ-pol and Polθ-hel in vitro. SDS gel showing increase in the molecular weight (MW) of Polθ-pol and Polθ-hel in vitro by PARP1 PARylation. g PARP1 self-PARylation in vitro occurs in the presence of HPF1 predominantly on serine residues. SDS gel showing size increase of PARP1 due to self-PARylation. NH2OH treatment shows that serine residues of PARP1 are mainly self-PARylated in presence of HPF1. h HPF1 does not promote PARP1-NAD PARylation of Polθ-pol and Polθ-hel. SDS gel showing HPF1 promotes PARP1 self-PARylation on serine residues in the presence of NH2OH which prevents PARylation on glutamate and aspartate residues fh represent at least two experiments. * indicates shift in MW in fh. i, j PARP1-mediated PARylation of recombinant purified Polθ fragments: ΔPolθGS-FLAG (polymerase-helicase domain fusion) protein (i), and Polθ-pol and Polθ-hel (j). Purified p53-GST serves as control substrate. Western blot detected PARylation of Polθ and GST-p53 proteins. k, l Western blot detection of PARylated Polθ in anti-HA IP from (k) 10 Gy irradiated (IR) 293T (−) and Polθ-FLAG-HA transfected 293T cells treated or not with 1 µM olaparib (Ola), and (l) 293T cells (−) and these overexpressing PARP1 and/or Polθ-FLAG-HA. The panel represents three independent experiments. m Western blot detection of PARylated Polθ-FLAG-HA in anti-HA IPs from IR (+) or not (−) MDA-MB-436 cells and these expressing Polθ-FLAG-HA. Bottom panel: mean ± SD of the quantitation of PARylation from three independent biological replicates. ***p = 0.000185 using one-way ANOVA. n Co-localization of Polθ-FLAG-HA, PARP1, and/or PAR in MDA-MB-436 cells expressing Polθ-FLAG-HA and exposed to IR followed by 20 min incubation. Dashed line shows nuclear border. Scale bar: 10 μm or 100 nm (magnified foci). Co-localization experiments were repeated three times with n = 30 cells analyzed, and representative confocal microscopy images shown. Mean number ± SD of the indicated foci formation is shown below; ****p < 0.0001 using two-tailed Student’s t test. Source data are provided as a Source Data file.
Fig. 2
Fig. 2. PARylated Polθ is inhibited in DNA binding and TMEJ.
a EMSA showing that PARylated Polθ-hel is inhibited in ssDNA binding. Cy3-ssDNA probe and PARP1 activating substrate (PAS) are indicated. b Denaturing gel showing that the presence of PARP1 and NAD+ inhibit Polθ-hel ATPase activity (left).% inorganic phosphate (PI) formation indicated. pssDNA substrate indicated. Bar plot showing mean ± SD results from ATPase assay (right). ****p < 0.0001 and ***p < 0.001 using unpaired two-tailed t test, statistics from three biological replicates (1 vs 3 p = 0.001119, 2 vs 3 p = 0.000025, 3 vs 4 p = 0.000045). c EMSA showing that the presence of PARP1 and NAD+ inhibit PolθΔcen ssDNA binding. Cy3-ssDNA probe and PARP1 activating substrate (PAS) are indicated. d Schematic of in vitro TMEJ assay using pssDNA substrates containing 3′ terminal microhomology. e Denaturing gel showing XmaI cleavage of expected TMEJ product. Schematic of pssDNA substrate and TMEJ synapse with XmaI recognition site indicated in red (top). f Denaturing gel showing that the presence of PARP1 and NAD+ suppress Polθ-pol and PolθΔcen TMEJ activities. g Bar plots showing mean% TMEJ activity ± SD by Polθ-pol and PolθΔcen in the presence of the indicated factors. ****p < 0.0001 using unpaired two-tailed t-test, statistics from three biological replicates (1 vs 3 p = 0.00002, 2 vs 3 p = 0.00001, 3 vs 4 p = 0.000025, 5 vs 7 p = 0.000086, 6 vs 7 p = 0.000011, 7 vs 8 p = 0.000035). h Denaturing gel showing that the presence of PARP1 and NAD+ suppress FL-Polθ TMEJ activity. i Bar plots showing mean ± SD results from%TMEJ activity by FL-Polθ and in the presence of the indicated factors. ****p < 0.0001 using unpaired two-tailed t-test, statistics from three biological replicates (1 vs 3 p = 0.000048, 2 vs 3 p < 0.00001, 3 vs 4 p < 0.00001). j Denaturing gel showing that olaparib prevents suppression of Polθ-pol TMEJ in the presence of PARP1 and NAD+. Experiments a, c, e, j were repeated at least two times with similar results. Source data are provided as a Source Data file.
Fig. 3
Fig. 3. PARP1 and PARG are essential for TMEJ.
a Denaturing gel showing a time course of Polθ-pol TMEJ in the presence and absence of PARP1, NAD+, and PARG (left). Scatter plot showing a time course of Polθ-pol TMEJ in the presence and absence of PARP1, NAD+, and PARG (right); data represent mean ± SD results from three biological replicates. b Denaturing gels showing that PARG prevents inhibition of PolθΔcen and FL-Polθ TMEJ by PARP1 + NAD+. c Denaturing gel showing that PARG prevents inhibition of Polθ-pol TMEJ by PARP1 + NAD+. d Left: denaturing gel showing that the presence of HPF1 does not affect PARP1-NAD suppression or PARG rescue of Polθ-pol TMEJ activity in vitro. Right: Bar plot showing% MMEJ activity by Polθ-pol (pol) and in the presence of the indicated factors. Data represent mean ± SD from three biological replicates; ***p < 0.001, **p < 0.01, and *p < 0.05 using unpaired two-tailed t-test (2 vs 4 p = 0.0003, 4 vs 5 p = 0.0052, 4 vs 7 p = 0.402, 6 vs 7 p = 0.0017, 7 vs 8 p = 0.0159). Experiments 3b–c were repeated two or three times with similar results. e, f Western analysis of the expression of PARP1 and PARG (e) and TMEJ activity: mean ± SD ratio of GFP + /dsRED+ cells from three biological replicates (f) in U2OS-EJ2-GFP cells transduced with the indicated shRNAs; ***p < 0.001 (p value 1 vs 2 p = 0.0006, 1 vs 3 p = 0.0005) using one-way ANOVA. g, h Western analysis of PARylation (g) and TMEJ activity assay: mean ± SD ratio of GFP + /dsRED+ cells from three biological replicates (h) in U2OS-EJ2-GFP cells treated with the indicated inhibitors; ****p < 0.0001 using one-way ANOVA (p value 1 vs 2 p < 0.00001, 1 vs 3 p < 0.00001). i, j Western analysis of HPF1 and (i) and TMEJ activity: mean ± SD ratio of GFP + /dsRED+ cells from three biological replicates (j) in U2OS-EJ2-GFP cells transduced with the indicated siRNAs. k, l U2OS cells (C) and these expressing Polθ-FLAG-HA were analyzed 120 min post-10 Gy irradiation. Irradiated cells were treated with PARP1i or PARGi. k Left: Polθ-FLAG-HA and γH2AX foci formation and co-localization. Dimentions:10 μm or 100 nm (magnified foci). Right: mean ± SD of Polθ-FLAG-HA - γH2AX yellow foci co-localization in individual nuclei (n = 50) from two independent repeats. ****p < 0.0001 using one-way ANOVA. (p value 1 vs 2 p < 0.00001, 2 vs 3 p < 0.00001, 2 vs 4 p < 0.000032). l Left: western blot analysis of anti-γH2AX immunoprecipitates from chromatin extracts from three independent biological replicates. Right: mean ± SD of protein band intensity is shown. ****p < 0.0001, ***p < 0.001, and **p < 0.01 using one-way ANOVA. Source data are provided as a Source Data file.
Fig. 4
Fig. 4. Spatial and temporal interaction of Polθ, PARP1, and PARG after DNA damage.
U2OS cells were irradiated with 10 Gy at time 0 followed by incubation for 20, 60, and 120 min. a Left: panels show representative Polθ-FLAG-HA, PARP1, PARG, and PAR nuclei (n = 45) foci formation after irradiation from two independent biological replicates. Dimentions:10 μm or 100 nm (for magnified foci). Right - Dot-plots illustrating the mean arbitrary unit intensity ± SD of the indicated foci in individual nuclei; ****p < 0.0001 using one-way ANOVA. b Left: Polθ-FLAG-HA, PARP1, PARG and PAR foci formation and co-localization in U2OS cells after 10 Gy irradiation. Dimentions:10 μm or 100 nm (for magnified foci). Right: mean ± SD of Polθ-FLAG-HA—PARP1, Polθ-FLAG-HA–PARG, and Polθ-FLAG-HA—PAR yellow foci co-localization in individual nuclei (n = 50) from two independent biological replicates. ****p < 0.0001 using one-way ANOVA c Left: Western blot analysis of anti-HA immunoprecipitates obtained post-10 Gy irradiation from total cell extracts of U2OS-EJ2-GFP cells (−) and these expressing Polθ-FLAG-HA from three independent biological replicates. Right: mean ± SD of protein band intensity is shown; **p < 0.01 and ***p < 0.001 using one-way ANOVA. Source data are provided as a Source Data file.
Fig. 5
Fig. 5. Spatial and temporal recruitment of Polθ, PARP1, and PARG to DNA damage sites.
a Western blot validates HPF1 knockout in U2OS HPF1 KO cells. b Left: western blot analysis of anti-HA and anti- γH2AX immunoprecipitates obtained post-10 Gy irradiation from chromatin extracts of U2OS WT (−) and HPF1KO cells (−) and these expressing Polθ-FLAG-HA. Right: mean ± SD of protein bands intensity quantification from three independent biological replicates is shown; *p < 0.05, **p < 0.01, ***p < 0.001, and ****p < 0.0001 using one-way ANOVA. c Left: western blot analysis of anti-γH2AX immunoprecipitates obtained post-10 Gy irradiation from chromatin extracts of U2OS WT cells (−) and these expressing Polθ-FLAG-HA. Right: mean ± SD of protein bands intensity quantification from three independent biological replicates is shown; *p < 0.05, **p < 0.01, and ***p < 0.001 using one-way ANOVA. d Left: Post-10 Gy irradiation co-localization of γH2AX with Polθ-FLAG-HA in U2OS WT and HPF1KO cells expressing Polθ-FLAG-HA. Dimentions:10 μm or 100 nm (for magnified foci). Right: quantification of mean number ± SD of γH2AX-Flag - Polθ yellow foci formation (n = 50 cells) from two independent biological replicates is shown; ****p < 0.0001 using one-way ANOVA. e Left: Post-10 Gy irradiation co-localization of γH2AX with PARP1 and PARG in U2OS cells expressing Polθ-FLAG-HA. Dimentions:10 μm or 100 nm (for magnified foci). Right: Quantification of mean number ± SD of γH2AX–PARP1 and γH2AX–PARG yellow foci formation (n = 50) from two independent biological replicates is shown; ****p < 0.0001 using one-way ANOVA. Source data are provided as a Source Data file.
Fig. 6
Fig. 6. PARP1 and PARG regulate biomolecular condensates containing Polθ and DNA.
ac Confocal images showing that PARP1 + NAD+ promote biomolecular condensates containing Cy3-DNA and Red-Polθ-pol. Confocal microscopy images are shown of Red-Polθ-pol and Cy3-DNA under the indicated conditions following Cy3 and Cy5 fluorescence as indicated. 10 μm bars are indicated. d, e Plots showing circularity (d) and size (e) of particles formed under the indicated conditions. Red circles represent particles with circularity scores >0.9 (d). f Confocal images showing that Red-Polθ-pol colocalizes with Cy3-DNA in droplets formed by PARP1 + NAD+. Confocal microscopy images are shown of Red-Polθ-pol and Cy3-DNA under the indicated conditions following Cy3 and Cy5 fluorescence as indicated. 10 μm bars are indicated. g Quantitation of the number of co-localization events between Red-Polθ-pol and Cy3-DNA under the indicated conditions. Co-localization events from 4 separate confocal microscopy images are quantitated. h Model of Polθ TMEJ regulation by PARP1 and PARG. Experiments in 6ac, f were performed at least twice. Source data are provided as a Source Data file.
Fig. 7
Fig. 7. Temporal TMEJ activity in irradiated cells.
a Schematic outline of TMEJ in vitro assay. Insert: Polθ inhibitor ART558 abrogated TMEJ activity (cells were treated with 12.5 μM ART558 for 16 h before IR and during incubation procedure) in duplicates from three independent biological replicates. ****p < 0.0001 using one-way ANOVA (p value 1 vs 2 p < 0.00001, 2 vs 3 p < 0.00001). b Mean number ± SD of XL-10 Gold colonies obtained from the in vitro TMEJ assay using nuclear lysates from U2OS cells obtained at 0, 20, 60 and 120 min. after 10 Gy irradiation (IR) or without IR from two independent experiments; ***p < 0.001 and ****p < 0.0001 using one-way ANOVA (p value 1 vs 6 p = 0.00012, 1 vs 7 p < 0.00001). c Representative images of XL-10 Gold colonies harboring the repaired pBABE-hygro-MMEJ plasmid. Source data are provided as a Source Data file.

References

    1. Black SJ, et al. Molecular basis of microhomology-mediated end-joining by purified full-length Polθ. Nat. Commun. 2019;10:4423. doi: 10.1038/s41467-019-12272-9. - DOI - PMC - PubMed
    1. Mateos-Gomez PA, et al. Mammalian polymerase theta promotes alternative NHEJ and suppresses recombination. Nature. 2015;518:254–257. doi: 10.1038/nature14157. - DOI - PMC - PubMed
    1. Yousefzadeh MJ, et al. Mechanism of suppression of chromosomal instability by DNA polymerase POLQ. PLoS Genet. 2014;10:e1004654. doi: 10.1371/journal.pgen.1004654. - DOI - PMC - PubMed
    1. Belan O, et al. POLQ seals post-replicative ssDNA gaps to maintain genome stability in BRCA-deficient cancer cells. Mol. Cell. 2022;82:4664–80.e9. doi: 10.1016/j.molcel.2022.11.008. - DOI - PubMed
    1. Yoon JH, et al. Error-prone replication through UV lesions by DNA polymerase θ protects against skin cancers. Cell. 2019;176:1295–309.e15. doi: 10.1016/j.cell.2019.01.023. - DOI - PMC - PubMed

MeSH terms

LinkOut - more resources