. 2024 Jul 10;15(1):5791.
doi: 10.1038/s41467-024-50054-0.

Bioengineered niches that recreate physiological extracellular matrix organisation to support long-term haematopoietic stem cells

Affiliations

Bioengineered niches that recreate physiological extracellular matrix organisation to support long-term haematopoietic stem cells

Hannah Donnelly et al. Nat Commun. .

Abstract

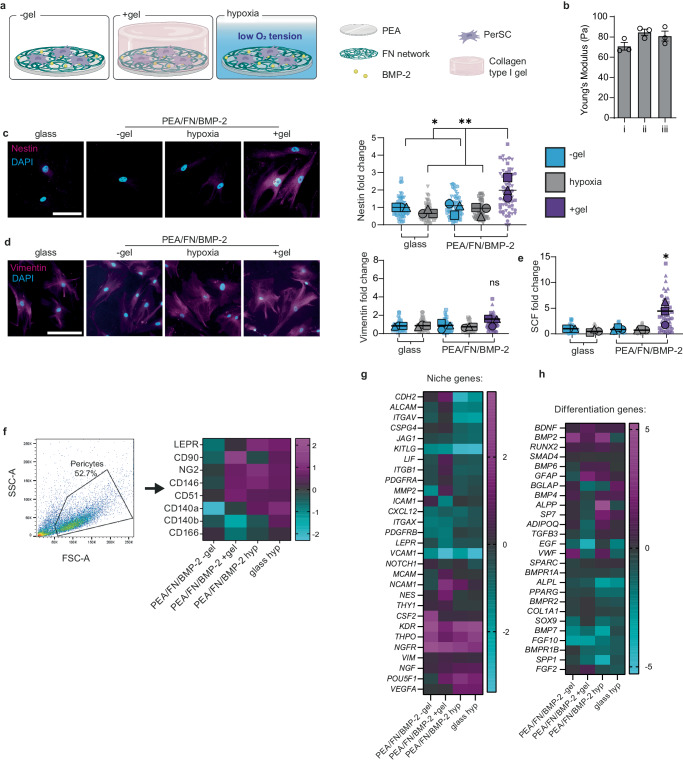
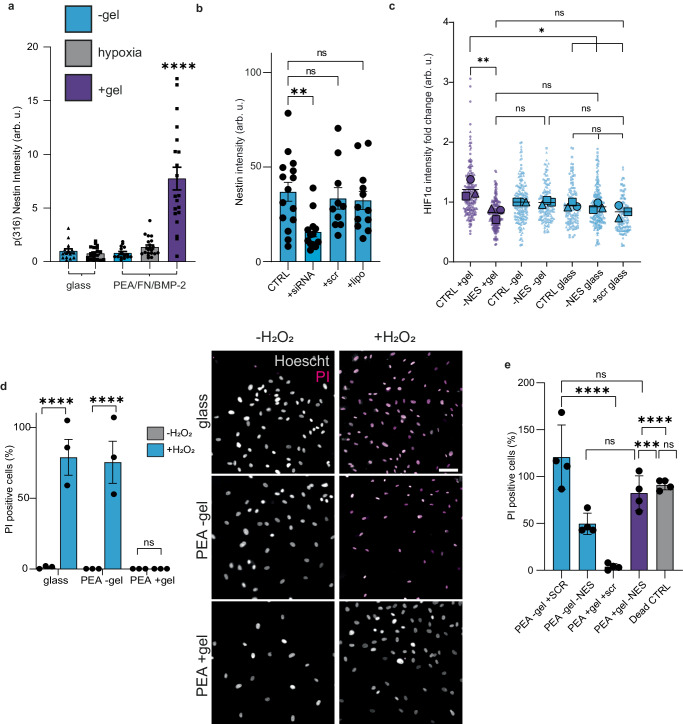
Long-term reconstituting haematopoietic stem cells (LT-HSCs) are used to treat blood disorders via stem cell transplantation. The very low abundance of LT-HSCs and their rapid differentiation during in vitro culture hinders their clinical utility. Previous developments using stromal feeder layers, defined media cocktails, and bioengineering have enabled HSC expansion in culture, but of mostly short-term HSCs and progenitor populations at the expense of naive LT-HSCs. Here, we report the creation of a bioengineered LT-HSC maintenance niche that recreates physiological extracellular matrix organisation, using soft collagen type-I hydrogels to drive nestin expression in perivascular stromal cells (PerSCs). We demonstrate that nestin, which is expressed by HSC-supportive bone marrow stromal cells, is cytoprotective and, via regulation of metabolism, is important for HIF-1α expression in PerSCs. When CD34+ve HSCs were added to the bioengineered niches comprising nestin/HIF-1α expressing PerSCs, LT-HSC numbers were maintained with normal clonal and in vivo reconstitution potential, without media supplementation. We provide proof-of-concept that our bioengineered niches can support the survival of CRISPR edited HSCs. Successful editing of LT-HSCs ex vivo can have potential impact on the treatment of blood disorders.


Conflict of interest statement

The authors declare no competing interests.

Figures

Fig. 1
Fig. 1. Schematic of the bone marrow (BM) niche microenvironment.
Long-term HSCs (LT-HSC) and Nestinhigh/LEPR−ve Perivascular stem cells (PerSCs) reside close to the endosteum and the oxygenated arterioles that perfuse the endosteal niche, whereas short-term HSCs (ST-HSCs) and LEPR+ve/NestinlowPerSCs are in close proximity to the sinusoidal vessels that carry deoxygenated blood away from the BM. The BM extracellular matrix (ECM) is a low-stiffness network comprised primarily of collagen and fibronectin (FN). Modified with permissions from ref. .
Fig. 2
Fig. 2. Control of the protein interface using acrylate polymers.
a Schematic of the PEA system. b AFM height images showing fibronectin (FN) spontaneously forms networks on PEA surfaces but not on PMA. c Surface density of FN on PEA and PMA surfaces coated with 20 μg/mL FN solution, showing that more FN adsorbs to PMA (n = 7 material replicates, p = 0.0006). The availability of d total FN (p = 0.05); e FN HFN7.1 domain (RGD-binding) (p = 0.05); and f P5F3 domain (growth factor (GF)-binding) (p = 0.05), was assessed using in-cell western analysis using antibodies against each domain. Data shows the increased availability of RGD- and GF-binding FN domains on PEA; MFI mean fluorescent intensity. g Surface density of BMP-2 on PEA-FN and PMA-FN, as assessed by ELISA. 50 ng/mL of BMP-2 was loaded onto the surface, leading to ~8 ng/cm2 of BMP-2 sequestered on both PEA and PMA (dg n = 3). cg Graphs show mean ± SEM, *p < 0.05, ***p < 0.001 determined by one-tailed student t test (Mann–Whitney), n = 3 material replicates. Source data are provided as a Source Data file. a created with BioRender.com released under a Creative Commons Attribution-NonCommercial-NoDerivs 4.0 International license (https://creativecommons.org/licenses/by-nc-nd/4.0/deed.en).
Fig. 3
Fig. 3. Investigating bioengineered niches that support BM stromal phenotypes.
a Schematic of niche model set-up. b Young’s modulus of collagen type I gels used in +gel niches. i–iii represent 3 independent batches of gels formulated. The average Young’s modulus was 78.8 Pa; no statistical significance was observed, as determined by one-way ANOVA followed by Bonferroni multiple comparison. Graph shows mean + SEM for 3 measurements per batch. c Representative images of changes in nestin expression evaluated by immunofluorescence at day 7 show increased expression in PEA/FN/BMP-2 +gel. Scale bar is 100 μm, magenta = nestin, cyan = DAPI. d Representative images of vimentin expression, as evaluated by immunofluorescence microscopy on day 7, shows no significant difference between models, scale bar is 100 μm, magenta = vimentin, cyan = DAPI. e SCF production in bioengineered models, in which PerSCs were cultured for 14 days, with brefeldin A added for the final 24 h to inhibit intracellular protein transport. Representative images in Supplementary Fig. 5c. Graphs in ce show mean integrated intensity of marker as fold change to glass control; −gel = blue, +gel = purple, hypoxia = grey. Each point represents an individual field normalised to cell number. N = 3 material replicates, for 3 independent experiments with different donor cells (each donor represented by a different shape), *p < 0.05, **p < 0.001, ns non-significant, determined by one-way ANOVA followed by Bonferroni’s multiple comparison test. f Assessment of PerSC phenotype after 14 days culture in niche models. Heatmap shows fold change over control (glass) of median fluorescent values obtained by flow cytometry from 6 pooled material replicates from n = 3 independent experiments with different donor cells. At least 5000 cells were collected per sample. g, h RNA-seq was performed on PerSCs from niche models after 7 days, and fold changes in gene expression relative to glass control are shown as a heatmap. N = 6 pooled material replicates from 1 donor. Source data are provided as a Source Data file. a created with BioRender.com released under a Creative Commons Attribution-NonCommercial-NoDerivs 4.0 International license (https://creativecommons.org/licenses/by-nc-nd/4.0/deed.en).
Fig. 4
Fig. 4. Investigating bioengineered niches that support PerSC phenotype.
RNA-seq was performed on PerSCs isolated from the bioengineered models at day 7. a Venn plot shows differentially expressed genes (based on passing a threshold of Wald test adjusted p value < 0.05 and log2 fold change > 1). b GO (gene ontology) enrichment analysis for differentially expressed transcripts based on false discovery rate (FDR) ≤ 0.05 linked to pathways involved in ECM, cell adhesion and cytoskeleton. Results indicate that the cells differentially re-organise ECM-relevant gene expression in response to the +gel niche or hypoxic environments. Differentially expressed genes in each of these pathways were extracted, and z scored changes are shown in the heatmaps. c Expression profiles of genes involved in ECM, cell adhesion, and cytoskeleton. In the hypoxic model, ECM-related transcripts are increased while adhesion- and cytoskeleton-related transcripts are decreased. In the +gel niche, ECM and adhesion-related transcripts are more subtly increased while cytoskeleton transcripts are decreased. d Immunomodulatory transcript expression, showing similar expression profiles in the hypoxic and −gel models, and up-regulated transcripts in the +gel niches. For RNA-seq, n = 3 6 pooled material replicates from 1 donor.
Fig. 5
Fig. 5. Bioengineered niches promote a hypoxic-like metabolic phenotype.
a Nuclear HIF1α levels significantly increased in +gel niches at day 3. Representative images shown, magenta = HIF1α, white = nuclei outline (DAPI), scale bar = 20 µm. n = 3; graph shows means from 3 material replicates for 3 independent experiments with different donor cells. Each individual point represents 1 nuclei measurement with shape corresponding to mean; −gel = blue, +gel = purple, hypoxia = grey. b HIF1α downstream analysis; VEGF measured from cell supernatant by ELISA on day 7 (blue) and 14 (purple), graph shows mean ± SEM for n = 3 material replicates. c Hypoxia was indicated when PerSCs were cultured in hypoxic but not in the +gel niches. Integrated intensity of hypoxyprobe immunofluorescence shown on graph, bar is mean ± SEM, n = 4 material replicates, where each point represents 1× image field normalised to cell number. d LC-MS metabolome analysis. Principal component analysis (PCA) of all detectable metabolites in PerSCs in PEA/FN/BMP-2 models at 7 and 14 days. Each point represents 1 replicate. Hypoxic and +gel niches showed similar clustering in PC2. e Glycolytic and TCA cycle metabolite profile. Heatmap shows group averages of log10 transformed peak intensities Ward clustered. Glycolysis related metabolites show increased abundance in PEA/FN/BMP-2 hypoxic conditions, whereas TCA cycle metabolites are increased in −gel conditions at both timepoints. The +gel niches show a similar down regulation of TCA cycle-associated metabolites as for hypoxic samples, but glycolysis associated metabolites are also downregulated. N = 3 for +gel 7 d, n = 4 for all other samples (d, e). f PerSCs were seeded for 7 days in the bioengineered models in the presence of 13C6-glucose for 72 h, LC-MS was used to measure the conversion and abundance of 13C6-labelled metabolites in the glycolysis pathway. Graphs show a fold change relative to 13C6-labelled metabolites in PerSCs cultured in the −gel model, ±SEM, n = 4 material replicates. All statistics by one-way ANOVA with Bonferroni’s multiple comparisons test, a comparisons to glass control, *p < 0.05, **p < 0.001, ****p < 0.0001. Arb. u. arbitrary units. Source data are provided as a Source Data file.
Fig. 6
Fig. 6. Nestin is cytoprotective.
a Immunofluorescent detection of nestin phosphorylation at Th(316) indicates it is not incorporated into intermediate filament networks, but is instead soluble. Graph is mean ± SEM, n = 4 material replicates, where each point represents 1× image field normalised to cell number; −gel = blue, +gel = purple, hypoxia = grey. b siRNA knock-down of nestin in PerSCs was confirmed using immunofluorescence, graph shows mean ± SEM, n = 3 material replicates, where each point represents 1× image field normalised to cell number. c siRNA knock-down of nestin leads to the loss of activated HIF1α co-localisation to PerSC nuclei in +gel niches; no effect on HIF1α localisation was observed in hypoxia or −gel models (where PerSCs were nestinlow/negative). N = 3, from 4 material replicates from 3 independent experiments with different donor cells. Scr = scrambled siRNA (control), lipo = lipofectamine only (control). d Nestin protects from oxidative stress. PerSCs in the bioengineered models were treated with 1 mM H2O2 to mimic oxidative stress. N = 3 material replicates, graph shows mean ± SEM, grey = −H2O2, blue = +H2O2; representative images shown, scale bar is 100 µm, grey = Hoescht stained cells (live & dead); magenta = PI stained cells (dead). e siRNA knock-down of nestin in PerSCs and susceptibility to oxidative stress was assessed. In the +gel niches, nestin knockdown led to similar levels of cell death as in the −gel niches (nestinlow/negative systems). All conditions were +H2O2, dead CTRL + 10 mM H2O2. N = 4 material replicates, graph shows mean ± SEM. d, e measured by the % of propidium iodide (PI) positive cells vs total Hoechst stained nuclei. Statistics by one-way ANOVA with Bonferroni’s multiple comparisons test, b comparisons to untreated CTRL, *p < 0.05, **p < 0.005, ***p < 0.0005, ****p < 0.0001, ns non-significant. Arb. u. arbitrary units. Representative images corresponding to ac, e in Supplementary Figs. 9, 10. Source data are provided as a Source Data file.
Fig. 7
Fig. 7. Engineered niches support LT-HSC maintenance, in vivo reconstitution and CRISPR editing.
a Experimental set up schematic. b Representative gating strategy for HSC identification. Forward (FSC-A) versus side scatter area (SSC-A) plots identify viable cells; FSC-A versus FSC width (FSC-W) plots identify single cells. Gated on CD45+ve cells to exclude PerSCs, 3 gates used to identify CD34+ve/CD38−ve (LT- and ST-HSCs), CD34+ve/CD38+ve (stem and progenitor) and CD34−ve/CD38+ve (committed progenitors) populations. c Fold change in CD34+ve/CD38−ve cell number after 5 days co-culture in 100% (grey) or 0% (blue) HSC media relative to the number at day 0. N = 3, where each data point = 1 donor cell line from 3 independent experiments. Graph shows mean ± SEM. d Total number of colonies maintained in niche models. After 5 days co-culture, sorted CD34+ve cells were added to LTC-IC assays (6 weeks), resulting cells assessed using CFU differential assay. Total colony numbers were counted and represented as CFUs per 1 × 104 CD34+ve cells. n = 2 biological donors with 4 technical replicates per donor (donor 1 = circles, donor 2 = squares). e Lineage specification state of CFUs were identified; for colony definitions see Supplementary Fig. 11. f HSCs were cultured for 5 days in gold standard or PEA +gel niches, or freshly thawed (fresh) immediately prior to sorting of CD45+ve/Lin−ve/CD34+ve cells and injected in irradiated mice. Blood of recipient mice was analysed at 6, 8, 10, 12 and 14 weeks (terminal bleed). Graph shows percentage of human donor-derived CD45+ve cells. Number of recipient mice; fresh (positive control) = 2, grey; PEA +gel = 3, purple; gold standard = 5, blue. See also Supplementary Fig. 13. g AAVS1_A1 CRISPR target site at PPP1R12C gene locus. h Increased retention of AAVS1 CRISPR edited HSCs in +gel niches with 100% or 0% media, relative to gold standard or −gel conditions. Heatmap shows % AAVS1 mutagenesis, n = 2 biological donors, from 3 pooled material replicates. Statistics by one-way ANOVA with Bonferroni’s multiple comparisons (d), or to Gold Standard condition (c), *p < 0.05, **p < 0.005, ***p < 0.0005, ****p < 0.0001. Source data are provided as a Source Data file. a, created with BioRender.com released under a Creative Commons Attribution-NonCommercial-NoDerivs 4.0 International license (https://creativecommons.org/licenses/by-nc-nd/4.0/deed.en).

References

    1. Burns R, Leal J, Sullivan R, Luengo-Fernandez R. Economic burden of malignant blood disorders across Europe: a population-based cost analysis. Lancet Haematol. 2016;3:e362–e370. doi: 10.1016/S2352-3026(16)30062-X. - DOI - PubMed
    1. Granot N, Storb R. History of hematopoietic cell transplantation: challenges and progress. Haematologica. 2020;105:2716–2729. doi: 10.3324/haematol.2019.245688. - DOI - PMC - PubMed
    1. State of the Registry 2020–2021. In: Anthony Nolan NHS Stem Cell Registry Annual Review 1–10 https://www.anthonynolan.org/sites/default/files/2022-06/State%20of%20Th... (2022).
    1. Zon LI. Intrinsic and extrinsic control of haematopoietic stem-cell self-renewal. Nature. 2008;453:306–313. doi: 10.1038/nature07038. - DOI - PubMed
    1. Yang L, et al. Identification of Lin-Sca1+kit+CD34 +Flt3- short-term hematopoietic stem cells capable of rapidly reconstituting and rescuing myeloablated transplant recipients. Blood. 2005;105:2717–2723. doi: 10.1182/blood-2004-06-2159. - DOI - PubMed

MeSH terms