. 2024 Nov;31(11):1452-1466.
doi: 10.1038/s41418-024-01341-2. Epub 2024 Jul 10.

Dysregulated Wnt/β-catenin signaling confers resistance to cuproptosis in cancer cells

Affiliations

Dysregulated Wnt/β-catenin signaling confers resistance to cuproptosis in cancer cells

Yuan-Tong Liu et al. Cell Death Differ. 2024 Nov.

Abstract

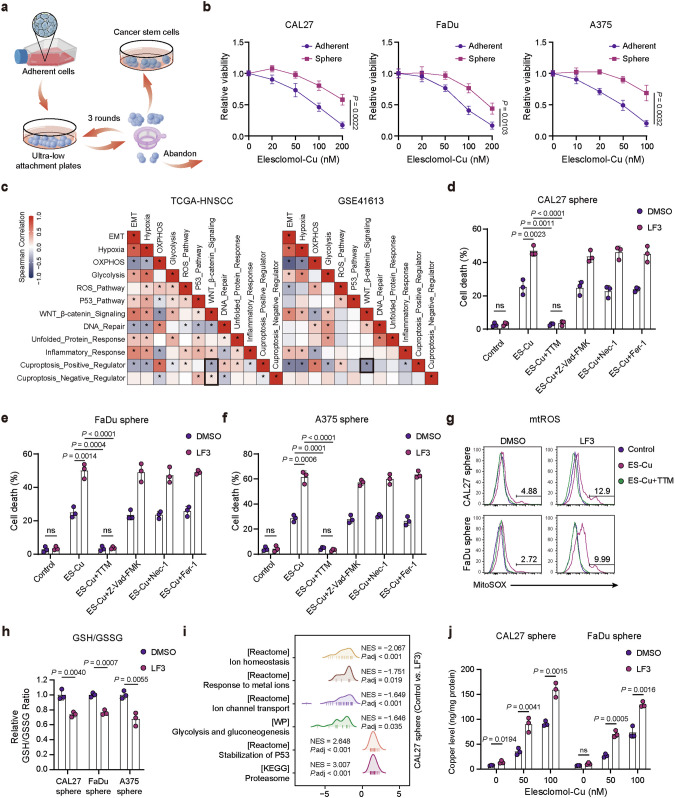
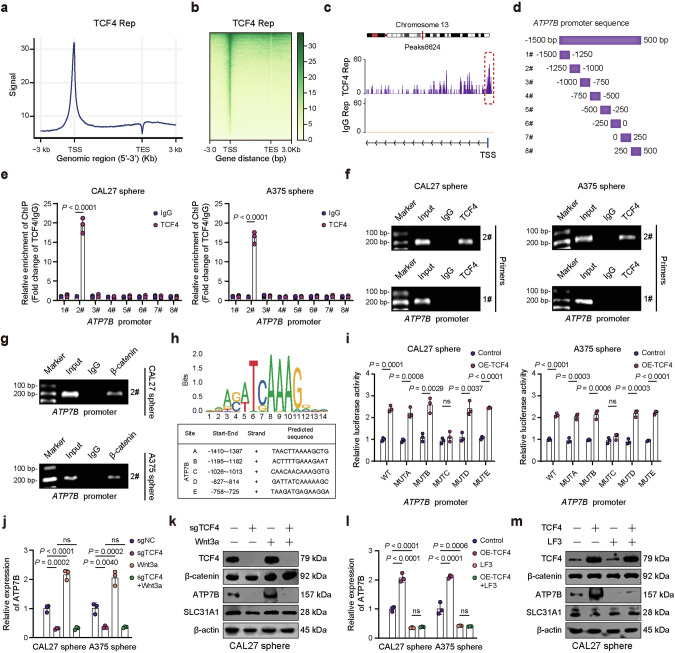
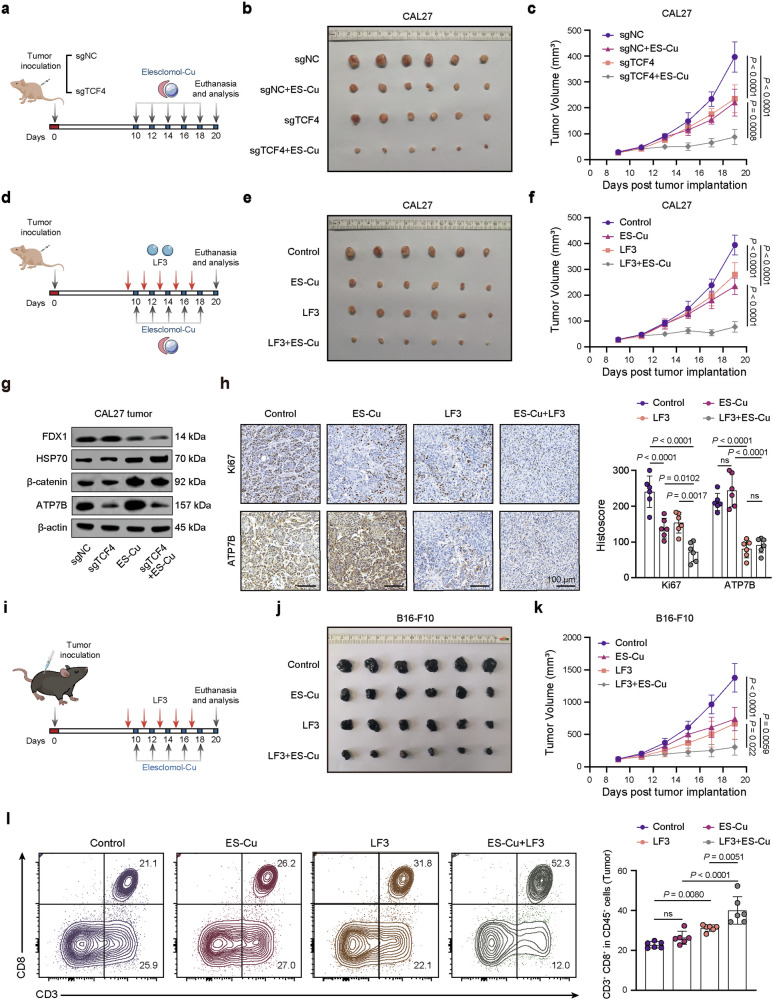
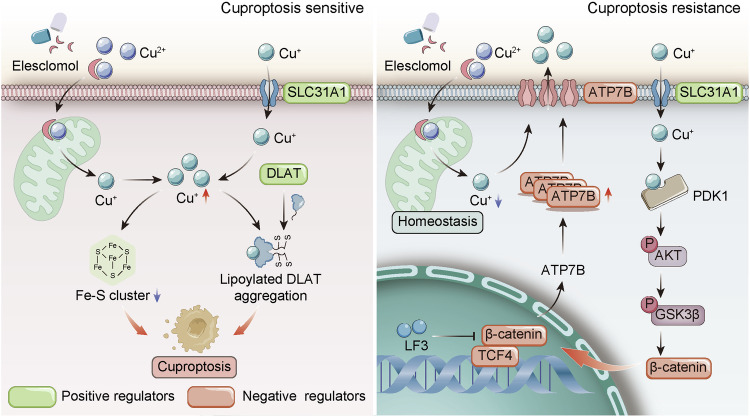
Cuproptosis is characterized by the aggregation of lipoylated enzymes of the tricarboxylic acid cycle and subsequent loss of iron-sulfur cluster proteins as a unique copper-dependent form of regulated cell death. As dysregulation of copper homeostasis can induce cuproptosis, there is emerging interest in exploiting cuproptosis for cancer therapy. However, the molecular drivers of cancer cell evasion of cuproptosis were previously undefined. Here, we found that cuproptosis activates the Wnt/β-catenin pathway. Mechanistically, copper binds PDK1 and promotes its interaction with AKT, resulting in activation of the Wnt/β-catenin pathway and cancer stem cell (CSC) properties. Notably, aberrant activation of Wnt/β-catenin signaling conferred resistance of CSCs to cuproptosis. Further studies showed the β-catenin/TCF4 transcriptional complex directly binds the ATP7B promoter, inducing its expression. ATP7B effluxes copper ions, reducing intracellular copper and inhibiting cuproptosis. Knockdown of TCF4 or pharmacological Wnt/β-catenin blockade increased the sensitivity of CSCs to elesclomol-Cu-induced cuproptosis. These findings reveal a link between copper homeostasis regulated by the Wnt/β-catenin pathway and cuproptosis sensitivity, and suggest a precision medicine strategy for cancer treatment through selective cuproptosis induction.


Conflict of interest statement

The authors declare no competing interests.

Figures

Fig. 1
Fig. 1. Cuproptosis activates Wnt/β-catenin signaling.
a Schematic diagram illustrating the mechanism of cuproptosis. b Gene ontology (GO) and Kyoto Encyclopedia of Genes and Genomes (KEGG) enrichment analysis conducted on CAL27 cells treated with 100 nM elesclomol-Cu (ES-Cu) for 24 h compared to control cells treated with DMSO. c A hierarchical clustering analysis comparing the expression of downregulated genes in control and ES-Cu treated CAL27 cells. d WB analysis of indicated proteins of CAL27 cells after 24 h of ES-Cu treatment. e DLAT oligomerization was analyzed in CAL27 and FaDu cells (ES-Cu, 50 nM, 24 h). Gene set enrichment analysis (GSEA) highlight enrichment of “TCF-dependent pathway in response to Wnt” pathways in ES-Cu treated CAL27 cells (f) and liver tissues of Atp7b-/- mice (g), respectively. h The heatmap depicts changes in expression of Wnt pathway genes in ES-Cu treated CAL27 cells (24 h). i WB analysis of Wnt pathway proteins in CAL27 cells following treatment with TTM (40 μM) and specified concentrations of ES-Cu for 24 h. Histone H3 was loaded as a nuclear marker. j Immunofluorescence staining shows increased β-catenin translocation in CAL27 cells after 24 h of 10 nM ES-Cu treatment. White arrowheads indicate β-catenin translocation into the nucleus. k Representative tumor images and growth curves demonstrate reduced tumor volumes in ES-Cu (0, 5, 10 mg/kg) treated CAL27 tumors. l Representative IHC staining and quantitative analysis of Ki67, β-catenin, and p-GSK3β in ES-Cu treated tumors. Data were expressed as mean ± SD of ≥ 3 independent experiments. The p-values in k, l were calculated by Student’s t test.
Fig. 2
Fig. 2. The SLC31A1-copper axis regulates PDK1/AKT/GSK3β/β-catenin signaling and stemness.
a WB results show time-dependent copper (CuCl2, 100 μM) induction of Wnt pathway protein expression in CAL27 cells with SLC31A1 knockdown (sgSLC31A1) versus control cells (sgNC). Immunofluorescence images reveal increased nuclear β-catenin localization in CAL27 (b) and A375 (c) cells after 10 μM copper treatment for 24 h. White arrowheads indicate β-catenin translocation into the nucleus. d WB analysis of the indicated proteins in sgNC and sgSLC31A1 CAL27 cells. e Stemness of copper-treated CAL27 and FaDu cells was examined by tumor sphere assay. f Flow cytometry analysis show different ALDH activity in copper-treated CAL27 and FaDu cells (100 μM, 12 h). g Limiting dilution assays demonstrate decreased tumor initiation frequency of sgSLC31A1 sphere cells in nude mice. h Stemness of CAL27 and FaDu cells with SLC31A1 knockdown following low-dose ES-Cu treatment (10 nM) was examined by tumor sphere assay. i WB analysis of Wnt pathway proteins in CAL27 cells with the treatment of ES-Cu (10 nM, 24 h). j Representative IHC images show increased SLC31A1 expression in primary (n = 210) and recurrent (n = 25) HNSCC versus normal mucosa (n = 42). k Proportional differences in clinicopathological factors in the SLC31A1high and SLC31A1low expression groups from our patient cohort. The χ2 test was used to evaluate the correlation between SLC31A1 and clinical characteristics. l Kaplan–Meier curve of SLC31A1 expression in HNSCC patients (using median cutoff). m Representative IHC images of SLC31A1 and β-catenin in our tissue microarrays. n Statistical analyses indicate positive correlations between SLC31A1 and β-catenin, p-AKT, PD-L1, CD44, and CD133 in HNSCC. o GSEA plot highlights correlation between SLC31A1 expression and Wnt/β-catenin signaling in HNSCC patients from TCGA. p Copper content in recombinant PDK1 proteins as determined by ICP-MS. q Ultraviolet–visible absorption spectra of 22 µM Cu(I) with 200 μM BCS in 50 mM HEPES, 200 mM NaCl, 1 mM GSH, pH 7.4 during titrations with apo-PDK1. r The proposed model summarizes the roles of SLC31A1-copper signaling in driving Wnt/β-catenin activation and CSC properties. Data were expressed as mean ± SD of ≥3 independent experiments. The p-values in panels e, f, h were calculated by one-way ANOVA. The p-value in panel j was calculated by Kruskal–Wallis test.
Fig. 3
Fig. 3. Activation of Wnt/β-catenin pathway promotes resistance to cuproptosis in cancer stem cells.
a Schematic diagram illustrates the isolation of CSCs. b Cell viability of CAL27, FaDu, and A375 sphere cells compared to parental cells after 24 h of ES-Cu treatment. c Spearman correlation analyses reveal associations between Wnt/β-catenin signaling, cuproptosis regulation signatures, and hallmark gene signatures in TCGA and GSE41613 dataset. Cell death measurement of CAL27 (d), FaDu (e), and A375 (f) sphere cells following treatment with ES-Cu (100 nM) and LF3 (CAL27 and FaDu sphere for 10 μM, A375 sphere for 5 μM) in the absence or presence of TTM (40 μM), Z-VAD-FMK (20 μM), Nec-1 (20 μM), or Fer-1 (10 μM) for 24 h. g Mitochondrial ROS levels of CAL27 and FaDu sphere cells treated with ES-Cu (100 nM) for 24 h. h Relative GSH/GSSG ratio was evaluated in CAL27, FaDu, and A375 sphere cells. i GSEA results of the indicated pathways in CAL27 sphere cells treated with the Wnt inhibitor LF3 (10 μM). j Copper content measured by ICP-MS in CAL27 and FaDu sphere cells treated with LF3 (10 μM) and indicated concentrations of ES-Cu for 4 h. Cellular uptake results were corrected by protein levels. Data were expressed as mean ± SD of ≥3 independent experiments. The p-values in b, df, h, j were calculated by Student’s t test.
Fig. 4
Fig. 4. TCF4 protects cancer stem cells from cuproptosis by regulating ATP7B.
a Representative immunohistochemistry results show diminished TCF4 expression in normal mucosa (n = 42) in contrast to HNSCC tissues with different pathological grades (I, 53; II, 121; III, 36). b Kaplan–Meier analysis reveals worse overall survival for HNSCC patients with high TCF4 expression (median cutoff). Cell death measurement of CAL27 (c) and A375 (d) sphere cells following treatment with ES-Cu (100 nM) in the absence or presence of TTM (40 μM), Z-VAD-FMK (20 μM), Nec-1 (20 μM), or Fer-1 (10 μM) for 24 h. e Cell death measurement of CAL27 and A375 sphere cells transfected with control or TCF4-coding plasmid. f Relative GSH/GSSG ratio was evaluated in CAL27 and A375 sphere cells. g Copper content measured by ICP-MS in CAL27 and A375 sphere cells treated with indicated concentrations of ES-Cu for 4 h. Cellular uptake results were corrected by protein levels. h Cuproptosis marker FDX1 expression was detected in CAL27 sphere cells treated with ES-Cu for 24 h. i Schematic diagram illustrating the CUT&Tag assay in CAL27 sphere cells. j Venn diagram illustrating genes at the intersection of TCF4 bound promoters that were identified by CUT&Tag, RNA-seq data from LF3-treated CAL27 sphere cells, and cuproptosis-regulated genes. k The heatmap depicting the expression levels of genes in CAL27 sphere cells treated with or without LF3. l Bar graphs showing fold change of the cuproptosis-related genes expression in sgTCF4 CAL27 sphere cells. m Cell death measurement of ES-Cu (100 nM, 24 h) treated sgTCF4 CAL27 and A375 sphere cells transfected with ATP7B-coding plasmid. n DLAT oligomerization was analyzed of ES-Cu (50 nM, 24 h) treated sgTCF4 CAL27 sphere cells transfected with ATP7B-coding plasmid. Data were expressed as mean ± SD of ≥ 3 independent experiments. The p-value in panel a was calculated by Kruskal–Wallis test. The p-values in cf, m were calculated by one-way ANOVA. The p-value in g was calculated by Student’s t test.
Fig. 5
Fig. 5. The β-catenin/TCF4 complex activates ATP7B transcription.
a TCF4 CUT&Tag signal height and position relative to transcription start sites (TSSs) for all genes in CAL27 sphere cells. b CUT&Tag density heatmap of TCF4 enrichment in CAL27 sphere cells within 3 kb around TSS. c IGV tracks reveal TCF4 occupancy peaks in the ATP7B promoter region. d Primers spanning the ATP7B promoter for ChIP analyses. e Enrichment of ATP7B promoter fragments using TCF4 antibody was assessed by ChIP-qPCR analysis. Agarose gels results confirm amplification of ATP7B promoter regions in TCF4 (f) and β-catenin (g) ChIP samples. h The binding motif of TCF4 and potential binding sites in ATP7B promoter region. i Dual-luciferase reporter assay was carried out to verify the binging sequence of TCF4 in the ATP7B promoter region. Q-PCR (j) and WB (k) analysis of the indicated markers in TCF4 knockout CAL27 and A375 sphere cells by Wnt3a treatment (50 ng/ml, 24 h). Q-PCR (l) and WB (m) analysis of the indicated markers in CAL27 and A375 sphere cells followed by TCF4-coding plasmid and LF3 treatment (CAL27 sphere, 10 μM; A375 sphere, 5 μM) for 24 h. Data were expressed as mean ± SD of ≥3 independent experiments. The p-values in e, i were calculated by Student’s t test. The p-values in j, l were calculated by one-way ANOVA.
Fig. 6
Fig. 6. TCF4 deficiency or Wnt signaling inhibition enhances the anticancer activity of elesclomol-Cu in vivo.
a The scheme outlines subcutaneous implantation of sgNC or sgTCF4 CAL27 cells in BALB/c nude mice followed by ES-Cu treatment (10 mg/kg). Representative tumor images (b) and tumor volume growth curves (c) in different groups. d Scheme illustrating combined treatment with the Wnt inhibitor LF3 (50 mg/kg) and ES-Cu (10 mg/kg) in CAL27 tumor-bearing nude mice. Representative tumor images (e) and tumor volume growth curves (f) in different groups. g WB analysis of indicated markers expression in sgTCF4 and ES-Cu treated CAL27 tumors. h Representative IHC staining and quantification of Ki67 and ATP7B in different groups. i Scheme illustrating combined LF3 and ES-Cu therapy in B16-F10 melanoma allografts. Representative tumor images (j) and growth curves (k) of B16-F10 tumor treated with LF3 in combination with ES-Cu. l Representative flow cytometry plots and quantification analysis of CD8+ T cell populations in different groups. Data were expressed as mean ± SD of ≥ 3 independent experiments. The p-values in panels c, f, h, k, l were calculated by one-way ANOVA.
Fig. 7
Fig. 7. Model for regulation of cuproptosis sensitivity by Wnt/β-catenin signaling in cancer cells.
Copper directly binds and activates PDK1, stimulating its interaction with AKT to trigger downstream AKT-GSK3β-β-catenin pathway activation and cancer stem cell (CSC) properties. Importantly, aberrant Wnt/β-catenin activation confers CSC resistance to cuproptosis through transcriptional upregulation of the copper efflux transporter ATP7B. Genetic or pharmacological inhibition of Wnt/β-catenin signaling restores cuproptosis sensitivity, enhancing the anticancer efficacy of the copper-binding compound elesclomol.

References

    1. Ge E, Bush A, Casini A, Cobine P, Cross J, DeNicola G, et al. Connecting copper and cancer: from transition metal signalling to metalloplasia. Nat Rev Cancer. 2022;22:102–13. - PMC - PubMed
    1. Brady DC, Crowe MS, Turski ML, Hobbs GA, Yao X, Chaikuad A, et al. Copper is required for oncogenic BRAF signalling and tumorigenesis. Nature. 2014;509:492–96. - PMC - PubMed
    1. Das A, Ash D, Fouda A, Sudhahar V, Kim Y, Hou Y, et al. Cysteine oxidation of copper transporter CTR1 drives VEGFR2 signalling and angiogenesis. Nat Cell Biol. 2022;24:35–50. - PMC - PubMed
    1. Tsang T, Posimo J, Gudiel A, Cicchini M, Feldser D, Brady D. Copper is an essential regulator of the autophagic kinases ULK1/2 to drive lung adenocarcinoma. Nat Cell Biol. 2020;22:412–24. - PMC - PubMed
    1. Ramchandani D, Berisa M, Tavarez D, Li Z, Miele M, Bai Y, et al. Copper depletion modulates mitochondrial oxidative phosphorylation to impair triple negative breast cancer metastasis. Nat Commun. 2021;12:7311. - PMC - PubMed

MeSH terms

Substances