. 2024 Jul 11;14(1):16000.
doi: 10.1038/s41598-024-66885-2.

Early mutational signatures and transmissibility of SARS-CoV-2 Gamma and Lambda variants in Chile

Affiliations

Early mutational signatures and transmissibility of SARS-CoV-2 Gamma and Lambda variants in Chile

Karen Y Oróstica et al. Sci Rep. .

Abstract

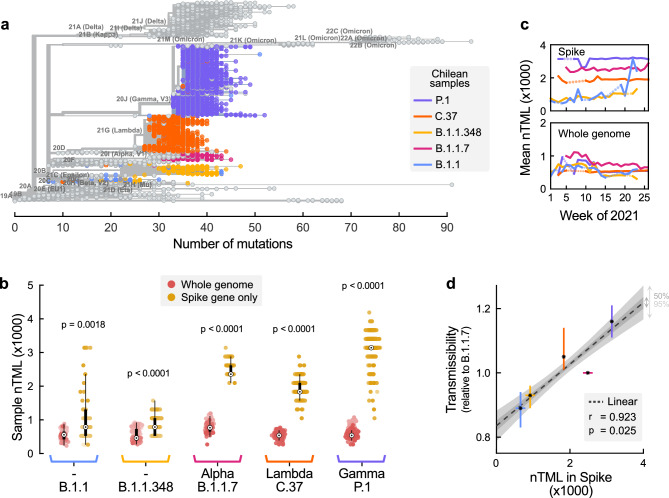
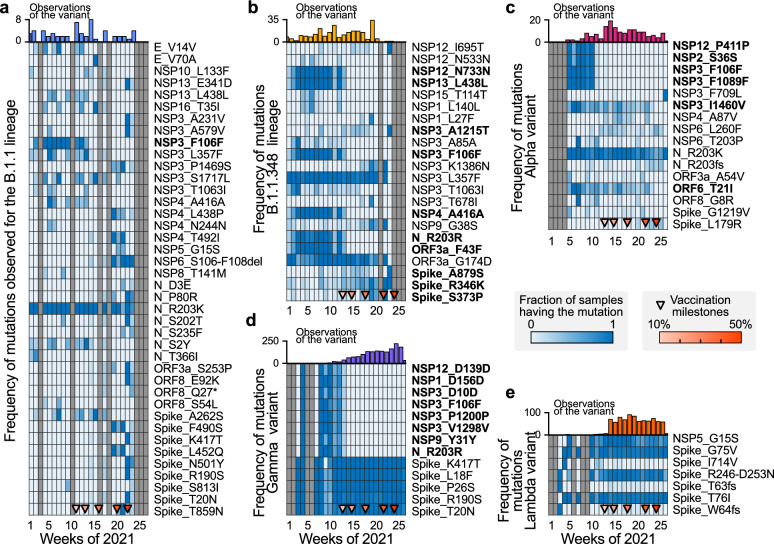
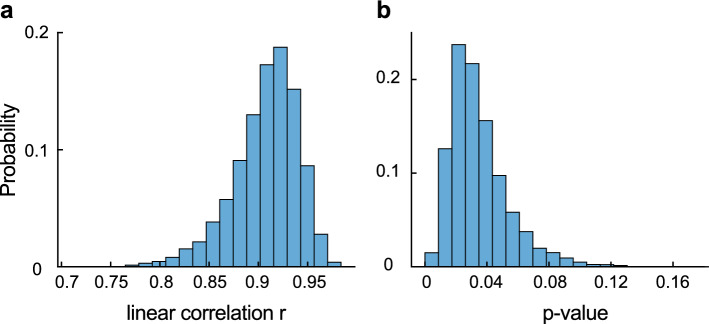
Genomic surveillance (GS) programmes were crucial in identifying and quantifying the mutating patterns of SARS-CoV-2 during the COVID-19 pandemic. In this work, we develop a Bayesian framework to quantify the relative transmissibility of different variants tailored for regions with limited GS. We use it to study the relative transmissibility of SARS-CoV-2 variants in Chile. Among the 3443 SARS-CoV-2 genomes collected between January and June 2021, where sampling was designed to be representative, the Gamma (P.1), Lambda (C.37), Alpha (B.1.1.7), B.1.1.348, and B.1.1 lineages were predominant. We found that Lambda and Gamma variants' reproduction numbers were 5% (95% CI: [1%, 14%]) and 16% (95% CI: [11%, 21%]) larger than Alpha's, respectively. Besides, we observed a systematic mutation enrichment in the Spike gene for all circulating variants, which strongly correlated with variants' transmissibility during the studied period (r = 0.93, p-value = 0.025). We also characterised the mutational signatures of local samples and their evolution over time and with the progress of vaccination, comparing them with those of samples collected in other regions worldwide. Altogether, our work provides a reliable method for quantifying variant transmissibility under subsampling and emphasises the importance of continuous genomic surveillance.


Conflict of interest statement

The authors declare no competing interests.

Figures

Figure 1
Figure 1
Bayesian inference enables individual assessment of the contribution of different SARS-CoV-2 variants to the spread of COVID-19. (a) Throughout 2021, five SARS-CoV-2 variants were identified as predominant in Chile, two considered Variants of Concern (VoC) by the WHO (Alpha, and Gamma), one Variant of Interest (Lambda), and two other unflagged lineages (B.1.1 and B.1.1.348). The total black line also included other non-predominant variants. Assuming that the contribution of each variant to the spreading dynamics (a–c) is proportional to their share (i.e., the fraction they represent of the total samples, d–h), we quantified their transmissibility compared to the Alpha variant (i–m). The Lambda and Gamma variants showed a 1.05 (95% CI [1.01,1.14]) and 1.16 (95% CI [1.11,1.21]) fold higher reproduction number than the Alpha variant. Other variants had a comparatively lower influence on the spread. Shaded areas in the b–h panels account for the 95% credible intervals of the model fit. Complementary parameters and variables are summarised in Supplementary Fig. S1.
Figure 2
Figure 2
Predominant variants are enriched with mutations in the Spike gene. (a) The Nextclade-based (https://clades.nextstrain.org/tree) phylogenetic tree of the SARS-CoV-2 variants isolated in Chile, visualised using Auspice online tool (https://auspice.us/ ) based on n = 2650 SARS-CoV-2 cases. The sequences are placed on a global reference tree (grey brunches and nodes), and clades are assigned to the nearest neighbour, while the branches with coloured circles represent lineages from Chile. (b) The normalised Total Mutational Load (nTML) indicates that the Spike gene is enriched in mutations compared to the entire genome for all analysed variants. The apparent discreteness of the Spike nTML traces is due to the shorter gene length. The white points denote the median, black boxes denote the interquartile ranges, and whiskers (thin black lines) extend until at most 1.5 times the length of the interquartile range, and dot opacity denotes the time when samples were collected (light old, dark recent). Significance levels were determined with an u-test, see Supplementary Table S2). c. The most predominant variants do not show a considerable drift in their average nTML over time. Dotted lines account for weeks when the variants were not observed. d. There is a marked and significant positive correlation between nTML in Spike and the variants’ relative transmissibility (median r = 0.923, p-value = 0.025). Vertical error bars are those reported in Figure 1, asterisks denote median values, and horizontal error bars were estimated through bootstrapping.
Figure 3
Figure 3
Signatures of the settlement, replacement, and selection of mutations in the different observed lineages of SARS-CoV-2. Throughout 2021, the set of mutations that are present in the analysed samples of the predominant lineages has changed. This temporal evolution of the mutational footprint of the lineages can be quantified by the proportion of the analysed samples which present a given mutation. We selected mutations with the largest temporal variability for each lineage, and we present their evolution as a heat map. (a–e) Evolution of the fraction of the samples presenting a given mutation for the B.1.1 (a), B.1.1.348 (b), Alpha (c), Gamma (d), and Lambda (e) variants, respectively, with their number of observations. Triangle markers at the lower end of each heat map account for the progress in vaccination.
Figure 4
Figure 4
Robustness check: linear correlation between nTML in spike and variant transmissibility. Probability-normalised histograms for the linear correlation coefficient (a) and the associated p-value (b) in the Monte Carlo-inspired experiment to test for robustness. We see that the correlation is statistically significant for most of the hypothetical curves.

References

    1. Plante JA, Mitchell BM, Plante KS, Debbink K, Weaver SC, Menachery VD. The variant gambit: COVID’s next move. Cell Host Microbe. 2021;29:508. doi: 10.1016/j.chom.2021.02.020. - DOI - PMC - PubMed
    1. Van Egeren D, et al. Risk of evolutionary escape from neutralizing antibodies targeting SARS-CoV-2 spike protein. MedRxiv. 2020;2020:11.
    1. Singh D, Yi SV. On the origin and evolution of sars-cov-2. Exp. Mol. Med. 2021;53(4):537–547. doi: 10.1038/s12276-021-00604-z. - DOI - PMC - PubMed
    1. Rogozin IB, et al. Properties and mechanisms of deletions, insertions, and substitutions in the evolutionary history of sars-cov-2. Int. J. Mol. Sci. 2024;25(7):3696. doi: 10.3390/ijms25073696. - DOI - PMC - PubMed
    1. Thompson RN, Hill EM, Julia RG. Sars-cov-2 incidence and vaccine escape. Lancet Infect. Dis. 2021;21:913. doi: 10.1016/S1473-3099(21)00202-4. - DOI - PMC - PubMed

Substances

Supplementary concepts