. 2024 Sep;27(9):1745-1757.
doi: 10.1038/s41593-024-01700-9. Epub 2024 Jul 10.

The cerebellum modulates thirst

Affiliations

The cerebellum modulates thirst

Ila Mishra et al. Nat Neurosci. 2024 Sep.

Abstract

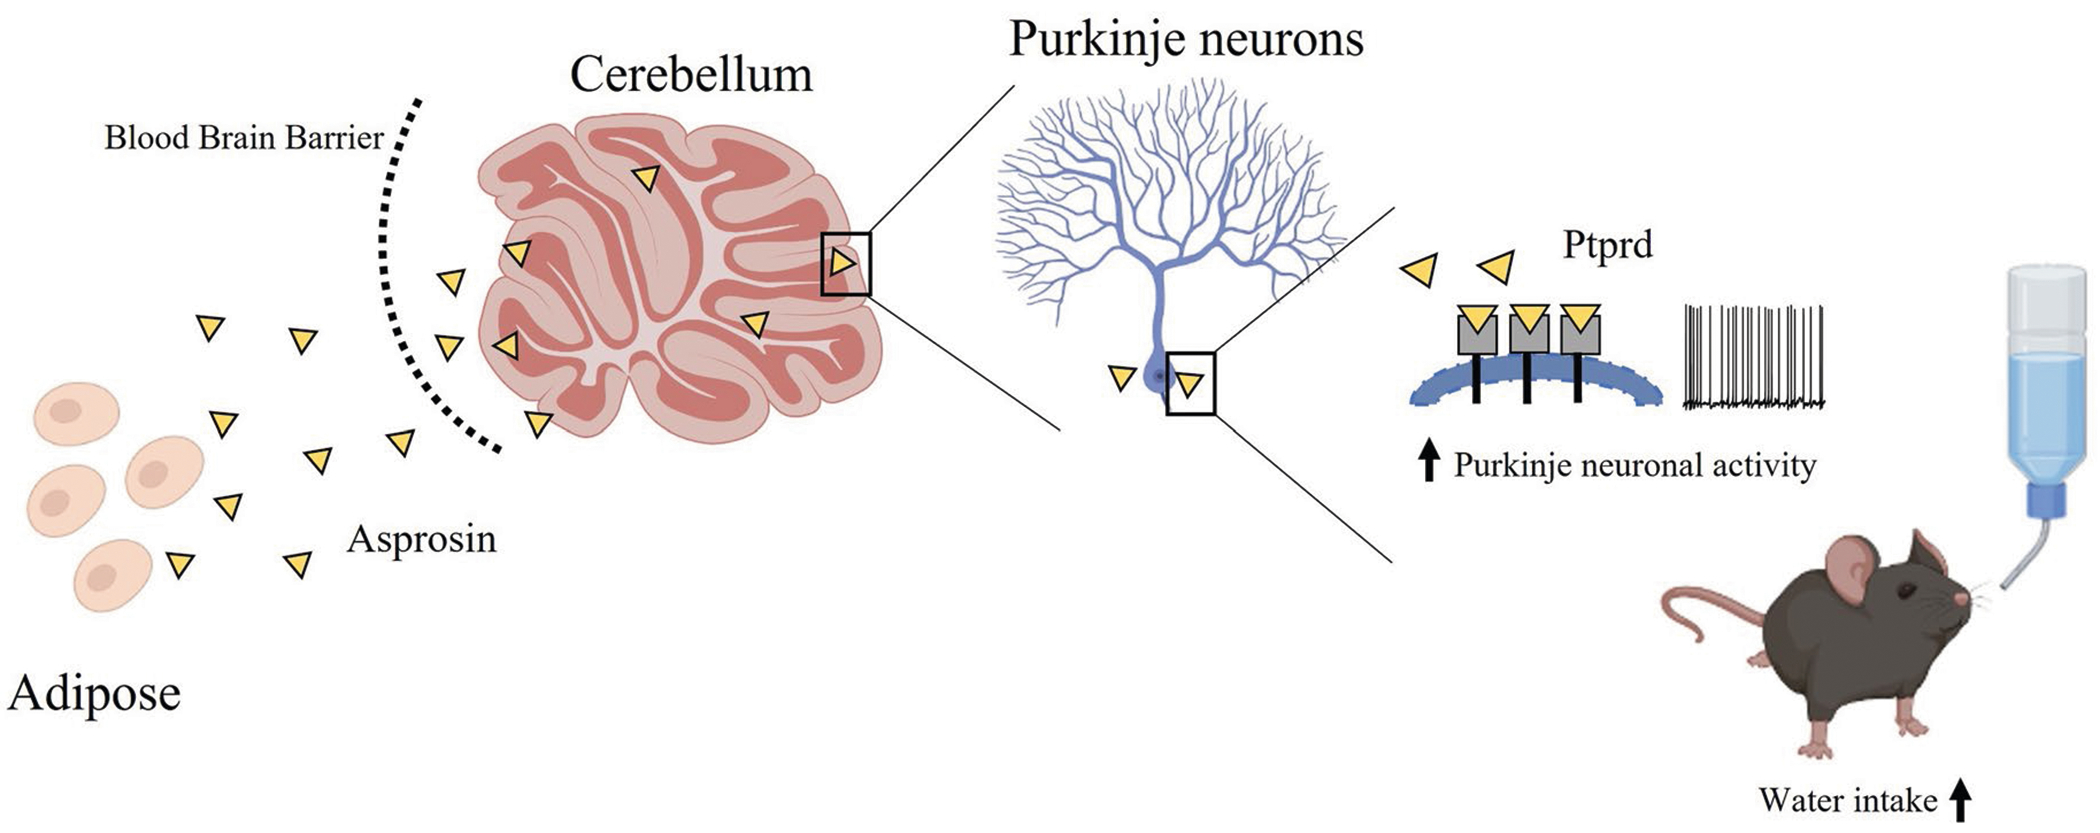
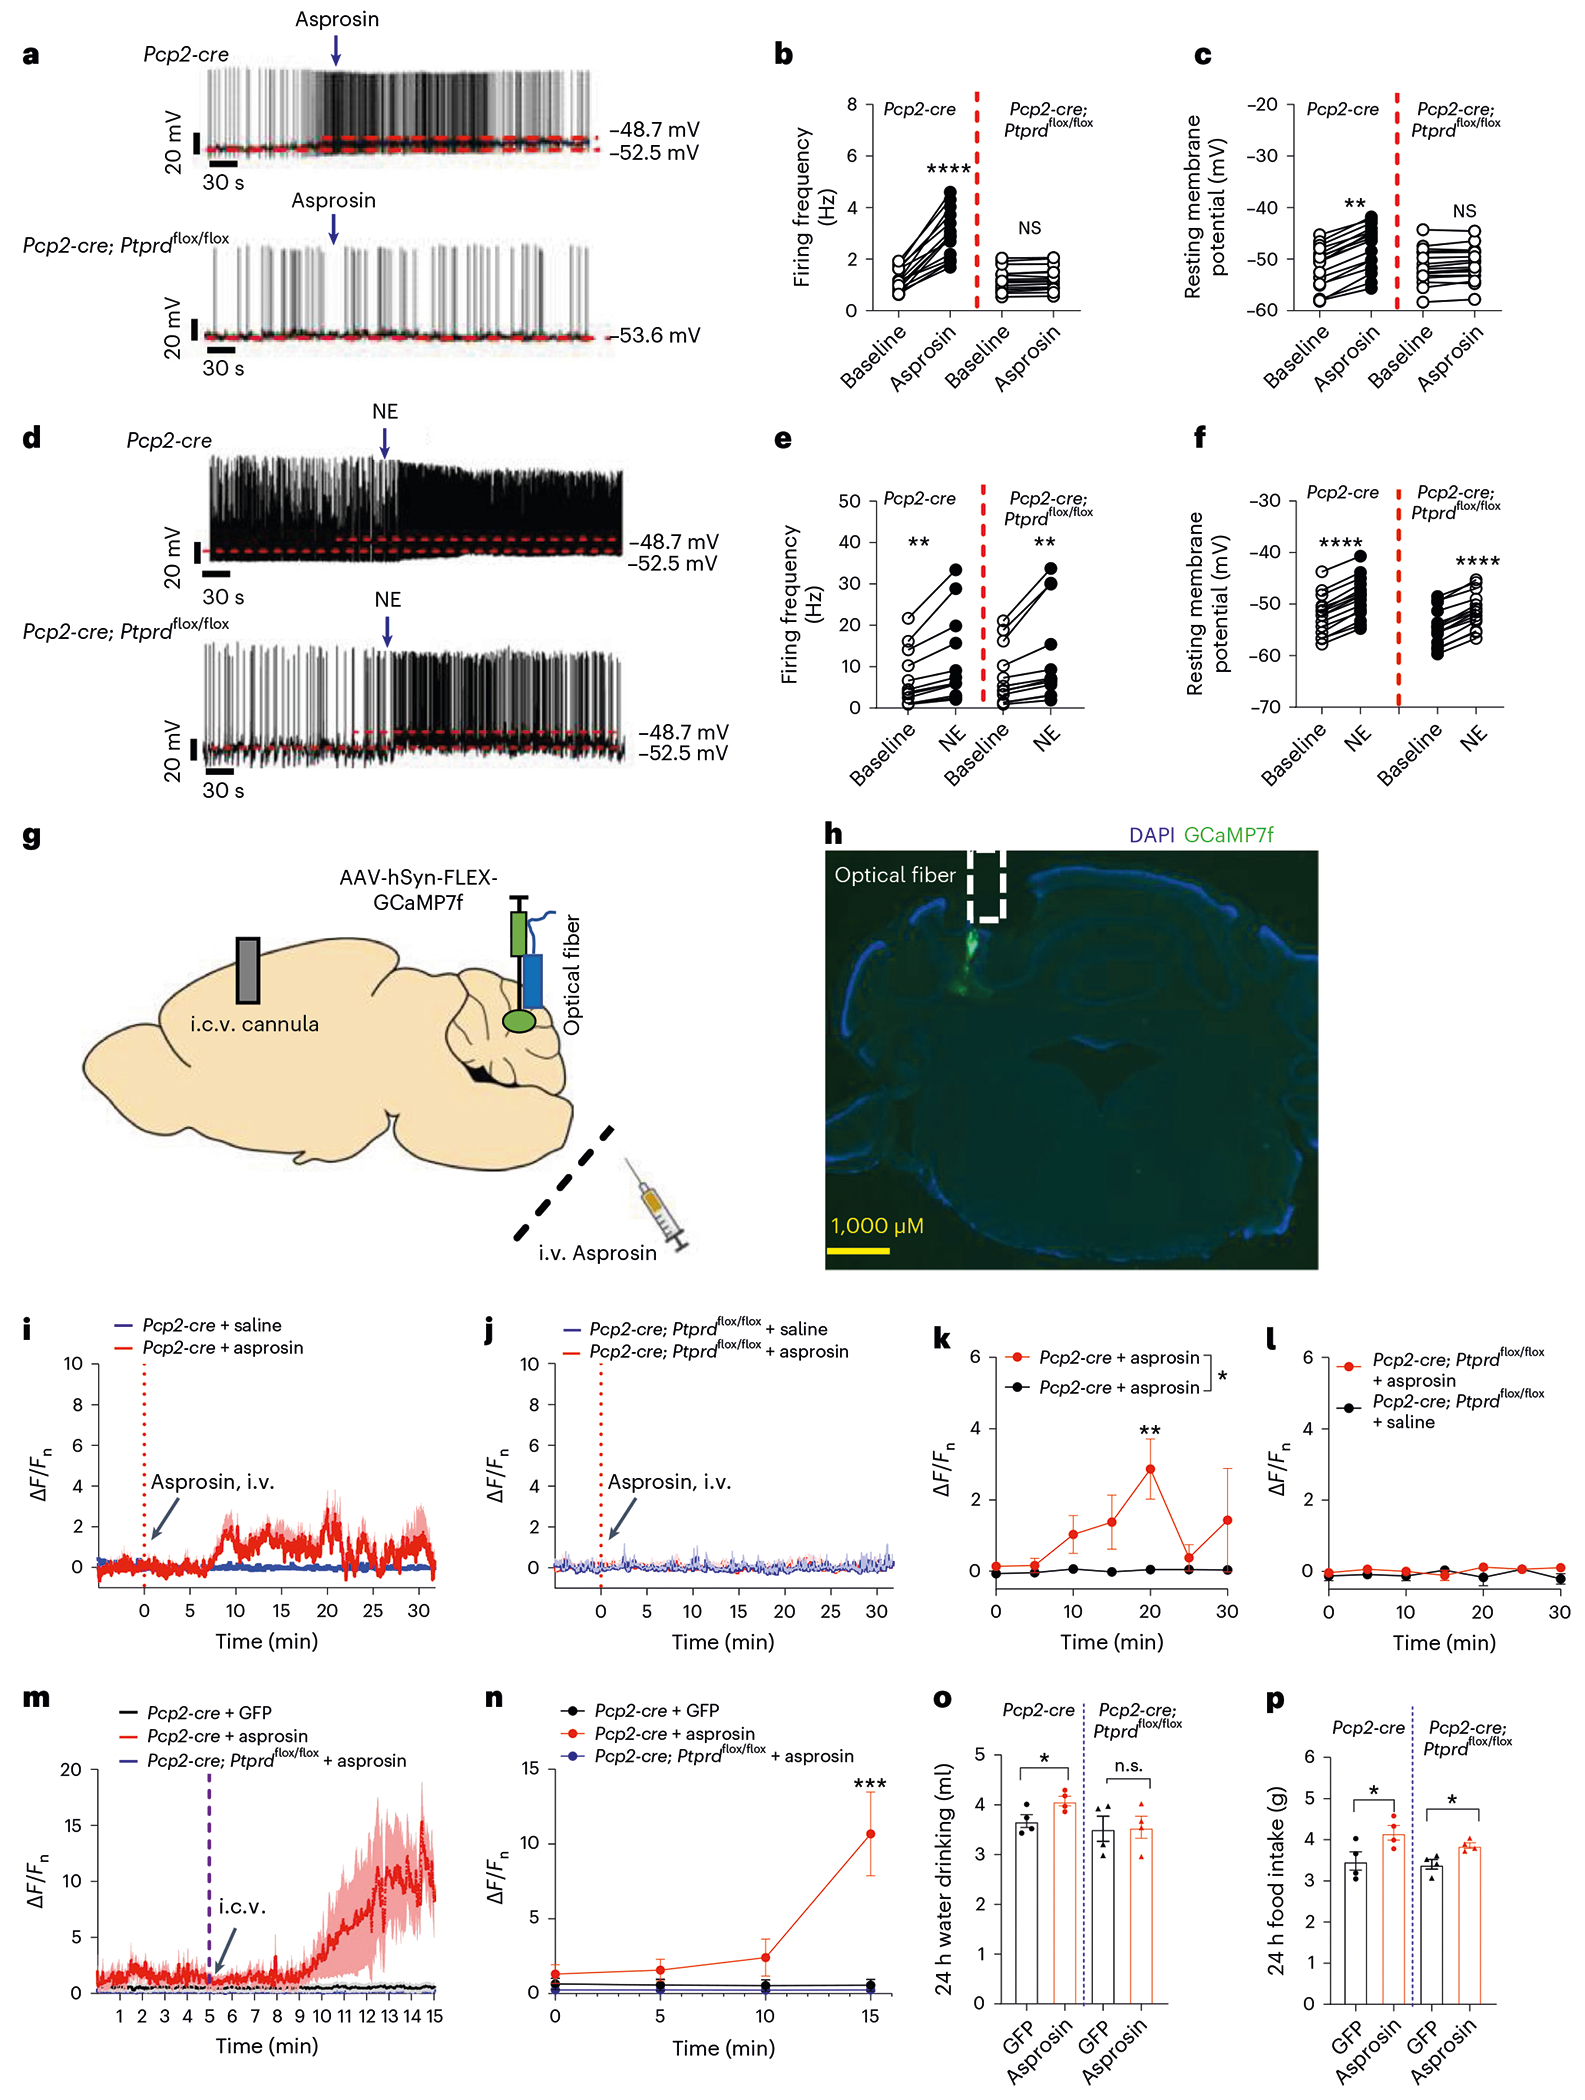
The cerebellum, a phylogenetically ancient brain region, has long been considered strictly a motor control structure. Recent studies have implicated the cerebellum in cognition, sensation, emotion and autonomic function, making it an important target for further investigation. Here, we show that cerebellar Purkinje neurons in mice are activated by the hormone asprosin, leading to enhanced thirst, and that optogenetic or chemogenetic activation of Purkinje neurons induces rapid manifestation of water drinking. Purkinje neuron-specific asprosin receptor (Ptprd) deletion results in reduced water intake without affecting food intake and abolishes asprosin's dipsogenic effect. Purkinje neuron-mediated motor learning and coordination were unaffected by these manipulations, indicating independent control of two divergent functions by Purkinje neurons. Our results show that the cerebellum is a thirst-modulating brain area and that asprosin-Ptprd signaling may be a potential therapeutic target for the management of thirst disorders.


Conflict of interest statement

Competing interests

A.R.C. has been awarded asprosin-related patents and is a co-founder and equity holder of Aceragen and Recall Therapeutics. The other authors declare no competing interests.

Figures

Extended Data Fig. 1 |
Extended Data Fig. 1 |. AgRP neuron-specific Ptprd deletion does not affect water intake.
(a) Body weight of 5-week-old male and female Ptprdf/f and AgRP-cre;Ptprdf/f mice maintained on ad libitum fed normal chow diet (n = 8 males and 9 females/group). (b-c) 24h food and water intake of 14-week-old male and 8-week-old female Ptprdf/f and AgRP-cre;Ptprdf/f mice maintained on ad libitum normal chow diet (n = 4/group). (d) Body weight of female Ptprdf/f and AgRP-cre;Ptprdf/f mice on normal chow (week 5, n = 10/group), and after 5 weeks of high fat diet (Week 10; n = 8/ group). (e-g) Daily Food intake (E), cumulative water intake (F) and average daily water intake (G) of 14-week-old Ptprdf/f and AgRP-cre;Ptprdf/f mice, measured over 4 days using the Promethion metabolic system (n = 6 / group). Error bars represent mean ± s.e.m. *p < 0.05, **p < 0.01, ***p < 0.001, and ****p < 0.0001; by Two-way ANOVA followed by Sidak’s multiple comparison in A-E, 2-Way ANOVA (effect of genotype) in F and two tailed unpaired Student’s t-test in G. Raw data values, P values and details of statistical tests in Extended source data 1.
Extended Data Fig. 2 |
Extended Data Fig. 2 |. Cerebellar Purkinje neurons, but not granule neurons, are responsive to asprosin.
(a) Data analysis of cerebellar granule neurons resting membrane potential in response to puff (2s) treatment of 30 nM recombinant asprosin (n = 19 neurons from 3 male mice). (b) Data analysis of cerebellar granule neurons resting membrane potential in response to puff (2s) treatment of 30 nM recombinant asprosin, in the presence of cocktail synaptic blockers including 1 μM tetrodotoxin (TTX, 30 μM AP-5, 30 μM CNQX and 50 μM bicuculline; n = 17 neurons from 3 male mice). (c) Schematic of coronal brain section showing Purkinje neurons recorded in different places. (d-e) Data analysis of cerebellar Purkinje neurons firing frequency and resting membrane potential in response to puff (2s) treatment of 30 nM recombinant asprosin (n = 21 neurons with baseline firing from 3 male mice in the range of 1–6 Hz, n = 14 neurons from 3 male mice with baseline firing in the range of 10–30, n = 38 neurons from 3 male mice with baseline firing in the range of 46–64 Hz). *p < 0.05, **p < 0.01, ***p < 0.001, and ****p < 0.0001; by Two-tailed paired Student’s t-test. Raw data values, P values and details of statistical tests in Extended source data 2.
Extended Data Fig. 3 |
Extended Data Fig. 3 |. Chemogenetic activation of Purkinje neurons enhances water intake without affecting food intake or body weight.
(a-i) Mean ± s.e.m. 24h water intake (A,D,G) food intake (B,E,H) and body weight (C,F,I) post intraperitoneal injection of CNO (3 mg/kg, twice/day) or saline in Pcp2cre male mice stereotaxically injected with Cre-dependent AAV expressing hSyn-DIO-hM3Dq-mCherry in lobe IV-V, VII-VIII and VIII-IX of cerebellum (n = 6 mice/treatment/brain site). (j-l) CNO treatment does not cause hyperdipsia in absence of hSyn-DIO-hM3Dq-mCherry. Mean ± s.e.m. 24h food and water intake (number of drinking bouts, time spent drinking and water intake) post intraperitoneal injection of CNO (3 mg/kg, twice/day) or saline in Pcp2cre male mice stereotaxically injected with Cre-dependent AAV expressing hSyn-DIO-mCherry in lobe VII-VIII of cerebellum (n = 6 mice/treatment). *p < 0.05, **p < 0.01, ***p < 0.001, and ****p < 0.0001; by unpaired two-tailed Student’s t-test. Raw data values, P values and details of statistical tests in Extended source data 3.
Extended Data Fig. 4 |
Extended Data Fig. 4 |. Purkinje neuron-specific Ptprd deletion affects water, isotonic and hypertonic saline intake.
(a-b) Water intake of 8-week-old Pcp2cre;Ptprd+/+ and Pcp2cre;Ptprdflox/flox female mice maintained on normal chow diet, measured using the Promethion metabolic system (n = 5/group). (c) Body weight of 8-week-old Pcp2cre;Ptprd+/+ and Pcp2-cre;Ptprdflox/flox female mice maintained on normal chow diet (n = 5/group). (d-f) Cumulative food intake (D), hourly energy expenditure (E) and respiratory exchange ratio (F) of 8-week-old Pcp2-cre;Ptprd+/+ and Pcp2cre;Ptprdflox/flox female mice maintained on normal chow diet, measured using the Promethion metabolic system (n = 5/ group). (g-h) Lick frequency (counts per first minute, and cumulative counts per first 5 minutes of water access) of Pcp2cre;Ptprd+/+ (n=5 per group) and Pcp2cre;Ptprdflox/flox male (n = 4 per group) mice given re-access to water after overnight water deprivation. (i-j) 48h isotonic and hypertonic (500mM) saline intake of Pcp2-cre;Ptprd+/+ and Pcp2cre;Ptprdflox/flox male mice (n = 4 per group). Error bars represent mean ± s.e.m. *p < 0.05, **p < 0.01, ***p < 0.001, and ****p < 0.0001; by Student’s t-test (B, C,G-J) and two-way ANOVA (effect of genotype) in A,D,E and F. Raw data values, P values and details of statistical tests in Extended source data 4.
Extended Data Fig. 5 |
Extended Data Fig. 5 |. Purkinje neuron-specific Ptprd deletion does not protect from diet induced obesity.
Weekly body weight change of Pcp2cre;Ptprd+/+ (male: n=8; female: n=5) and Pcp2cre;Ptprdflox/flox (male: n=7; female: n=5) mice maintained on high-fat diet (HFD) from 5-weeks-of-age. NS: not significant; by two-way ANOVA (effect of genotype). Raw data values, P values and details of statistical tests in Extended source data 5.
Extended Data Fig. 6 |
Extended Data Fig. 6 |. Purkinje neuron-specific Ptprd loss results in increased regularity of Purkinje neuron complex spikes.
(a) Schematic representation of an in vivo awake single-unit recording. (b-c, top) Raw electrophysiological trace of Purkinje cell activity in awake Pcp2-cre;Ptprd+/+ (B) and Pcp2cre;Ptprdflox/flox (C) mice (scale: 1 s). (B-C, bottom) Cumulative overlay of multiple simple spike (left) and complex spike (right) waveforms demonstrating the consistency in the action potential shapes from the above representative traces. (d-f) Comparison of simple spike features including firing rate (D), CV (E), and CV2 (F) in Pcp2-cre;Ptprd+/+ (N = 7, n = 18) and Pcp2cre;Ptprdflox/flox (N = 7, n = 17) mice. (g-j) Comparison of complex spike features including firing rate (G), CV (H), and CV2 (I) in Pcp2-cre;Ptprd+/+ (N = 7, n = 18) and Pcp2cre;Ptprdflox/flox (N = 7, n = 17) mice. Mean of firing rate, CV and CV2 plotted in (D-I). Number of animals is represented as ‘N’ while number of cells is represented as ‘n’. *p < 0.05 as determined by unpaired t-tests with Welch’s correction and adjusted for multiple comparisons using the Bonferroni method. Raw data values, P values and details of statistical tests in Extended source data 6.
Extended Data Fig. 7 |
Extended Data Fig. 7 |. Purkinje neurons are unresponsive to traditional dipsogenic stimuli.
(a-c) GCaMP7 fluorescent response of Pcp2cre neurons in response to hypertonic stress (3M NaCl and 2M mannitol) and hypovolemic stress (30% polyethylene glycol; PEG; n = 5 wild type mice in each treatment). (d-f) 2h water intake (D,E) and 48 h water intake (F) of control (Pcp2-cre;Ptprd+/+) and knockout (Pcp2-cre;Ptprdflox/flox) mice injected with 3M NaCl (D), 2M mannitol (E) and 30% PEG (F). n = 6 Pcp2-cre;Ptprd+/+ and 11 Pcp2-cre;Ptprdflox/flox mice in (D) or 5 Pcp2-cre;Ptprd+/+ and 11 Pcp2-cre;Ptprdflox/flox mice in (E) and n = 12 Pcp2-cre;Ptprd+/+ and n = 11 Pcp2-cre;Ptprdflox/flox mice in (F). Error bars represent mean ± s.e.m. *p < 0.05, **p < 0.01, ***p < 0.001, and ****p < 0.0001; by two-tailed unpaired Student’s t-test. Raw data values, P values and details of statistical tests in Extended source data 7.
Extended Data Fig. 8 |
Extended Data Fig. 8 |. Purkinje Neurons modulate thirst.
Asprosin activates the cerebellar Purkinje neurons via the Ptprd receptor, leading to rapid manifestation of water drinking behavior.
Fig. 1 |
Fig. 1 |. Genetic and pharmacological asprosin inhibition is associated with hypodipsia.
ad, Cumulative water intake and average daily (24 h) water intake of WT Fbn1+/+ and Fbn1NPS/+ male (a,b) and female (c,d) mice (n = 7 WT and n = 6 Fbn1NPS/+). e, Plasma osmolality of overnight fasted Fbn1+/+ (WT; n = 16) and Fbn1NPS/+ (n = 17) female mice. f,g, Osmolality (n = 14 WT and n = 16 Fbn1NPS/+) and volume (n = 17 per group) of 24 h urine output of fasting WT and Fbn1NPS/+ female mice. hk, Cumulative water intake and average daily (24 h) water intake of Ptprd+/+ (WT) and Ptprd−/− male (h,i) and female (j,k) mice measured over 3 days (male, n = 18 WT and n = 14 Ptprd−/−; female, n = 14 WT and n = 10 Ptprd−/−). l, Plasma osmolality of overnight fasted control WT (n = 8) and Ptprd−/− (n = 9) female mice. m,n, Osmolality (n = 9 per group) and volume (n = 8 per group) of 24-h urine output of fasting WT and Ptprd−/− female mice. o,p, 24-h water intake and urine output measured after a single dose of anti-asprosin mAb (250 μg per mouse) or IgG in fasting male C57BL/6 mice (n = 8 IgG treated and n = 7 mAb treated mice). q, 2-h water intake measured after intranasal treatment of recombinant asprosin (rAsprosin) (2 μg in 15 μl saline, n = 6) or vehicle (15 μl saline, n = 5) in male C57BL/6 mice. rt, Daily food and water intake under ad libitum food and water access (r,s) and water intake under fasting conditions (t), measured on days 66–69 after male C57BL/6J male mice were tail-vein-injected with AAV8-empty or AAV8-asprosin (n = 8 of AAV8-empty and n = 10 of AAV8-asprosin in (r) and n = 9 of AAV8-empty and n = 11 of AAV8-asprosin) viral vector. uv, Cumulative water intake of normal chow-fed WT and Ptprd−/− male mice tail-vein transduced with Ad5-empty or Ad5-Asprosin viruses, days 9–12 post adenoviral vector transduction (n = 6 per group except n = 5 in Ptprd−/− mice + Ad5-empty in (v). w, Plasma asprosin detection with sandwich ELISA in lean male mice subjected to overnight (16 h) water deprivation (n = 15 per group). Error bars, s.e.m. *P < 0.05, **P < 0.01, ***P < 0.001 and ****P < 0.0001; by Student’s t-test (b, dg, i, kt and v,w), ‘effect of genotype’ determined by two-way ANOVA (a, c, h, j and u). Also see Supplementary Fig. 1 for individual data plot and Source Data for raw values and details of statistical analysis.
Fig. 2 |
Fig. 2 |. Asprosin activates cerebellar Purkinje neurons.
a, Representative brain sections from mouse (left) and human (right) brains pre-incubated with GFP (top) or free asprosin (bottom) subjected to competitive binding assay with AP-tagged asprosin. Scale bars, 10 μm. b, qPCR results showing relative mRNA levels of Ptprd from visually enriched tdTOMATO expressing Purkinje neurons (tdTOMATO-Pcp2-cre), granule neurons and liver from male mice (n = 10 neurons per biological replicate; n = 6 biological replicates per Purkinje group, n = 4 biological replicates per granule neuron; n = 4 biological liver replicates). Error bars, s.e.m. cd, Representative image of immunostaining of Pcp2 (red) and Ptprd (green) of cerebellum of adult male mouse using fluorescence microscopy. e, Representative image of recorded Pcp2+ neurons under brightfield and fluorescence microscopy and representative action potential firing traces of Pcp2+ neurons after puff treatment of control GFP or recombinant asprosin. f, Data analysis of action potential firing frequency and membrane potential in Pcp2+ neurons post GFP or 30 nM recombinant mammalian asprosin puff treatment from male (top) and female (bottom) mice (n = 9–16 in each region from five different mice and sex: n = 16 resting membrane potential and n = 7 firing frequency of males and females treated with asprosin, n = 9 for resting membrane potential and n = 5 firing frequency of males and females treated with GFP). g, Representative resting membrane potential trace of Pcp2+ neurons in response to 30 nM recombinant mammalian asprosin or GFP in the presence of a cocktail of synaptic blockers including 1 μM tetrodotoxin (TTX), 30 μM AP-5, 30 μM CNQX and 50 μM bicuculline. h, Data analysis of resting membrane potential in Pcp2+ neurons post GFP or 30 nM recombinant mammalian asprosin puff treatment in the presence of cocktail synaptic blockers including 1 μM TTX, 30 μM AP-5, 30 μM CNQX and 50 μM bicuculline (n = 14 in each group from three different male mice). *P < 0.05, **P < 0.01, ***P < 0.001 and ****P < 0.0001 by Student’s t-test (f and h). Details of statistical analysis are in Source Data.
Fig. 3 |
Fig. 3 |. Purkinje neuron activation enhances water intake in mice.
a, Schematic of the experimental strategy using the Cre-dependent AAV expressing hSyn-DIO-hM3Dq-mCherry to activate the Purkinje neurons of the Pcp2-cre mice in lobes V–VI of the cerebellum. b, Representative image of recorded Pcp2-cre neurons expressing hM3Dq-mCherry under brightfield and fluorescence microscopy. c–d, Data analysis of action potential firing frequency and membrane potential in Pcp2-mCherry+ neurons post CNO treatment (n = 12 from three different male mice in c and n = 15 from three different mice in d). e–g, 24 h ad libitum food intake and water intake (24-h water intake volume and number of drinking bouts) post i.p. injection of CNO or saline in Pcp2-cre mice stereotaxically injected with Cre-dependent AAV expressing hSyn-DIO-hM3Dq-mCherry in lobes V–VI of cerebellum (n = 7 per group in e and n = 6 per group in f and g). h, Schematic experimental strategy using the Cre-dependent AAV expressing hSyn-DIO-hM4Di-mCherry to inactivate the Purkinje neurons of the Pcp2-cre mice in lobes V–VI of the cerebellum. i–j, 24 h ad libitum food intake and water intake post i.p. injection of CNO or saline in Pcp2-cre mice stereotaxically injected with Cre-dependent AAV expressing hSyn-DIO-hM4Di-mCherry in lobes V–VI of the cerebellum (n = 4 per group). k, Schematic experimental strategy using the Cre-dependent AAV expressing ChR2-EYFP to activate Purkinje neurons of the Pcp2-cre mice. l. Representative image of recorded Pcp2-cre neurons expressing ChR2-EYFP under brightfield and fluorescence microscopy. m,n, Data analysis of action potential firing frequency and membrane potential in Pcp2-ChR2-EYFP+ neurons post blue or yellow light stimulation (n = 8 from two different male mice in m and n = 10 from two different male mice in n). oq, 1 h water drinking and feeding behavior in Pcp2-GFP or Pcp2-ChR2-EYFP mice post yellow light (598 nm, 5 Hz, 3 s on and 3 s off) or blue light (473 nm, 5 Hz, 3 s on and 3 s off) stimulation (n = 5 per group in o and n = 6 per group in p and q). Also see Supplementary Videos 1 and 2. Error bars, s.e.m. *P < 0.05, **P < 0.01, ***P < 0.001 and ****P < 0.0001; by Student’s t-test (cg, i, j and mq). Also see Extended Data Fig. 3 and Source Data for raw values and details of analysis.
Fig. 4 |
Fig. 4 |. Purkinje neuron-specific Ptprd deletion leads to hypodipsia.
a, Body weight of 8-week-old control mice (Pcp2-cre; Ptprd+/+ and Ptprdflox/flox) and mice with Purkinje neuron-specific knockout of Ptprd (Pcp2-cre; Ptprdflox/flox) maintained on ad libitum normal chow diet (Pcp2-cre; Ptprd+/+ n = 14, Ptprdflox/flox n = 12 and Pcp2-cre; Ptprdflox/flox n = 18). b, Cumulative water intake of 8-week-old Pcp2-cre; Ptprd+/+, Ptprdflox/flox and Pcp2-cre; Ptprdflox/flox (KO) male mice on normal chow over 3 days using the Promethion metabolic system (Pcp2-cre; Ptprd+/+ n = 9, Ptprdflox/flox n = 12 and Pcp2-cre; Ptprdflox/flox n = 18). c, 24-h water intake of 12-week-old Pcp2-cre; Ptprd+/+, Ptprdflox/flox and Pcp2-cre; Ptprdflox/flox male mice under conditions of ad libitum access to food and water, 24 h fasting, refeeding post 24 h fast and re-access to water after overnight water withholding (Pcp2-cre; Ptprd+/+ n = 5 per experimental paradigm, Ptprdflox/flox n = 8 per experimental paradigm and Pcp2-cre; Ptprdflox/flox n = 10 per experimental paradigm). df, Cumulative food intake, hourly energy expenditure and respiratory exchange ratio of 8-week-old male Pcp2-cre; Ptprd+/+, Ptprdflox/flox and Pcp2-cre; Ptprdflox/flox mice on normal chow over 3 days using the Promethion metabolic system (Pcp2-cre; Ptprd+/+ n = 10, Ptprdflox/flox n = 11 and Pcp2-cre; Ptprdflox/flox n = 18). g,h, Osmolality and volume of 24 h urine output of 12-week-old Pcp2-cre; Ptprd+/+ and Pcp2-cre; Ptprdflox/flox female mice under fasting conditions with ad libitum access to water (n = 9 per group). i, Plasma osmolality of 12-week-old Pcp2-cre; Ptprd+/+ and Pcp2-cre; Ptprdflox/flox female mice after an overnight fast (n = 9 per group, except n = 8 Pcp2-cre; Ptprdflox/flox). Error bars, s.e.m. *P < 0.05, **P < 0.01, ***P < 0.001 and ****P < 0.0001; by Student’s t-test (g, h and i), by one-way ANOVA followed by Dunnett’s multiple comparisons test (a, c) and ‘effect of genotype’ determined by two-way ANOVA (b, df). Also see Supplementary Fig. 5 for raw data plot and Source Data for raw data values and details of the analysis.
Fig. 5 |
Fig. 5 |. Purkinje-specific Ptprd deletion does not affect motor learning and coordination.
a,b, Cumulative pedestrian and wheel-running activity of 8-week-old Pcp2-cre; Ptprd+/+, Ptprdflox/flox and Pcp2-cre; Ptprdflox/flox male mice on normal chow (Pcp2-cre; Ptprd+/+ n = 10; Ptprdflox/flox n = 12 and Pcp2-cre; Ptprdflox/flox n = 10). c, Time latency on a constant speed rotarod over the course of three trials of 16–20-week-old Pcp2-cre; Ptprd+/+, Ptprdflox/flox and Pcp2-cre; Ptprdflox/flox male mice (Pcp2-cre; Ptprd+/+ n = 11, Ptprdflox/flox n = 12 and Pcp2-cre; Ptprdflox/flox n = 13). de, Forelimb (two paws) and hindlimb (two paws) grip force measurements of 16-week-old Pcp2-cre; Ptprd+/+, Ptprdflox/flox and Pcp2-cre; Ptprdflox/flox male mice (Forelimb grip assay: three trials per mouse; Pcp2-cre; Ptprd+/+ n = 12, Ptprdflox/flox n = 11 and Pcp2-cre; Ptprdflox/flox n = 12; hindlimb grip assay: Pcp2-cre; Ptprd+/+ n = 13, Ptprdflox/flox n = 10 and Pcp2-cre; Ptprdflox/flox n = 13). f, Wire-hanging latency, tested for up to 5 min in 20-week-old Pcp2-cre; Ptprd+/+, Ptprdflox/flox and Pcp2-cre; Ptprdflox/flox male mice. Each data point represents the time taken averaged across two trials for each mouse. Note that a failure rate of zero represents successful wire-hanging latency of a minimum of 3 min out of 5 min for all mice tested (Pcp2-cre; Ptprd+/+ n = 13, Ptprdflox/flox n = 10 and Pcp2-cre; Ptprdflox/flox n = 13). g, The total amount of immobility time (defined as the time during which the animal is hanging passively and motionless) for 20-week-old Pcp2-cre; Ptprd+/+, Ptprdflox/flox and Pcp2-cre; Ptprdflox/flox male mice subjected to tail-hang test (Pcp2-cre; Ptprd+/+ n = 12, Ptprdflox/flox n = 8 and Pcp2-cre; Ptprdflox/flox n = 13). h, Number of trials (number of paw-to-mouth contacts or paw shakes) and time taken to remove the adhesive tape by the 20-week-old Pcp2-cre; Ptprd+/+, Ptprdflox/flox and Pcp2-cre; Ptprdflox/flox male mice. Each data point represents the time taken averaged from adhesive tape removal from the left paw and right paw of each mouse (Pcp2-cre; Ptprd+/+ n = 12, Ptprdflox/flox n = 10 and Pcp2-cre; Ptprdflox/flox n = 13). Note that a failure rate of zero represents the successful completion of the task by all mice tested. i, Time taken by 18-week-old Pcp2-cre; Ptprd+/+, Ptprdflox/flox and Pcp2-cre; Ptprdflox/flox male mice climb vertically up the wire mesh (Pcp2-cre; Ptprd+/+ n = 12, Ptprdflox/flox n = 10 and Pcp2-cre; Ptprdflox/flox n = 11). Note that no foot slips were observed while mice climbed up the wire mesh. j, Time taken (s) and the number of failures (number of falls) by the 16–20-week-old Pcp2-cre; Ptprd+/+, Ptprdflox/flox and Pcp2-cre; Ptprdflox/flox male mice to descend from a vertical pole. Each data point represents the time taken averaged across two trials for each mouse (Pcp2-cre; Ptprd+/+ n = 12, Ptprdflox/flox n = 10 and Pcp2-cre; Ptprdflox/flox n = 12). Note that a full number of zeros represents zero failure rate across the tested genotypes. k, Schematic of ErasmusLadder experimental paradigm showing sessions one and two: ‘training’ during which mice are trained to walk across the ErasmusLadder, a horizontal ladder apparatus with pressure-sensitive stepping rungs (blue, default stepping rungs) and lower rungs that capture missteps (gray rungs). During sessions three to five, mice are challenged with a cerebellum-dependent conditioned learning paradigm in which obstacle rungs are presented (red, unconditioned stimulus (US)) during paired trials preceded by a conditioning stimulus (CS) tone separated by an interstimulus interval (ISI) of 250 ms. ln, Stepping pattern (short steps, long steps and missteps) of Pcp2-cre; Ptprdflox/flox mice (n = 8) (and Pcp2-cre; Ptprd+/+) male mice (n = 9). o, Cerebellum-dependent motor learning as measured by absolute learning step times on the ErasmusLadder during paired trials in challenge sessions with Pcp2-cre; Ptprdflox/flox mice (n = 8) and Pcp2-cre; Ptprd+/+ male (n = 9) mice. Dashed lines represent pre-perturbation step times. Error bars, s.e.m. *P < 0.05, **P < 0.01, ***P < 0.001 and ****P < 0.0001; repeated measures ANOVA (in ac and lo), one-way ANOVA (in dj). Nonsignificant statistical result (NS) refers to the result of Šídák’s multiple comparisons between groups per session followed by two-way repeated measures ANOVA (in ln) and of mixed-effects analysis followed by Tukey’s multiple comparisons test between groups per session (in o). Also see Supplementary Fig. 6 for individual data plot and Source Data for raw values and details of analysis.
Fig. 6 |
Fig. 6 |. Purkinje neuron-specific Ptprd deletion abolishes water-deprivation-induced Purkinje neuron activation.
a, Representative action potential firing traces of Purkinje neurons from Pcp2-cre; Ptprd+/+ and Pcp2-cre; Ptprdflox/flox male mice subjected to overnight water deprivation. bc, Data analysis of action potential firing frequency and resting membrane potential in Pcp2-Cre+ neurons from Pcp2-cre; Ptprd+/+ and Pcp2-cre; Ptprdflox/flox male mice (three mice per group; n = 5 readings from fed Pcp2-cre; Ptprd+/+ and Pcp2-cre; Ptprdflox/flox males, n = 10 readings from water-deprived Pcp2-cre; Ptprd+/+ and n = 6 readings from water-deprived Pcp2-cre; Ptprdflox/flox males in b and n = 5 readings from fed Pcp2-cre; Ptprd+/+ and Pcp2-cre; Ptprdflox/flox males, n = 14 readings from fed Pcp2-cre; Ptprd+/+, n = 15 readings from fasted Pcp2-cre; Ptprd+/+ and fed Pcp2-cre; Ptprdflox/flox males, n = 17 from water-deprived Pcp2-cre; Ptprdflox/flox males in c). Error bars, s.e.m. *P < 0.05, **P < 0.01, ***P < 0.001 and ****P < 0.0001; by Student’s t-test (in b and c) NS. Also see Source Data for raw data and statistical values.
Fig. 7 |
Fig. 7 |. Asprosin activates Purkinje neurons in vivo, and Purkinje neuronspecific Ptprd deletion renders mice unresponsive to the dipsogenic effects of asprosin.
a, Representative action potential firing traces of Purkinje neurons from Pcp2-cre (control, WT) and Pcp2-cre; Ptprdflox/flox (KO) mice, treated with recombinant asprosin. bc, Data analysis of action potential firing frequency and membrane potential of Purkinje neurons from control (Pcp2-cre) and Pcp2-cre; Ptprdflox/flox (KO) mice, post treatment with recombinant asprosin (n = 15 in b and n = 17 in c; from three different mice each group). d, Representative action potential firing traces of Purkinje neurons from Pcp2-cre (control, WT) and Pcp2-cre; Ptprdflox/flox (KO) mice, treated with norepinephrine (NE). ef, Data analysis of action potential firing frequency and membrane potential of Purkinje neurons from control (Pcp2-cre) and Pcp2-cre; Ptprdflox/flox (KO) mice, post treatment with NE (n = 12 in e and n = 15 in f; from three different mice each group). (g) Schematic experimental strategy using the Cre-dependent AAV expressing hSyn-FLEX-GCaMP7f for optical recording of activated Purkinje neurons of the Pcp2-cre (control) and Pcp2-cre; Ptprdflox/flox (KO) mice subjected to i.c.v. or i.v. injection of GFP or recombinant asprosin. h, Representative image of GCaMP7 expressing Pcp2 neurons in lower magnification ×2 of the coronal section of the cerebellum. ij, GCaMP7 fluorescent response in Pcp2+ neurons from control (Pcp2-cre) and KO (Pcp2-cre; Ptprdflox/flox) mice post i.v. injection of recombinant asprosin or saline vehicle (n = 6 Pcp2-cre; Ptprd+/+ + saline and Pcp2-cre; Ptprd+/+ + asprosin, n = 4 Pcp2-cre; Ptprdflox/flox + saline and Pcp2-cre; Ptprdflox/flox + asprosin). kl, Data analysis of GCaMP7 fluorescent response in Pcp2+ neurons from control (Pcp2-cre) and Pcp2-cre; Ptprdflox/flox mice at every 5-min interval for 30 min, post i.v. injection of saline or asprosin (n = 6 Pcp2-cre; Ptprd+/+ + saline and Pcp2-cre; Ptprd+/+ + asprosin, n = 4 Pcp2-cre; Ptprdflox/flox + saline and Pcp2-cre; Ptprdflox/flox + asprosin). m, GCaMP7 fluorescent response in Pcp2+ neurons from control (Pcp2-cre) and KO (Pcp2-cre;Ptprdflox/flox) mice post i.c.v. injection of GFP or recombinant asprosin (n = 4 Pcp2-cre; Ptprd+/+ + asprosin, n = 5 Pcp2-cre; Ptprd+/+ + GFP and n = 6 Pcp2-cre; Ptprdflox/flox + asprosin). n, Data analysis of GCaMP7 fluorescent response in Pcp2+ neurons from control (Pcp2-cre) and Pcp2-cre; Ptprdflox/flox mice at 0, 5, 10 and 15 min post i.c.v. injection of GFP or asprosin (n = 4 Pcp2-cre; Ptprd+/+ + asprosin, n = 5 Pcp2-cre; Ptprd+/+ + GFP and n = 6 Pcp2-cre; Ptprdflox/flox + asprosin). op, 24-h water drinking and food intake of Pcp2-cre (control, WT) and Pcp2-cre; Ptprdflox/flox mice after i.c.v. injection of GFP or recombinant asprosin (n = 4 per group). Error bars, s.e.m. *P < 0.05, **P < 0.01, ***P < 0.001 and ****P < 0.0001 by Student’s t-test (b, c, e, f, o and p) and two-way ANOVA followed by post hoc Šídák’ tests (k, l and n). Also see Supplementary Fig. 7 for raw data plots and Source Data for raw and statistical values.

References

    1. Zimmerman CA, Leib DE & Knight ZA Neural circuits underlying thirst and fluid homeostasis. Nat. Rev. Neurosci 18, 459–469 (2017). - PMC - PubMed
    1. Leib DE, Zimmerman CA & Knight ZA Thirst. Curr. Biol 26, R1260–R1265 (2016). - PMC - PubMed
    1. Augustine V et al. Temporally and spatially distinct thirst satiation signals. Neuron 103, 242–249.e4 (2019). - PMC - PubMed
    1. Becker CA et al. From thirst to satiety: the anterior mid-cingulate cortex and right posterior insula indicate dynamic changes in incentive value. Front Hum. Neurosci 11, 234 (2017). - PMC - PubMed
    1. Saker P et al. Regional brain responses associated with drinking water during thirst and after its satiation. Proc. Natl Acad. Sci. USA 111, 5379–5384 (2014). - PMC - PubMed

Substances

LinkOut - more resources