. 2024 Jul 10;15(1):5554.
doi: 10.1038/s41467-024-48520-w.

Evidence of thermophilization in Afromontane forests

Affiliations

Evidence of thermophilization in Afromontane forests

Aida Cuni-Sanchez et al. Nat Commun. .

Abstract

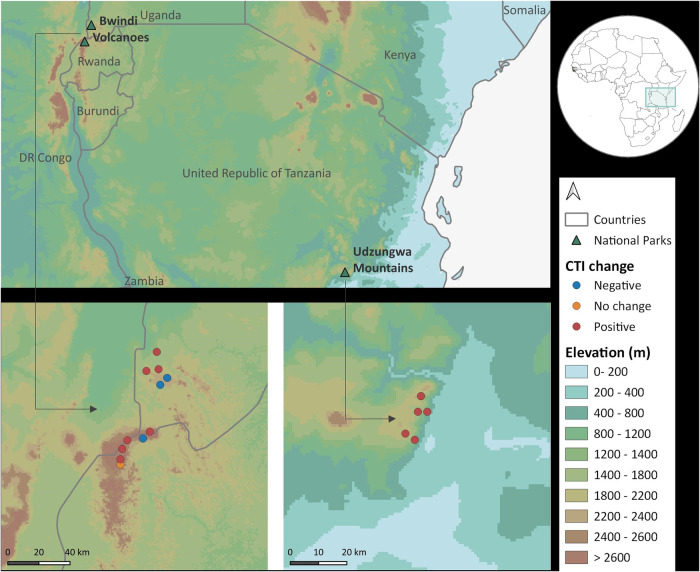
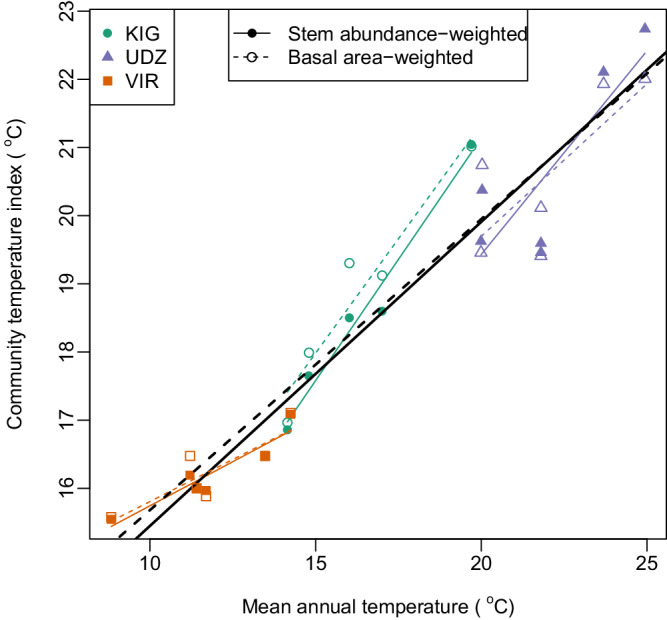
Thermophilization is the directional change in species community composition towards greater relative abundances of species associated with warmer environments. This process is well-documented in temperate and Neotropical plant communities, but it is uncertain whether this phenomenon occurs elsewhere in the tropics. Here we extend the search for thermophilization to equatorial Africa, where lower tree diversity compared to other tropical forest regions and different biogeographic history could affect community responses to climate change. Using re-census data from 17 forest plots in three mountain regions of Africa, we find a consistent pattern of thermophilization in tree communities. Mean rates of thermophilization were +0.0086 °C·y-1 in the Kigezi Highlands (Uganda), +0.0032 °C·y-1 in the Virunga Mountains (Rwanda-Uganda-Democratic Republic of the Congo) and +0.0023 °C·y-1 in the Udzungwa Mountains (Tanzania). Distinct from other forests, both recruitment and mortality were important drivers of thermophilzation in the African plots. The forests studied currently act as a carbon sink, but the consequences of further thermophilization are unclear.


Conflict of interest statement

The authors declare no competing interests.

Figures

Fig. 1
Fig. 1. Location of study plots.
Plots were located in Bwindi Impenetrable National Park (the Kigezi Highlands, Uganda n = 5 plots), the Volcanoes National Park (Virunga Mountains in Rwanda-Uganda, n = 6 plots) and the Udzungwa Mountains National Park (Tanzania, n = 6 plots). CTI community temperature index. Figure created using QGIS version 3.28.15. Elevation data from NASA (https://www.un-spider.org/links-and-resources/data-sources/digital-elevation-model-srtm-1-arc-second-30m-nasa-nga.) Country boundaries from ICPAC, accessed through https://open.africa/dataset/africa-shapefiles.
Fig. 2
Fig. 2. Relationship between community temperature index (CTI) and mean annual temperature.
Coloured lines show regression relationships within each site, and the black line shows the regression relationship across all sites (n = 17 independent sampling plots). Both metrics of community temperature index were positively correlated with mean annual temperature (Spearman’s rank correlation: CTIStem, rs = 0.945, df = 15, P < 0.001, CTIBA, rs = 0.942, df = 15, P < 0.001), KIG Kigezi Highlands in Uganda, VIR Virunga Mountains in Rwanda-Uganda, UDZ Udzungwa Mountains in Tanzania. Source data are provided as a source data file.
Fig. 3
Fig. 3. Change in community temperature index (CTI) between censuses at each plot.
a Change in stem abundance-weighted CTI and b change in basal-area weighted CTI. Changes are expressed relative to values in the first census. KIG Kigezi Highlands in Uganda, VIR Virunga Mountains in Rwanda-Uganda, UDZ Udzungwa Mountains in Tanzania. n = 17 independent sampling plots. Source data are provided as a source data file.
Fig. 4
Fig. 4. Contribution of recruitment, mortality and growth to change in community temperature index (CTI).
a Change in stem abundance weighted CTI. b Change in basal-area weighed CTI. Points show changes for each plot, coloured by site. Black circles show average changes across plots, with error bars indicating 95% confidence intervals of changes (n = 17 independent sampling plots). CTI has been calculated using all species with at least 10 distribution records; see Supplementary Fig. 1 for consequences of using alternative thresholds for including species. Changes in CTI (all) have been decomposed into changes due to recruitment, changes due to mortality and (basal-area weighted only) change due to growth. KIG Kigezi Highlands in Uganda, VIR Virunga Mountains in Rwanda-Uganda, UDZ Udzungwa Mountains in Tanzania. Source data are provided as a source data file.

References

    1. Thuiller W. Climate change and the ecologist. Nature. 2007;448:550–552. doi: 10.1038/448550a. - DOI - PubMed
    1. Steinbauer MJ, et al. Accelerated increase in plant species richness on mountain summits is linked to warming. Nature. 2018;556:231–234. doi: 10.1038/s41586-018-0005-6. - DOI - PubMed
    1. Lenoir J, et al. Species better track climate warming in the oceans than on land. Nat. Ecol. Evol. 2020;4:1044–1059. doi: 10.1038/s41559-020-1198-2. - DOI - PubMed
    1. Chen I, et al. Rapid range shifts of species associated with high levels of climate warming. Science. 2011;333:1024–1026. doi: 10.1126/science.1206432. - DOI - PubMed
    1. De Frenne P, et al. Latitudinal gradients as natural laboratories to infer species’ responses to temperature. J. Ecol. 2013;101:784–795. doi: 10.1111/1365-2745.12074. - DOI

LinkOut - more resources