. 2024 Jul 10;15(1):5808.
doi: 10.1038/s41467-024-50235-x.

Lipid-mediated intracellular delivery of recombinant bioPROTACs for the rapid degradation of undruggable proteins

Affiliations

Lipid-mediated intracellular delivery of recombinant bioPROTACs for the rapid degradation of undruggable proteins

Alexander Chan et al. Nat Commun. .

Abstract

Recently, targeted degradation has emerged as a powerful therapeutic modality. Relying on "event-driven" pharmacology, proteolysis targeting chimeras (PROTACs) can degrade targets and are superior to conventional inhibitors against undruggable proteins. Unfortunately, PROTAC discovery is limited by warhead scarcity and laborious optimization campaigns. To address these shortcomings, analogous protein-based heterobifunctional degraders, known as bioPROTACs, have been developed. Compared to small-molecule PROTACs, bioPROTACs have higher success rates and are subject to fewer design constraints. However, the membrane impermeability of proteins severely restricts bioPROTAC deployment as a generalized therapeutic modality. Here, we present an engineered bioPROTAC template able to complex with cationic and ionizable lipids via electrostatic interactions for cytosolic delivery. When delivered by biocompatible lipid nanoparticles, these modified bioPROTACs can rapidly degrade intracellular proteins, exhibiting near-complete elimination (up to 95% clearance) of targets within hours of treatment. Our bioPROTAC format can degrade proteins localized to various subcellular compartments including the mitochondria, nucleus, cytosol, and membrane. Moreover, substrate specificity can be easily reprogrammed, allowing modular design and targeting of clinically-relevant proteins such as Ras, Jnk, and Erk. In summary, this work introduces an inexpensive, flexible, and scalable platform for efficient intracellular degradation of proteins that may elude chemical inhibition.


Conflict of interest statement

The University of Pennsylvania has filed a provisional patent application US 63/559,150 entitled “Lipid-Mediated Intracellular Delivery of Recombinant bioPROTACs for Rapid Degradation of Undruggable Proteins”, with Dr. Andrew Tsourkas and Alex Chan listed as inventors. The provisional patent covers the composition of the bioPROTAC and LNP described in this manuscript and uses thereof. The University of Pennsylvania has also filed patent application W02021077066A1 entitled “Lipid and lipid nanoparticle formulation for drug delivery”, which was published on 04-22-2021, with Dr. Michael Mitchell listed as an inventor. This patent describes several of the lipids and lipid nanoparticle compositions utilized in this manuscript, namely B6, C1, C14-2, C14-4, and C14-7. The remaining authors declare no competing interest.

Figures
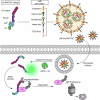
Fig. 1
Fig. 1. Outline of lipid-mediated exogenous bioPROTAC delivery system.
Purified bioPROTACs include an E3 ligase, binding domain, ApP, and GFP s11 tag. The fusion proteins are formulated as LNPs including ionizable/cationic lipids, neutral helper lipids, and lipid-anchored PEG. LNP:bioPROTAC can be delivered intracellularly, and upon endosomal escape, bind to and degrade target proteins. Cytosolic protein delivery is verified by s11 complementation with GFP(1-10) expressed in reporter cell lines.
Fig. 2
Fig. 2. Screening of E3 domains for bioPROTAC development.
A Protein designs for GFP-directed degradation. B Experimental design of co-transfection assays in 293T cells. 3G124 can bind to GFP-KRAS via the GFP handle and polyubiquitinate the target, marking it for proteasomal destruction. CH Flow cytometry results of 293T cells 48 h after co-transfection with degrader- and target-encoding plasmids. Data are normalized geometric mean fluorescence intensity. No degradation was observed with the binder control (3G124) or CHIP-3G124. Both SKP2 and SOCS2 induced modest dose-dependent degradation. SPOP and IpaH9.8 transfection resulted in a dramatic reduction of target fluorescence. I Western blot analysis of 293T lysates following co-transfection of 2.0 µg degraders (except IpaH9.8) and 0.5 µg of GFP-KRAS. This experiment was performed twice with similar results. J Western blot analysis of 293T lysates following co-transfection of 0.5 µg GFP-KRAS and varying amounts of IpaH9.8-3G124. This experiment was performed twice with similar results. Source data are provided as a Source Data file.
Fig. 3
Fig. 3. Identification of lead E3 for bioPROTAC development.
A Either IpaH9.8 or SPOP was cloned at the N-terminus of Ras-binding K27 B Proposed mechanism of GFP-KRAS degradation via binding of the KRAS handle. C Representative flow cytometry histograms 24 h after co-transfection of the indicated bioPROTAC and GFP-KRAS. Either 2.0 µg of SPOP-K27/K27n3 plasmid or 0.25 µg of IpaH9.8-K27/K27n3 plasmid were co-transfected along with 0.5 µg of GFP-KRAS plasmid. D Normalization and quantitation of C. Data are mean ± SD of n = 3 biological replicates. A one-sample, two-tailed t test was performed. **p = 0.0029, ***p = 0.0003. E Design of full bioPROTAC and negative controls. F Schematic of purified protein transfection using cationic Lipofectamine 2000. G Flow cytometry histograms of 293T GFP-KRAS cells 8 h after Lipofectamine transfection with either purified IpaH9.8-K27 or purified SPOP-K27 bioPROTACs. Source data are provided as a Source Data file.
Fig. 4
Fig. 4. Characterization of IpaH9.8-based bioPROTAC delivery and degradation with Lipofectamine transfection.
A Degradation efficiency of IpaH9.8-K27-D25-s11 bioPROTAC and various controls either complexed with Lipofectamine (red bars) or incubated as naked proteins (blue bars). Experiments were performed using 293T GFP-KRAS cells, and delivery was performed for 8 h. B Flow cytometry analysis of 293T GFP(1–10) cells for GFP-positive population following treatment with the same conditions as A. The dotted line represents the 1% threshold used to gate GFP-positive cells. C Fold-change in MFI of 293T GFP(1–10) cells quantified by flow cytometry with the same treatment conditions as A. and B. The dotted line represents the baseline GFP levels normalized to 1. D The dose-dependence of degradation efficiency on IpaH9.8-K27-D25-s11 transfection amount. For each protein dose, 2 µL Lipofectamine 2000 was used for complexation, and cells were analyzed 8 h post-delivery. E GFP-positive 293T GFP(1-10) cells following incubation with Lipofectamine:bioPROTAC. F Fold-change MFI of 293T GFP(1-10) cells following incubation with Lipofectamine:bioPROTAC. For each protein dose, 2 µL Lipofectamine 2000 was used for complexation, and cells were analyzed 8 h post-delivery. Data are mean ± SD of n = 3 biological replicates. For A-C, two-way ANOVA was performed followed by multiple comparisons testing. ns p > 0.05, ***p ≤ 0.001, ****p < 0.0001. Source data are provided as a Source Data file.
Fig. 5
Fig. 5. Cytosolic bioPROTAC delivery by LNPs.
A Microfluidic mixing of an aqueous bioPROTAC solution with an ethanol solution of lipids, PEG and cholesterol was used to formulate protein LNPs. B Flow histograms of 293T GFP-KRAS cells treated with bioPROTACs either complexed with Lipofectamine 2000 or formulated as LNPs. C Quantitation of B. D Dose-dependent degradation in 293T GFP-KRAS with K1 LNPs encapsulating either an active bioPROTAC (red data points) or a non-binding control (blue data points). E The acute cytotoxicity of LNPs in 293T cells was determined by an LDH assay following treatment with the K1 formulation. F GFP-positive 293T GFP(1-10) cells following treatment with K1:bioPROTAC. G Fold-change MFI of 293T GFP(1-10) cells following treatment with K1:bioPROTAC. H Representative western blots of 293T lysates after cells were treated with either bioPROTAC protein only or LNPs encapsulating Ras binders, Ras degraders (bioPROTAC), or control (bioPROTAC null). I Quantitation of western blot degradation by band densitometry normalized to an untreated control (dotted line). For all delivery experiments, cells were incubated with proteins or LNPs for 8 h prior to analysis. Data for (D, F, G) are mean ± SD of n = 3 technical replicates. Data for (E) are mean of n = 4 technical replicates. Data for I are mean ± SD of n = 4 biological replicates. For (I), one-way ANOVA followed by multiple comparisons was performed. *p = 0.0254, **p = 0.0039, ****p < 0.0001. Source data are provided as a Source Data file.
Fig. 6
Fig. 6. Degradation kinetics of K1 formulation of IpaH9.8-based bioPROTACs.
A Dual reporting 293T GFP-KRAS/iRFP-CaaX cells were left untreated and monitored for 12 h by fluorescence microscopy. B Representative fluorescent images of reporter cells treated with the K1 LNP formulation with bioPROTAC protein (200 nM) as cargo. C Representative fluorescent images of reporter cells treated with an LNP formulation of bioPROTAC-encoding mRNA (325 ng/mL). D Fluorescence intensity of individual cells from (A). E Fluorescence intensity of individual cells from (B). F Fluorescence intensity of individual cells from (C). Between 400-500 single cells were analyzed at each time point over the 12-h treatment window, and the mean is represented. G The duration of bioPROTAC-mediated degradation was determined by flow cytometry. Low dose = 50 nM protein, 100 ng/mL mRNA. High dose = 100 nM protein, 200 ng/mL mRNA. Scale bar applies to all microscopy images in (AC) and is equal to 20 µm. Source data are provided as a Source Data file.
Fig. 7
Fig. 7. Global profiling of 293T proteome following Ras bioPROTAC treatment.
Volcano plots display proteins identified from tandem mass spectrometry following 8-h treatment with either A K1-delivered Ras bioPROTACprotein, B LNP-delivered bioPROTACmRNA, or C K1-delivered null bioPROTACprotein. Upregulated and downregulated proteins are indicated as red and blue data points respectively. Both NRAS and KRAS were identified in all conditions and highlighted in volcano plots. Abundance ratio p-values were obtained by one-way ANOVA adjusted using the Benjamini-Hochberg method. D Venn diagram quantifying downregulated proteins from all treatment groups. The 8 downregulated proteins shared between both active bioPROTAC (protein and mRNA delivery) groups are shown. E GO biological process enrichment analysis was performed on downregulated proteins unique to mRNA treatment, and the top 10 terms by adjusted p-value, as determined using the Benjamini-Hochberg method, were returned. F The log2fc for all GTPases/GTPase-associated proteins identified as significantly downregulated in either mRNA or protein bioPROTAC treatment are plotted. Proteins were classified based on homology to Ras-family GTPases. The dotted line marks the log2fc cutoff -1, used for identification of differentially downregulated proteins. For all treatment groups, n = 1. Log2 fold-change ratios were calculated against an untreated control group.
Fig. 8
Fig. 8. LNP-delivered bioPROTACs are modular and widely-active.
A Schematic for “plug-and-play” design of final bioPROTAC format. B Four DARPins targeting three different proteins were cloned into the bioPROTAC template, purified from E. coli cultures, and analyzed by SDS-PAGE. C Western blot analysis reveals degradation of endogenous Jnk by K1:J1/2_2_25 bioPROTAC in 293T and degradation of Erk by K1:EpE89 bioPROTAC. No effect on Bcl-xL was observed following incubation with K1:012_F12 bioPROTAC. This experiment was performed once. D The anti-GFP bioPROTAC IpaH9.8-3G124-D25-s11 was formulated as K1 LNPs and delivered to HeLa cells stably expressing GFP-fusion proteins localized to the mitochondria, cytosol, and nucleus. Degradation was analyzed by fluorescence microscopy following treatment with 100 nM protein for 8 h. This experiment was performed once. E Flow cytometric analysis was performed on HeLa and U2OS cells expressing various GFP-fusion proteins following treatment with 100 nM GFP bioPROTAC (K1 LNP, orange trace). To demonstrate target specificity, Ras-targeting bioPROTACs were included as a control (red trace). Scale bar applies to all microscopy images in D and is equal to 50 µm. Source data are provided as a Source Data file.
Fig. 9
Fig. 9. Inhibiting proliferation of Ras-dependent pancreatic cancer cells.
AD Ras and pErk band densitometry results from MIA PaCa-2 lysates following treatment with K1:IpaH9.8-K27-D25-s11 protein (A), K1:IpaH9.8-K27n3-D25-s11 protein (B), K1:IpaH9.8C337A-K27-D25-s11 protein (C), or K1:IpaH9.8C337A-K27n3-D25-s11 protein (D). E Cell proliferation was assayed with the xCELLigence real-time cell analysis (RTCA) system, and normalized growth was calculated at 24 h post-treatment with bioPROTAC proteins formulated as K1 LNPs (56 nM dose). Data are the mean ± SD of either n = 4 (IpaH9.8C337A variants) or n = 7 (IpaH9.8 WT controls) biological replicates. F Ras and pErk band densitometry results from MIA PaCa-2 lysates following treatment with C12-200:mRNA encoding the IpaH9.8-K27 bioPROTAC. G MIA PaCa-2 cells were treated with C12-200 LNPs encapsulating bioPROTAC mRNA, proliferation was assessed by xCELLigence RTCA, and the 24-h growth was calculated. All data were normalized to untreated controls. Band densitometry was performed at 8 h post-treatment, and n = 1 biological replicate for each data point. A two-way ANOVA test was performed followed by multiple comparisons testing. **p ≤ 0.01, ***p ≤ 0.001. For (G), the experiment was performed twice, and the two biological replicates are shown. Source data are provided as a Source Data file.

References

    1. Russ AP, Lampel S. The druggable genome: an update. Drug Discov. Today. 2005;10:1607–1610. doi: 10.1016/S1359-6446(05)03666-4. - DOI - PubMed
    1. Finan C, et al. The druggable genome and support for target identification and validation in drug development. Sci. Transl. Med. 2017;9:eaag1166. doi: 10.1126/scitranslmed.aag1166. - DOI - PMC - PubMed
    1. Hopkins AL, Groom CR. The druggable genome. Nat. Rev. Drug Discov. 2002;1:727–730. doi: 10.1038/nrd892. - DOI - PubMed
    1. Bushweller JH. Targeting transcription factors in cancer—from undruggable to reality. Nat. Rev. Cancer. 2019;19:611–624. doi: 10.1038/s41568-019-0196-7. - DOI - PMC - PubMed
    1. Dang CV, Reddy EP, Shokat KM, Soucek L. Drugging the ‘undruggable’ cancer targets. Nat. Rev. Cancer. 2017;17:502–508. doi: 10.1038/nrc.2017.36. - DOI - PMC - PubMed

LinkOut - more resources