. 2024 Jul 10;15(1):5291.
doi: 10.1038/s41467-024-49189-x.

TSG-6+ cancer-associated fibroblasts modulate myeloid cell responses and impair anti-tumor response to immune checkpoint therapy in pancreatic cancer

Affiliations

TSG-6+ cancer-associated fibroblasts modulate myeloid cell responses and impair anti-tumor response to immune checkpoint therapy in pancreatic cancer

Swetha Anandhan et al. Nat Commun. .

Abstract

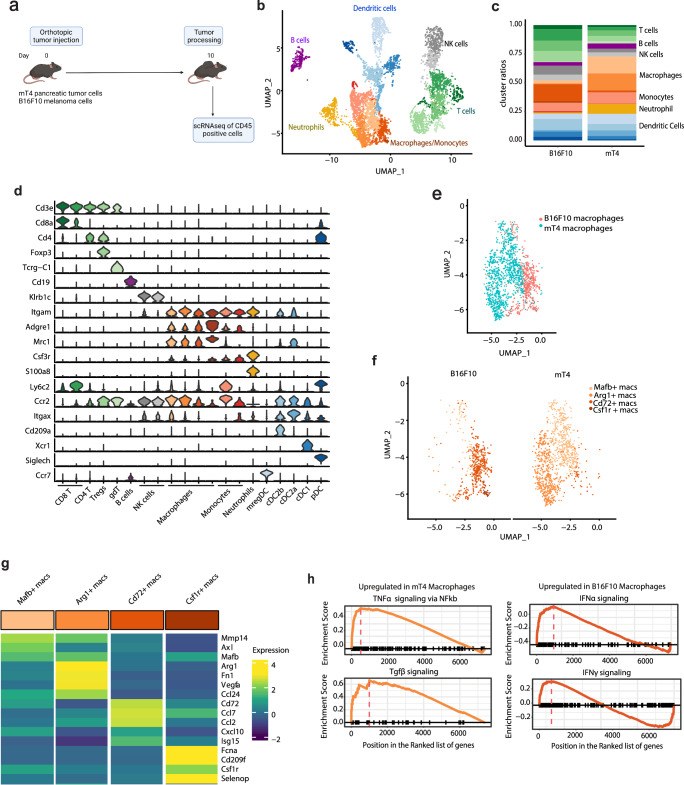
Resistance to immune checkpoint therapy (ICT) presents a growing clinical challenge. The tumor microenvironment (TME) and its components, namely tumor-associated macrophages (TAMs) and cancer-associated fibroblasts (CAFs), play a pivotal role in ICT resistance; however, the underlying mechanisms remain under investigation. In this study, we identify expression of TNF-Stimulated Factor 6 (TSG-6) in ICT-resistant pancreatic tumors, compared to ICT-sensitive melanoma tumors, both in mouse and human. TSG-6 is expressed by CAFs within the TME, where suppressive macrophages expressing Arg1, Mafb, and Mrc1, along with TSG-6 ligand Cd44, predominate. Furthermore, TSG-6 expressing CAFs co-localize with the CD44 expressing macrophages in the TME. TSG-6 inhibition in combination with ICT improves therapy response and survival in pancreatic tumor-bearing mice by reducing macrophages expressing immunosuppressive phenotypes and increasing CD8 T cells. Overall, our findings propose TSG-6 as a therapeutic target to enhance ICT response in non-responsive tumors.


Conflict of interest statement

P.S. reports consulting, advisory roles, and/or stocks/ownership for Achelois, Adaptive Biotechnologies, Affini-T, Apricity Health, BioAlta, BioNTech, Candel Therapeutics, Catalio, Dragonfly Therapeutics, Earli, Enable Medicine, Glympse, Forty-Seven Inc., Hummingbird, ImaginAb, JSL Health, Lava Therapeutics, Lytix Biopharma, Marker Therapeutics, PBM Capital, Phenomic AI, Polaris Pharma, Sporos, Time Bioventures, Trained Therapeutix, Two Bear Capital, and Venn Biosciences, and Polaris. A.M. earns royalties from Cosmos Wisdom Biotechnology, overseen by the UTMDACC Conflict of Interest Committee, and acts as a consultant for both Freenome and Tezcat Biotechnology. The remaining authors declare no competing interests.

Figures

Fig. 1
Fig. 1. TSG-6 gene expression is higher within pancreatic tumors when compared to melanoma tumors.
a Schematic representation of the scRNAseq experimental design created with BioRender.com, released under a Creative Commons Attribution-NonCommercial-NoDerivs 4.0 International license. 3 tumors in each group were pooled for internal control. b Representative Uniform Manifold Approximation Projection (UMAP) plot of sorted intratumoral CD45-negative cells. Each dot represents a cell. c UMAP plots indicating expression of genes depicting B16F10 tumor cells (Pmel, Mlana), mT4 tumor cells (Krt18, Krt19) and fibroblasts (Col1a1, Dcn). d UMAP plots highlighting differences in fibroblast abundance between mT4 and B16F10 tumors (red circle). e UMAP plot depicting tnfaip6 (gene encoding TNF Stimulating Gene-6 (TSG-6)) expression in B16F10 and mT4 tumors (red circle). f Box-and-whisker plot representing TNFAIP6 RNA expression in TCGA datasets of melanoma (skcm, skin cutaneous melanoma) (n = 480 patients) and pancreatic patient tumors (paad, pancreatic adenocarcinoma) (n = 186 patients). Each dot represents a patient. Statistical significance was calculated using Student’s t test (two-tailed) and p value for the comparison has been indicated in the figure. Data are presented as mean values ± SD. The center of the plot represents mean of the group and the whiskers represent minimum- maximum values.
Fig. 2
Fig. 2. TSG-6 expression is induced in cancer setting.
a UMAP plot of tumor and stromal compartment from 24 PDAC patients and 11 normal pancreas reanalyzed from ref. . b UMAP plots indicating distribution of all cells across the two groups (normal pancreas and tumor). Enclosed region in black depicts the fibroblasts present in normal pancreas and tumors. c Violin plot indicating the markers that were used to define the cell subsets in (a). d Expression of TNFAIP6 across all cells present in normal pancreas and tumors. Enclosed region in black depicts the fibroblasts present in normal pancreas and tumors. e Violin plot depicting the quantification of TNFAIP6 expression in cancer-associated fibroblasts (CAFs) and normal fibroblasts. f Representative multi-immunofluorescence (mIF) images demonstrating presence of TSG-6 protein in human pancreatic and melanoma FFPE samples. Zoomed vision of the images are shown on the right and white arrows highlight the TSG-6+ SMA+ cells in the pancreatic TME which are absent in the melanoma tumors. g Bar plot representing quantification of SMA+ cells and (h) TSG-6+ SMA+ cells in pancreatic (n = 9 patients) and melanoma (n = 8 patients) tissues. Data are presented as mean values ± SD. Statistical significance was calculated using Student’s t test (two-tailed) and p values for each comparison has been indicated in the figure. The center of the plot represents mean of the group and the whiskers represent minimum-maximum values. Source data are provided as a Source Data file.
Fig. 3
Fig. 3. Pancreatic tumors are dominated by suppressive myeloid cells.
a Schematic representation of the scRNAseq experimental design created with BioRender.com, released under a Creative Commons Attribution-NonCommercial-NoDerivs 4.0 International license. b Representative landscape in B16F10 and mT4 tumors. Three tumors in each group were pooled for internal control. All major immune cell subsets were identified. c Cluster frequency plot of each immune subset in B16F10 and mT4 tumors. The T cells are depicted in shades of green, B cells in purple, NK cells in gray, macrophages and monocytes in red, neutrophil in orange, and dendritic cells in blue. d Violin plot representing expression of marker genes used for characterization of immune subsets identified in (b). e UMAP plots depicting total macrophages in B16F10 tumors (red) and mT4 (blue) to highlight minimal overlap between subsets. Each dot represents a cell. f Distribution of the macrophages across the B16F10 and mT4 tumors depicted in (e). g Heatmap of functional markers for the individual macrophage subsets providing phenotypic information. Expression levels are scaled between minimum and maximum expression for each gene across all clusters. h GSEA results depicting differential pathways between mT4 and B16F10 macrophages.
Fig. 4
Fig. 4. TSG-6 expressing cancer-associated fibroblasts co-localize with CD44+ macrophages in pancreatic tumors.
a Expression of Cd44 across macrophages present in B16F10 and mT4 tumors. b Violin plot quantifying Cd44 expression in macrophages present in B16F10 and mT4 tumors. c Representative multi-immunofluorescence (mIF) image highlighting co-localization of CD68+ CD44+ CD163+ myeloid cells with TSG-6 (white arrow) in human pancreatic tissue FFPE samples. d Quantification of the mIF images using infiltration analysis technique. Red borders indicate TSG-6+ cells and areas from red to green indicate the increasing distance from the TSG-6+ cells (green being furthest). Percentage of CD68+ CD44+ cells that were at a distance of 0–20 μm (closest) from TSG6+ cells were quantified, and bar plotted (n = 14 pancreatic tissues; patient characteristics provided in Supplementary Table 1). e Quantification of number of CD68+ CD44+ cells that were at a distance of 0–20 μm (closest) from TSG-6+ SMA+ versus TSG-6+ SMA- cells (n = 10 pancreatic tissues; patient characteristics provided in Supplementary Table 1). Each symbol represents a patient. Statistical significance was calculated using Student’s t test (two-tailed). Data are presented as mean values ± SD and p values for each comparison has been indicated in the figure. Source data are provided as a Source Data file.
Fig. 5
Fig. 5. Inhibition of TSG-6 improves ICT efficacy in mice.
a Representation of experimental design for the in vivo antibody blocking studies performed, created with BioRender.com, released under a Creative Commons Attribution-NonCommercial-NoDerivs 4.0 International license. b Kaplan-Meier survival plot indicating therapeutic activity of anti-TSG-6, anti-CTLA-4 and anti-PD-1 in pancreatic tumor-bearing mice. Data cumulative of three independent experiments (n = 43 mice in untreated group, n = 23 mice in combo ICT treated group, n = 21 mice in anti-TSG-6 treated group, n = 19 mice in anti-TSG-6+ combo ICT treated group). Statistical significance was calculated using Log-rank Mantel-Cox test (two-sided). c UMAP representation of intratumoral immune cells identified upon CyTOF analysis. d Heatmap indicating expression of proteins analyzed in the CyTOF experiment and phenotypic characterization of each cluster identified and represented in (c). Expression levels are scaled between minimum and maximum expression for each protein across all clusters. e Box-and-whisker plots depicting relative frequencies of indicated immune cell clusters as a proportion of total CD45+ cells (n = 5 mice in each group). Data representative of two independent experiments. Comparative statistical analyses were performed using one-way ANOVA and post hoc analysis was performed using Tukey’s multiple comparisons test. Data are presented as mean values ± SD. The center of the plot represents mean of the group and the whiskers represent minimum- maximum values. p values for the comparisons have been indicated in the figure. p values not indicated in the plot were not statistically significant. Source data are provided as a Source Data file.
Fig. 6
Fig. 6. Graphical summary describing the role of TSG-6 in ICT resistance.
Created with BioRender.com, released under a Creative Commons Attribution-NonCommercial-NoDerivs 4.0 International license.

References

    1. Wolchok JD, et al. Long-term outcomes with nivolumab plus ipilimumab or nivolumab alone versus ipilimumab in patients with advanced melanoma. J. Clin. Oncol. 2022;40:127–137. doi: 10.1200/JCO.21.02229. - DOI - PMC - PubMed
    1. O’Reilly EM, et al. Durvalumab with or without tremelimumab for patients with metastatic pancreatic ductal adenocarcinoma: a phase 2 randomized clinical trial. JAMA Oncol. 2019;5:1431–1438. doi: 10.1001/jamaoncol.2019.1588. - DOI - PMC - PubMed
    1. Bian J, Almhanna K. Pancreatic cancer and immune checkpoint inhibitors-still a long way to go. Transl. Gastroenterol. Hepatol. 2021;6:6. doi: 10.21037/tgh.2020.04.03. - DOI - PMC - PubMed
    1. Duan Q, Zhang H, Zheng J, Zhang L. Turning cold into hot: firing up the tumor microenvironment. Trends Cancer. 2020;6:605–618. doi: 10.1016/j.trecan.2020.02.022. - DOI - PubMed
    1. Mantovani A, Marchesi F, Malesci A, Laghi L, Allavena P. Tumour-associated macrophages as treatment targets in oncology. Nat. Rev. Clin. Oncol. 2017;14:399–416. doi: 10.1038/nrclinonc.2016.217. - DOI - PMC - PubMed

MeSH terms

Substances

LinkOut - more resources