. 2024 Aug;632(8024):357-365.
doi: 10.1038/s41586-024-07634-3. Epub 2024 Jul 10.

A maternal brain hormone that builds bone

Affiliations

A maternal brain hormone that builds bone

Muriel E Babey et al. Nature. 2024 Aug.

Abstract

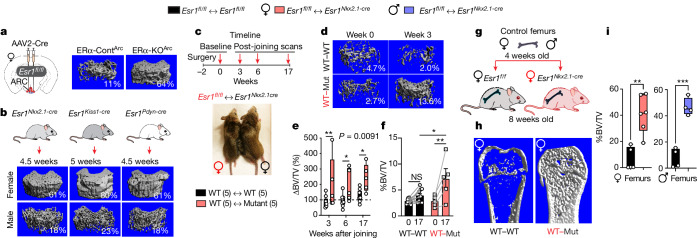
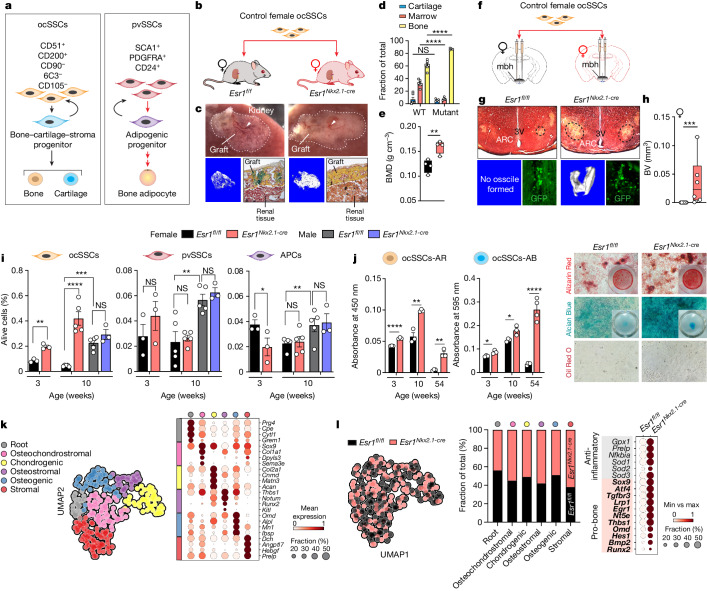
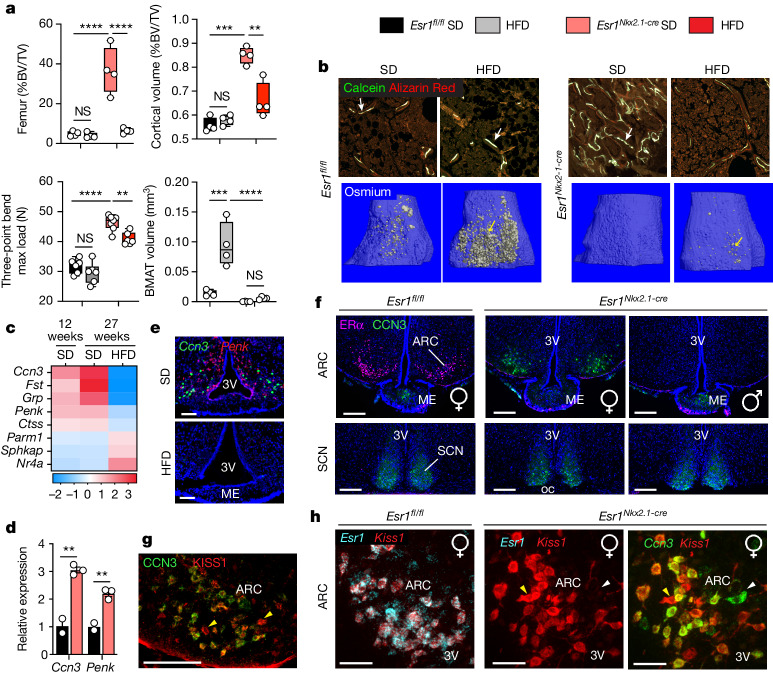
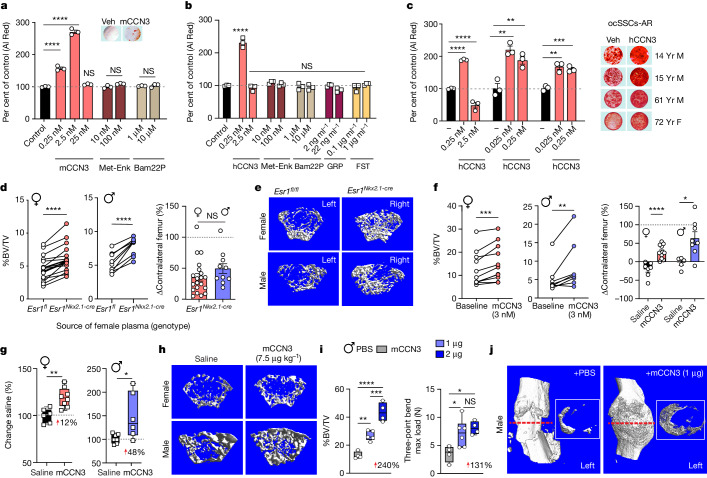
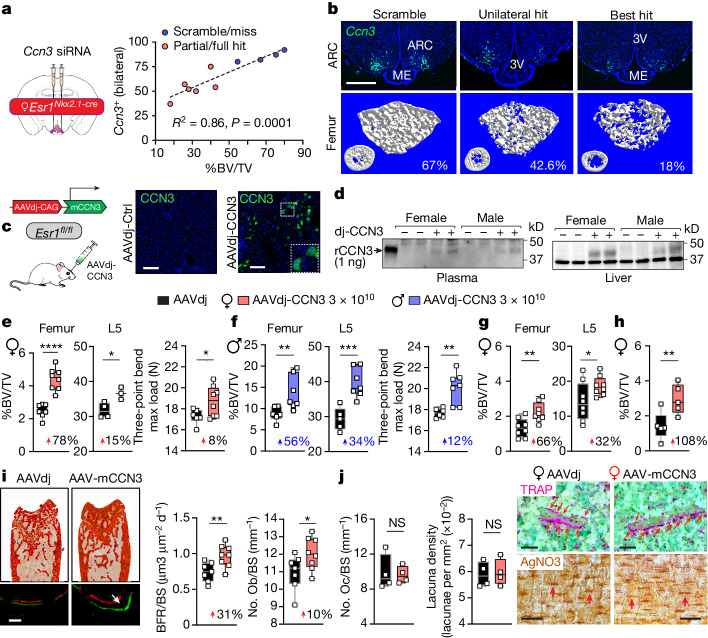
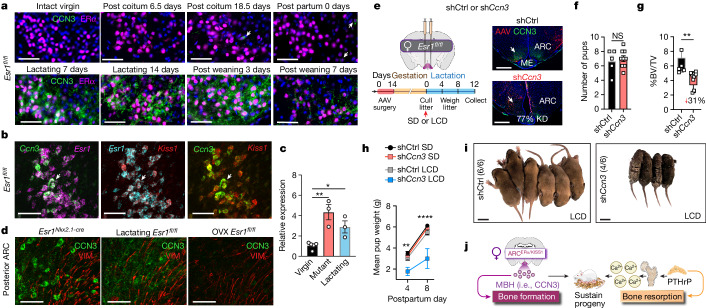
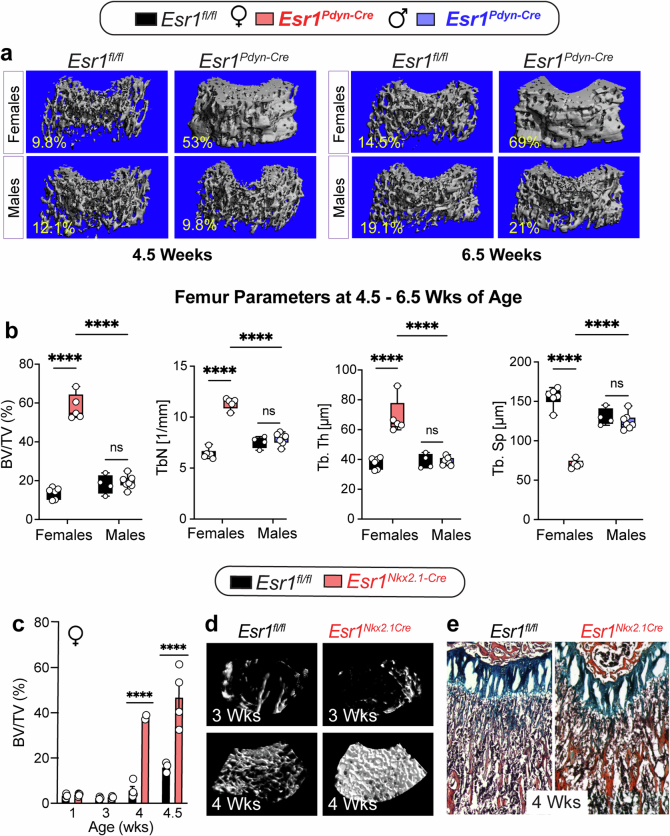
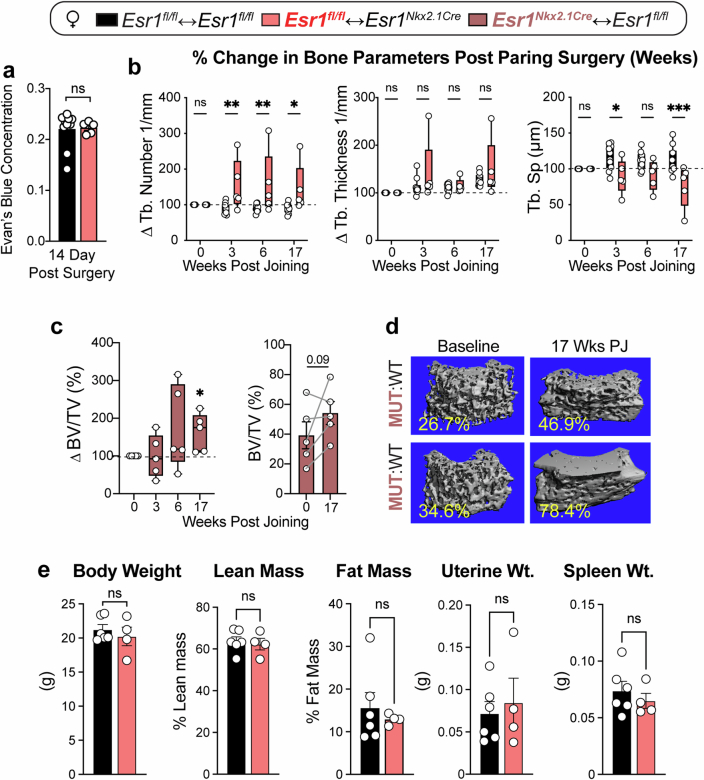
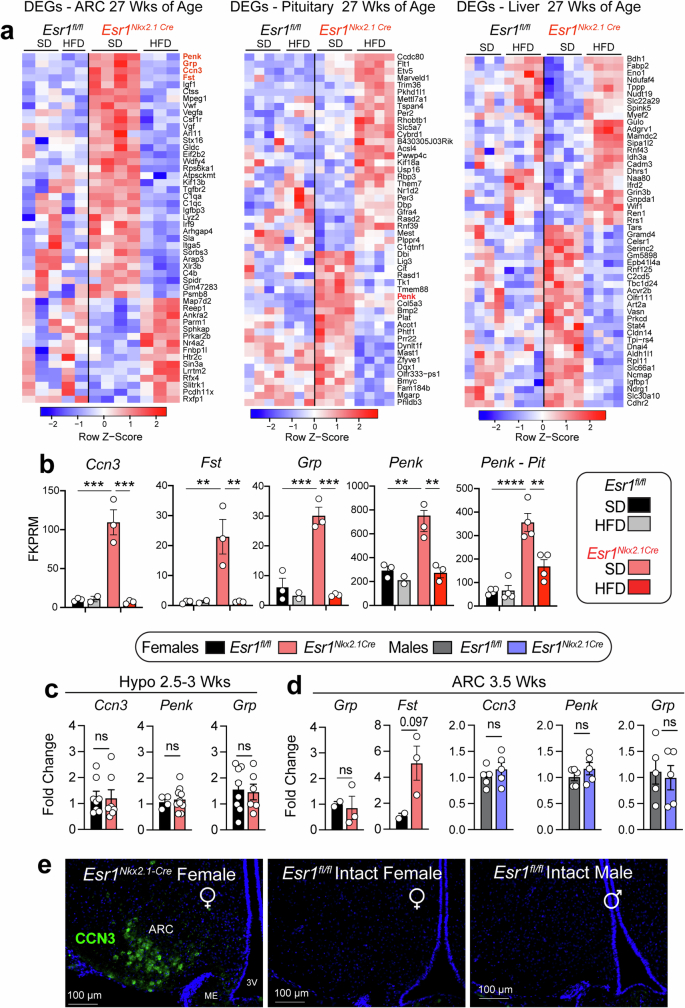
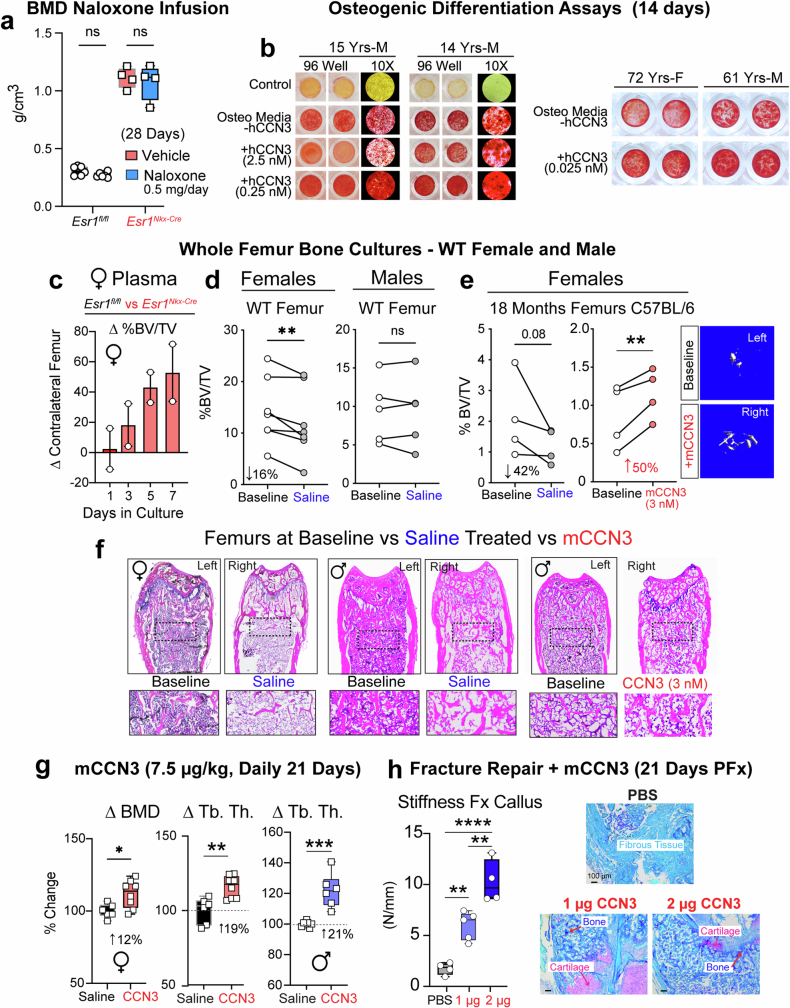
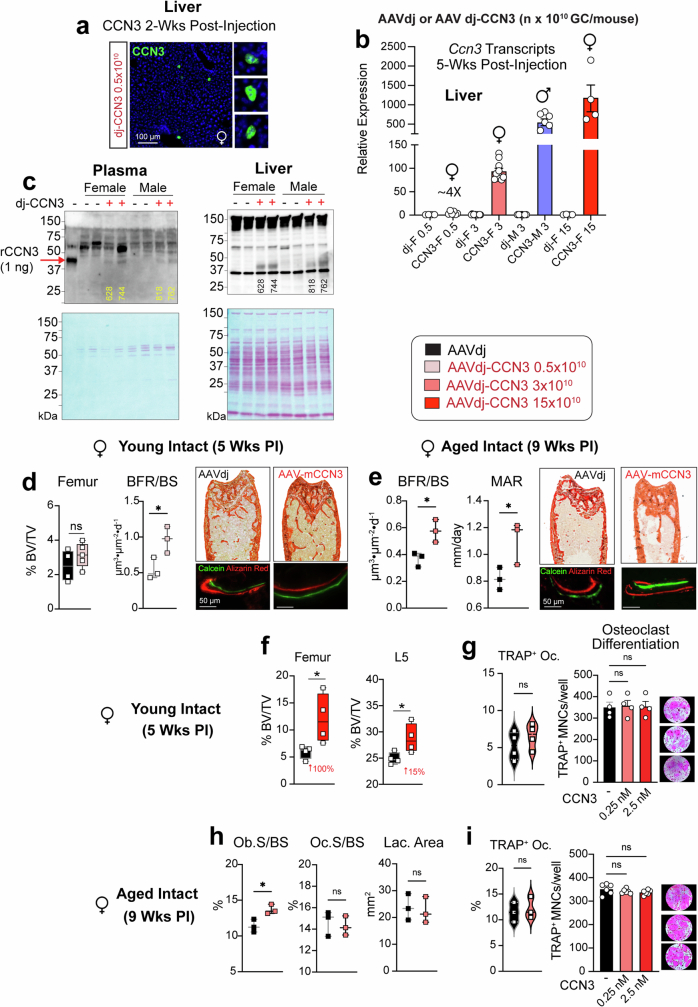
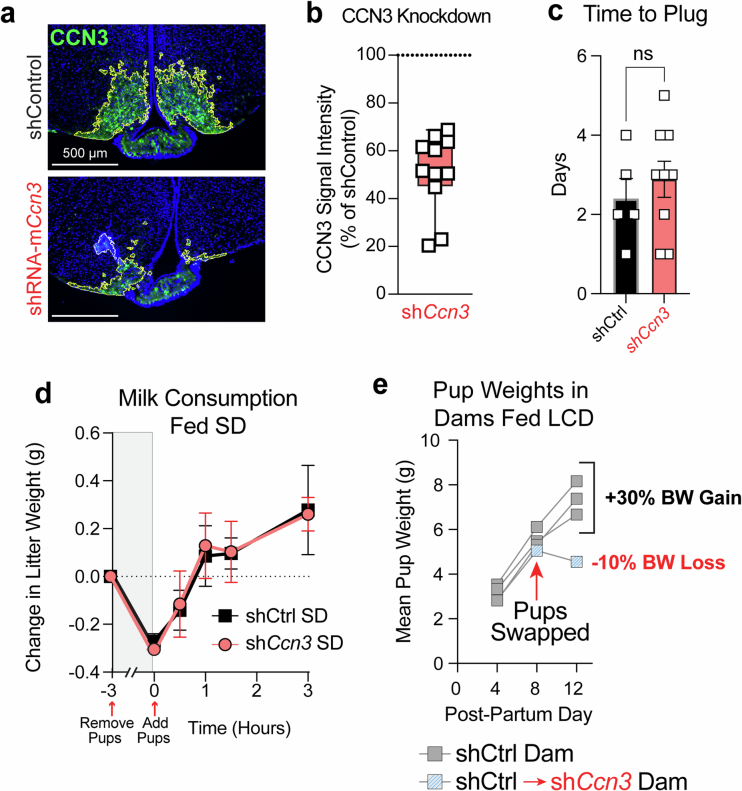
In lactating mothers, the high calcium (Ca2+) demand for milk production triggers significant bone loss1. Although oestrogen normally counteracts excessive bone resorption by promoting bone formation, this sex steroid drops precipitously during this postpartum period. Here we report that brain-derived cellular communication network factor 3 (CCN3) secreted from KISS1 neurons of the arcuate nucleus (ARCKISS1) fills this void and functions as a potent osteoanabolic factor to build bone in lactating females. We began by showing that our previously reported female-specific, dense bone phenotype2 originates from a humoral factor that promotes bone mass and acts on skeletal stem cells to increase their frequency and osteochondrogenic potential. This circulatory factor was then identified as CCN3, a brain-derived hormone from ARCKISS1 neurons that is able to stimulate mouse and human skeletal stem cell activity, increase bone remodelling and accelerate fracture repair in young and old mice of both sexes. The role of CCN3 in normal female physiology was revealed after detecting a burst of CCN3 expression in ARCKISS1 neurons coincident with lactation. After reducing CCN3 in ARCKISS1 neurons, lactating mothers lost bone and failed to sustain their progeny when challenged with a low-calcium diet. Our findings establish CCN3 as a potentially new therapeutic osteoanabolic hormone for both sexes and define a new maternal brain hormone for ensuring species survival in mammals.


Conflict of interest statement

The authors declare no competing interests.

Figures

Fig. 1
Fig. 1. A brain-dependent circulatory factor builds bones in mice.
a,b, Viral and genetic mouse models. a, Left, schematic of the stereotaxic deletion of ERα in the ARC using an AAV2-Cre vector. Right, representative µCT scans of the distal femur from females injected with AAV2 control virus (ERα-ContARC) and of a ERα-knockoutARC (ERα-KOARC) female, as previously reported. %BV/TV values are indicated. b, µCT images obtained from Esr1Nkx2.1-cre, Esr1Kiss-cre and Esr1Prodynorphin-cre (Esr1Pdyn-cre) 4.5–5-week-old mice with %BV/TV values indicated in the lower right-hand corner. cf, Parabiosis models. c, Timeline of in vivo µCT imaging after surgical pairing of Esr1fl/fl (WT) and Esr1Nkx2.1-cre (mutant) female mice. d, Representative in vivo µCT imaging of distal femurs at baseline (week 0) and 3 weeks later (week 3) with %BV/TV values indicated. e, Per cent change in %BV/TV at weeks 3, 6 and 17 compared with week 0 (biological sample sizes used (N) = 5). f, Absolute %BV/TV values for Esr1fl/fl females in WT–WT and WT–Mut pairs, showing values for each animal at baseline (0) and 17 weeks later (17). gi, Bone transplants. g, Schematic of WT female and male femur transplants into Esr1fl/fl (WT) and Esr1Nkx2.1-cre (mutant) female mice for a duration of 6 weeks. h, Representative µCT images of control femurs transplanted WT–WT and WT–Mut females. i, Fractional BV (%BV/TV) of excised control femurs transplanted into Esr1fl/fl females (black bars) or female (red bar) or male (blue bar) bones transplanted into Esr1Nkx2.1-cre females (N = 4–6). Two-way analysis of variance (ANOVA) in e with repeated measures (Šidák’s multiple-comparisons test). One-way ANOVA in f (Tukey’s multiple-comparisons test). Unpaired Student’s t-test, two-tailed in i. *P < 0.05, **P < 0.01, ***P < 0.001, NS, not significant. Error bars ± s.e.m. Graphic in b was adapted from BioRender (https://www.biorender.com). Graphic in g was adapted from Mind the Graph (https://mindthegraph.com) under a Creative Commons licence CC BY-SA 4.0. Source Data
Fig. 2
Fig. 2. A brain-dependent circulatory factor increases the osteogenic capacity of ocSSCs.
a, Schematic of fluorescence-activated cell sorting (FACS) isolation from non-haematopoietic, non-endothelial cell fraction and the fate of ocSSCs (left) and pvSSCs (right). be, SSC kidney capsule transplants. b, Schematic of WT female ocSSC kidney capsule transplants into Esr1fl/fl and Esr1Nkx2.1-cre females. c, Representative images of the graft region with host-derived haematopoiesis (top, white arrowheads), BV and Movat’s pentachrome staining of bone (yellow), cartilage (blue) and marrow (red). d,e, Fractional areas from stained kidney graft sections (N = 6, 5) (d) and bone mineral density (BMD) from grafts by µCT (N = 4, 4; Esr1fl/fl (black) and Esr1Nkx2.1-cre (red) females) (e). fh, SSC transplants into the medial basal hypothalamus (mbh). f, Schematic of stereotaxic bilateral delivery of control ocSSCs (about 550 live cells) from Esr1fl/fl-CAG-Luc-GFP into the mbh of Esr1fl/fl and Esr1Nkx2.1-cre females (N = 7, 6). g, Representative images of pentachrome-stained brain sections (top) with ossicles (lower left) and anti-GFP (lower right) 6 weeks after injection. 3V, third ventricle. h, BV in the mbh of Esr1fl/fl (black) and Esr1Nkx2.1-cre (red) females. i, Per cent ocSSCs, pvSSCs and APCs (Methods) in femurs of Esr1fl/fl and Esr1Nkx2.1-cre 3-week-old (N = 3, 3) and 10-week-old females (N = 5, 5) and males (N = 5, 3). j, Quantification (left) of Alizarin Red (AR; osteogenesis) or Alcian Blue (AB; chondrogenesis) staining of differentiated ocSSCs from 3-week-old, 10-week-old and 54-week-old females with representative images (right) including Oil Red O (adipogenesis) staining (technical replicates in cell culture assays (n) = 3–4 per group). k, Uniform manifold approximation and projection (UMAP) plot (Leiden clustering) of Smart-Seq2 scRNA-seq data of high-quality filtered single ocSSCs from 7-week-old females (left) with dot plot of cluster-specific markers (right). l, UMAP (left), distribution of genotypes within cluster populations (middle) and dot plot of anti-inflammatory and pro-osteogenic markers (right) of Esr1fl/fl and Esr1Nkx2.1-cre ocSSCs. One-way ANOVA in d and i (Tukey’s multiple-comparisons test). Mann–Whitney test, two-tailed in h. Unpaired Student’s t-test, two-tailed for e, i (for the 3-week time point) and j. *P < 0.05, **P < 0.01, ***P < 0.001, ****P < 0.0001. Error bars ± s.e.m. Graphic in b (kidney) was reproduced from BioRender (https://www.biorender.com). Graphic in b (mouse) was adapted from Mind the Graph (https://mindthegraph.com) under a Creative Commons licence CC BY-SA 4.0. Source Data
Fig. 3
Fig. 3. Identification of CCN3 as a brain-derived osteoanabolic factor.
a, Trabecular and cortical fractional BV, mechanical strength (three-point bend) and BMAT levels in long bones of Esr1fl/fl and Esr1Nkx2.1-cre females fed standard diet (SD) or HFD for 17 weeks (N = 4–6 per group). b, Representative images of tibia from female mice (aged 27 weeks) fed SD or HFD for 17 weeks labelled for calcein and Alizarin Red (top, white arrows and magnified from Extended Data Fig. 6c) and osmium stained with lipid droplets (bottom, yellow arrows). c, Heatmap of top DEGs changed in the ARC of Esr1Nkx2.1-cre females at 12 weeks of age (adapted from ref. ) and at 27 weeks of age fed SD or HFD. Scale is log2 fold change. d, Transcript levels of Ccn3 and Penk in the ARC of 3.5-week-old mutant females, measured by quantitative PCR (qPCR). N = 2–3 per group. e, Ccn3 and Penk expression by RNAscope of the ARC in mutant female Esr1Nkx2.1cre mice fed either SD or HFD. Scale bar, 100 µm. ME, median eminence. f, Staining for ERα (pink) and CCN3 (green) in brain sections from posterior ARC and SCN regions of Esr1fl/fl female (10-week-old) and Esr1Nkx2.1-cre female and male (12-week-old) mice. Scale bar, 200 µm. oc, optic chiasm. g, CCN3 and KISS1 overlapping expression in Esr1Nkx2.1-cre female medial basal posterior ARC (yellow arrowheads). Scale bar, 100 µm. h, Ccn3 (green) Esr1 (cyan) and Kiss1 (red) transcripts from posterior ARC brain sections in control and mutant Esr1Nkx2.1-cre females (Kiss1 only, yellow arrowheads; Ccn3 only, white arrowheads). Scale bar, 50 µm. One-way ANOVA in a (Tukey’s and Šidák’s multiple-comparisons test). Unpaired Student’s t-test, two-tailed for d. **P < 0.01, ***P < 0.001, ****P < 0.0001. Error bars ± s.e.m. Source Data
Fig. 4
Fig. 4. CCN3 enhances osteogenesis, bone formation and fracture repair.
ac, Osteogenic differentiation assays (14 days). a, Differentiation of mouse ocSSCs (from 2-week-old male and female mice) treated with mCCN3, met-ENK and Bam22P. Inset, cells stained with Alizarin Red (Al Red) (n = 3). Veh, vehicle. b,c, Human ocSSCs treated with human CCN3 (hCCN3) during in vitro osteogenesis. b, Human ocSSCs from a 14-year-old male treated with hCCN3, met-ENK, Bam22P, gastric-related peptide (GRP) and follistatin (FST). c, Additional ocSCCs from 15-year-old (left), 72-year-old (middle) and 61-year-old (right) patients treated with hCCN3 (red bars) (n = 3), with representative images of wells stained with Alizarin Red to the right of the graph. F, female; M, male. df, Whole femur bone cultures treated with plasma or mCCN3 daily for 5 days. d, Left, %BV/TV for control Esr1fl/fl female (red) and male (blue) 6–8-week-old femurs treated with plasma from Esr1Nkx2.1-cre females; contralateral femurs treated with plasma from Esr1fl/fl mice (N = 19, 10). Right, per cent change in %BV/TV of contralateral female (red bar) or male (blue bar) femurs. e, Representative µCT images from treated femurs. f, Left, %BV/TV control female (N = 11) and male (N = 8) 10–11-week-old femurs treated daily for 5 days with mCCN3 (3 nM) compared with untreated baseline contralateral femur control. Right, per cent change in female (red bar) or male (blue bar) %BV/TV treated with CCN3 or saline normalized to baseline (N = 5–11). g, Per cent change in %BV/TV in Esr1fl/fl mice following daily CCN3 injections (i.p. 7.5 µg kg–1) or saline for 21 days, normalized to mean %BV/TV of saline controls (N = 6, 8 females and 7, 6 males). h, Representative µCT images from treated femurs. i, %BV/TV (left) and mechanical strength of callus (right) 21 days after fracture in aged male mice after slow-release mCCN3 (1 or 2 µg) treatment (phosphate-buffered saline (PBS) N = 4; 1 µg N = 5, 6; and 2 µg N = 4). j, Representative µCT images and cross-sections of callus from 24-month-old C57BL/6 male femurs. One-way ANOVA in ac and i (Dunnett’s (a, b, i) and Tukey’s (c) multiple-comparisons test). Paired Student’s t-test, one-tailed for left panels in d, f, and unpaired Student’s t-test, two-tailed for right panels in d, f and g. *P < 0.05, **P < 0.01, ***P < 0.001, ****P < 0.0001. Error bars ± s.e.m. Source Data
Fig. 5
Fig. 5. Exogenous CCN3 drives higher mass, strength and formation of bone in vivo.
a, Left, schematic of experiment to induce loss-of-function of CCN3 (Ccn3 knockdown) in the ARC in mice. Right, Ccn3-positive neurons in female Esr1Nkx2.1-cre ARC versus %BV/TV after Ccn3 siRNA injections. b, Ccn3 expression in control, unilateral and bilateral hit with corresponding µCT scans of distal femurs. Scale bar, 500 µm (N = 6, 4). c, Left, schematic of experiment to induce gain-of-function CCN3 in the liver. Right, ectopic mCCN3 expression in Esr1fl/fl female hepatocytes following retro-orbital injection of AAVdj-CAG-CCN3 (AAVdj-CCN3) or control (AAVdj-Ctrl) vectors. Inset shows double nuclei. Scale bar, 100 µm. d, mCCN3 immunoblot of heparin–agarose-purified plasma (left) and liver extracts (right, 10 µg total protein) from mice 5 weeks after injection with AAVdj-Ctrl (–) or AAVdj-mCCN3 (+). Recombinant mCCN3 (rCCN3) shown in far left lane. e, %BV/TV (left) of femurs and L5 and mechanical strength (right) of femurs from 3-4-month-old Esr1fl/fl female mice 5 weeks after injection (N = 7, 8 femurs and N = 4, 3 L5). f, %BV/TV (left) of femurs and L5 and mechanical strength (right) of femurs from 3–4-month-old Esr1fl/fl males 5-weeks after injection (N = 6, 7 femurs and N = 5, 7 L5). g, %BV/TV of femurs and L5 in 5-month-old OVX Esr1fl/fl females 9 weeks after injection (N = 8, 8 femurs and N = 8, 8 L5). h, %BV/TV of 20–23-month-old Esr1fl/fl female femurs 9 weeks after injection (N = 5, 5). i, Bone formation rate and bone surface (BFR/BS), and number of osteoblasts per bone surface (No. Ob/BS) determined by histomorphometry (N = 7, 8). Scale bar, 50 µm. j, Number of osteoclasts per bone surface (No. Oc/BS) and lacunar density per bone area as determined by static histomorphometry (N = 4, 4). Representative images of TRAP (top) and silver nitrate (AgNO3, bottom) staining for femoral osteoclasts and lacunae, respectively. Scale bar, 50 µm. Simple linear regression for a. Unpaired Student’s t-test, one-tailed or two-tailed for eg, i and j as indicated in Supplementary Table 3. Mann–Whitney test, one-tailed for h. *P < 0.05, **P < 0.01, ***P < 0.001, ****P < 0.0001. Error bars ± s.e.m. Graphic in c was adapted from BioRender (https://www.biorender.com). Source Data
Fig. 6
Fig. 6. Lactating females require maternal brain CCN3 to sustain progeny.
a, Representative images of coronal brain sections from Esr1fl/fl females stained for ERα (magenta) and CCN3 (green) in the posterior medial basal ARC during pregnancy and postpartum stages (lactation and post weaning) (N ≥ 2 for each time point). Scale bar, 50 µm. b, Colocalization of Ccn3 (green), Kiss1 (red) and Esr1 (magenta and cyan) transcripts in the ARC of a lactating control (Esr1fl/fl) female at 7 days. Scale bar, 50 µm. c, Relative Ccn3 quantified from microdissected ARC tissue obtained from Esr1fl/fl virgin, Esr1Nkx2.1-cre mutant virgin and Esr1fl/fl lactating (7 DPP) female mice (N = 5, 3, 3). d, CCN3 (green) and vimentin (red, VIM) in the posterior ARC of virgin Esr1Nkx2.1-cre mutant and lactating or OVX Esr1fl/fl control mice (1 week after surgery). ei, Ccn3 knockdown (KD) in the ARC of lactating female mice. e, Schematic of injection of shRNA Ccn3 (shCcn3) or shRNA control (shCtrl) vectors into the ARC of control Esr1fl/fl females with experimental timeline (left) and representative images of CCN3 at 12 DPP (right). Scale bar, 500 µm. LCD, low-calcium diet. f,g, Litter sizes (f) and BV of femurs (g) from mothers injected with shCtrl or shCcn3 (N = 5, 9) fed SD (0.8%Ca2+). h, Average pup weight (5–6 pups per litter) nursed by dams injected with shCtrl or shCcn3 and fed SD (N = 5,9) or LCD (0.01% Ca2+, N = 4,2). i, Litters at 8 DPP nursed by dams injected with shCtrl or shCcn3 and fed a LCD, with survival values in parentheses. Scale bar, 1 cm. j, Brain-derived MBH (that is, CCN3) replaces E2 as an osteoanabolic hormone during lactation and counteracts the catabolic actions of mammary-gland PTHrP to promote healthy bone formation, thereby ensuring adequate calcium supplies for milk and maternal skeleton integrity during lactation. One-way ANOVA for c (Šidák’s multiple-comparisons test). Unpaired Student’s t-test, two-tailed for f, and one-tailed for g. Three-way ANOVA for h (Tukey’s multiple-comparisons test). *P < 0.05, **P < 0.01, ****P < 0.0001. Error bars ± s.e.m. Graphics in j (mammary, bone and calcium) were reproduced or adapted from BioRender (https://www.biorender.com). Graphic in j (dam and litter) was reproduced from Mind the Graph (https://mindthegraph.com) under a Creative Commons licence CC BY-SA 4.0. Source Data
Extended Data Fig. 1
Extended Data Fig. 1. Sex-Dependent High Bone Mass in Genetic Models that Target KNDy ARC Neurons Occurs By 4 Weeks of Age.
a, Representative µCT images of female and male distal femurs at 4.5 and 6.5 weeks. b, Box and whisker plots of structural bone parameters of control Esr1fl/fl and mutant Esr1Pdyn-Cre (mutant) females (red) and males (blue); legend on top. c, Time course of high bone mass in Esr1fl/fl (black) or Esr1Nkx2.1-Cre (red) females beginning at 1 week of age, data for the 4.5-week time point are taken from and re-graphed, (N = 4 for all groups except N = 2 for mutant at 4 wks), legend on top. d, µCT imaging of females at 3 and 4 weeks of age. e, Modified Pentachrome staining of sections from control and mutant distal femur 4 weeks of age showing enhanced mineralized bone (red) in the mutant femur. One-Way ANOVA for panel b (Šidák’s multiple-comparisons test). Two-Way ANOVA for panel c, F(1, 21) = 65.63, P < 0.0001. ****p < 0.0001, ns = not significant. Error Bars ± SEM. Source Data
Extended Data Fig. 2
Extended Data Fig. 2. Increases in Trabecular Bone in WT:MUT and MUT:WT Parabiosis Without Weight Changes in Whole Body or Other Tissues.
a, Bar graph of Evan’s Blue concentration in blood injected into Control or Mutant female mice 14 days post-surgery to assess pairing. b, Box and whisker plots of percent changes in structural bone parameters of the Esr1fl/fl distal femur after WT:MUT pairing for the time indicated as determined by in vivo µCT imaging. c, Per cent change (left panel) and fractional bone volume (%BV/TV. right panel) in Esr1Nkx2.1Cre femurs (N = 5) in MUT:WT parabionts, as determined by in vivo µCT scans. d, Representative µCT images of Esr1Nkx2.1Cre distal femur from two different MUT:WT pairings. Legend is shown on top. Unpaired Student T-Test 2-tailed for panel a. e, Body weights and other tissue measurements obtained 17 weeks post-joining after euthanasia (N = 6, 4). Two- and One-Way ANOVA for repeated measures for panels in b and c (left), respectively (Šidák’s multiple-comparisons test). Ratio Paired Student T-Test for panels a, c (right) and e. *p < 0.05, **p < 0.01, ***p < 0.001, ns = not significant. Error Bars ± SEM. Source Data
Extended Data Fig. 3
Extended Data Fig. 3. Higher Bone Mass of Wild-type Femurs Transplanted into Mutant Esr1Nkx2.1-Cre Females.
a, Images of wild-type female bones 6-weeks post-implantation into control or mutant females. b, Box and whisker plots of µCT structural parameters of wild-type female femurs into Esr1fl/fl (black) or Esr1Nkx2.1-Cre (red, N = 5, 6) females 6-weeks post-implantation. c, Box and whisker plots of µCT structural parameters of wild-type male bones into Esr1fl/fl (black) or Esr1Nkx2.1-Cre (blue, N = 4, 4) females 6-weeks post-implantation. Unpaired Student T-Test 2 tailed for panels in b and c. *p < 0.05, **p < 0.01, ***p < 0.001, ns = not significant. Legends to plots on top. Source Data
Extended Data Fig. 4
Extended Data Fig. 4. Increased ocSSCs from Control Bones After Sharing Circulation with Mutant Esr1Nkx2.1-Cre Females, who Exhibit Youthful ocSSCs and Bone Mass.
a, Box and whisker plots of live cells obtained following FACS-purification as described in Methods isolated from control femurs obtained from WT:WT or WT:MUT parabionts (N = 6, 4) or from control female (red, N = 6, 7) or male (blue, N = 4, 4) femurs transplanted into Esr1Nkx2.1-Cre females as indicted by legend on top. b, Bar graphs of CFU-F from ocSSCs purified from control or mutant female long bones at age indicated (N = 3–6). c, Functional in vitro assays of ocSSCs from 54-week-old females in defined media and stained with dye as indicated at the top of representative images of culture wells (n = 3-4 replicates); Crystal Violet (CFU-F), Alizarin Red (osteogenesis), and Alcian Blue (chondrogenesis). d, Fractional bone volume of trabecular and cortical bone as well as other trabecular parameters obtained from µCT scanning of femurs from aged females (≥ 52 weeks of age) of distal and midshaft regions (N = 3, 3). e, Representative images of µCT-scans. Unpaired Student T-Test 2-tailed for panels a-c. *p < 0.05, **p < 0.01, ns = not significant. Error Bars ± SEM. Source Data
Extended Data Fig. 5
Extended Data Fig. 5. ScRNA-Sequencing of Prospectively Isolated Mouse OcSSCs.
a, Heatmap of top fifty upregulated genes per cluster of isolated mouse ocSSCs. b, PAGA pseudo time cell maturation state trajectory inference. c, BioPlanet 2019 pathway enrichment (top three bars) and GO Biological Process 2023 ontology (bottom three bars) displaying overexpression in mutants versus wild type based on top 200 DEGs. Source Data
Extended Data Fig. 6
Extended Data Fig. 6. Dietary Challenge Degrades Bone Only in Mutant Females Without Altering Other Metabolic Parameters.
a, XY plot of body weights versus age for Esr1fl/fl and Esr1Nkx2.1-Cre age-matched female littermates maintained on standard breeder chow (SD) or high-fat diet (HFD) for 17 weeks starting at 10 weeks of age (N ≥ 4 per group). Blood glucose levels after GTT (i.p.), area under the curve (AUC), fat mass by DEXA fed HFD (fed for 12 weeks), and serum triglycerides (fed for 17 weeks) plotted for control and mutant females, legend on top. b, Trabecular and cortical bone parameters obtained after µCT scans for four experimental female cohorts, note that fractional bone volume for cortical bone is regraphed from main Fig. 3a. c, Representative images of sections of TRAP-stained and double-labeled with Calcein green (green) and Alizarin red (red) femurs for Esr1fl/fl and Esr1Nkx2.1-Cre cohorts. d, Dynamic histomorphometry obtained from tibias for four different experimental cohorts: osteoclasts per bone surface (Oc/BS), bone formation rate/bone surface (BFR/BS), and mineralized surface/bone surface (MS/BS), N = 4 per group. e, XY plot of body weights versus age for Esr1fl/fl and Esr1Nkx2.1-Cre age-matched male experimental cohorts, (N = 4 per group). f, Trabecular and cortical bone parameters obtained by µCT imaging for four male experimental cohorts. Legend on top. g, Blood glucose and structural bone parameters obtained by µCT imaging for Esr1fl/fl and Esr1Nkx2.1-Cre female cohorts treated with vehicle (N = 3, 6) or S961 (N = 5, 5) delivered by implanted osmotic pumps at 17.5 nM/week over a period of 8 weeks (N = 5-6 per group). Two-way ANOVA for repeated measures for panels in a and e (BW curve and GTT), respectively (Šidák’s multiple-comparisons test). One-way ANOVA for panels b, d, f, and g (Šidák’s multiple-comparisons test), Unpaired Student’s T-test 2-tailed for three right-hand panels in a. *p < 0.05, **p < 0.01, ***p < 0.001, ***p < 0.0001, ns = not significant. Error Bars ± SEM. Source Data
Extended Data Fig. 7
Extended Data Fig. 7. A Cluster of ARC DEGs Correlates with Changing Bone Mass in Female Esr1Nkx2.1-Cre Mutants.
a, Heatmaps of top 50 DEGs listed to the right following analyses of bulk RNA-Seq datasets of Esr1fl/fl and Esr1Nkx2.1-Cre age-matched female littermates maintained on standard breeder chow (SD) or high-fat diet (HFD) for 17 weeks starting at 10 weeks of age; samples include microdissected ARC (left panel), whole pituitary glands (middle panel) or liver tissue (right panel). The cluster of secreted proteins/peptides for the ARC attenuated by HFD are highlighted in red text. Legend for each heatmap shows relative Z-Scores. b, Normalized reads for candidate genes from the ARC; Penk in pituitary with either SD or HFD (N = 2–4). c, Relative expression of transcripts as listed in the female hypothalamus at 2.5 weeks of age shown in bar graphs with individual points (N = 4–8). d, Relative expression of transcripts in microdissected ARC harvested from control Esr1fl/fl and mutant Esr1Nkx2.1-Cre age-matched females (red) or males (blue), (N = 2–5). e, CCN3 (green) expression in the posterior ARC of mutant female, control virgin female and control intact male. Scale bars = 100 µm. One-Way ANOVA for panel b, Unpaired Student’s T-test 2-tailed for panels c and d, **p < 0.01, ***p < 0.001, ****p < 0.0001, ns = not significant. ns = not significant. Error Bars ± SEM. Abbreviations: ARC arcuate nucleus. ME median eminence. Source Data
Extended Data Fig. 8
Extended Data Fig. 8. CCN3 Increases Osteogenesis in Human ocSSCs and Bone Mass in Vitro, in Vivo and in Fracture Repair.
a, Effects of chronic infusion of Naloxone over 28 days with fractional bone volume plotted for control Esr1fl/fl and mutant Esr1Nkx2.1-Cre age-matched females. The ages of female mice at the beginning of treatment were 10–12 weeks of age, which was delivered via an implanted mini-osmotic pump (0.5 mg/24 hrs) over 28 days. Legend in bar graph (N = 4 per group). b, Representative images of duplicate wells of Alizarin staining in Control media, osteogenic media minus or plus different doses of human CCN3 with magnified images of one well in far-right images of each panel. Representative images of duplicate wells of Alizarin staining in culture wells with osteogenic defined media minus or plus human CCN3. Some images from panels c and d are duplicated from Main Fig. 4a,c. c, Bar plots of change in fractional bone volume from whole femurs harvested from control females and then cultured with isolated plasma from Esr1fl/fl and Esr1Nkx2.1-Cre age-matched female littermates. Plasma (15 µl) was added daily for 1–7 days of culture as described in the Methods Section. d, Plots of fractional bone volume were determined after culturing the right femur (females) or right femur (males) in media treated with 0.9 % NS (Saline). Baseline values were obtained for freshly isolated left femur from the same mouse and immediately fixed in 4% PFA for analysis without culturing (Baseline). e. Plots of fractional bone volume were determined after culturing the right femur from 18-month-old C57BL/6 female mice in media treated with 0.9 % NS (Saline) or 3 nM mCCN3 compared to baseline. f, Representative images of H&E stained sections of the contralateral left and right femurs from the same female and male mouse at Baseline, Saline, or after treatment with mCCN3. g, Box and whiskers plots of bone parameters after saline (black) or mCCN3 (red) daily treatments of control females. h. Stiffness of callus 21 days post-fracture with images from Modified Periodic Acid‐Schiff (PAS) staining shown for callus region. One Way ANOVA for panels a and h (Tukey’s multiple-comparisons test). Paired Student’s T-test 1-tailed for panels d and e. Unpaired Student’s T-test 2-tailed for panel g. *p < 0.05, **p < 0.01, ns = not significant. Error Bars ± SEM. *p < 0.05, ***p < 0.001, ****p < 0.0001, ns = not significant. Error Bars ± SEM. Source Data
Extended Data Fig. 9
Extended Data Fig. 9. Ectopic Hepatic mCCN3 Expression in Control Esr1fl/fl Females Increase Bone Formation Without Affecting Bone Resorption.
a, Expression of mCCN3 protein in female liver transduced with a low dose of AAVdj-CAG-Ccn3 (0.5 * 1010 GC/mouse) 2 weeks post-injection; panels to the right represent digitally magnified images of individual positive cells. Scale bar = 100 µm. b, Relative levels of Ccn3 transcripts in liver tissue 5 weeks post-injection after transduction of 0.5 * 1010, 3 * 1010 and 15 * 1010 GC/mouse of AAVdj-CAG-Ccn3 viral vector and control AAV-empty vector (dj) into Esr1fl/fl male or female littermates, (N = 4–9 per group). c, Western blots of plasma and liver uncropped with Ponceau staining below used in Main Fig. 5d. The relative expression for Ccn3 by qPCR is listed for each sample in lanes. d, Bone volume and dynamic histomorphometry measurements after Calcein and Alizarin red double labeling (5 days apart) of female mice transduced with the lowest dose of AAVdj-CAG-Ccn3 viral vector compared to control vector (black) obtained in femurs from Esr1fl/fl control females. e, Bone formation rate and mineral apposition rate (MAR) from dynamic histomorphometry measurements with representative images of femur sections described above from aged Esr1fl/fl females (20–23 months of age) injected with AAVdj-CAG-CCN3. f, Bone volume of femur and L5 of female mice transduced with highest dose of AAVdj-CAG-Ccn3 viral vector. g, TRAP+ osteocytes (%) in femurs from young females (left). In vitro differentiation of osteoclasts from bone marrow isolated from young intact females treated with vehicle or recombinant CCN3 (right). h, Osteoblast surface (Ob.S), osteoclast surface (Oc.S) per bone surface (BS), and silver nitrate staining for lacunae. i. TRAP+ osteocytes (%) in femurs from aged females (left). In vitro differentiation of isolated osteoclasts from aged intact females treated with vehicle or recombinant CCN3 (right). Unpaired Student’s T test 2-tailed for low and high dose groups in panels e, d, g, h. *p < 0.05. ns = not significant. Error Bars ± SEM. Legend is provided above graphs. Abbreviations: MNCs mononucleated cells. Source Data
Extended Data Fig. 10
Extended Data Fig. 10. Sh-RNA-Mccn3 Knockdown Does Not Impair the Fertility or Milk Provision of Female Mothers, But Limits Pup Growth.
a, Representative images of brain sections and CCN3 staining quantification from dams injected with shControl (upper) or shRNA-mCcn3 (lower) and collected at 12DPP. Yellow border defines area in which CCN3 immunostaining intensity was quantified. Scale bars = 500 µm. b, Percent reduction in ARC CCN3 immunostaining intensity of shRNA-mCcn3 dams fed SD (N = 9) or LCD (N = 2) as compared to shRNA control dams fed SD (N = 5). c, The time interval between mating (day 0) and observation of copulatory plug (Control N = 5, shRNA-mCcn3 N = 9). d, Milk consumption in litters from shCtrl (N = 3) and shCcn3 (N = 9) as measured by weight recovery following 3-hour separation from lactating dams fed SD. e, Mean body weights for litters (N = 4 litters, N = 6 pups/litter) nursed by shCtrl mothers at 4, 8, and 12DPP (grey) or switched to an shCcn3 mother beginning at 8DPP (blue and grey). Unpaired 2-tailed Student’s T-test in panel c. Two-way ANOVA with repeated measures (Holm-Šidák’s multiple-comparisons test) in panel d. Error Bars ± SEM. Source Data

References

    1. Kovacs, C. S. Maternal mineral and bone metabolism during pregnancy, lactation, and post-weaning recovery. Physiol. Rev.96, 449–547 (2016). 10.1152/physrev.00027.2015 - DOI - PubMed
    1. Herber, C. B. et al. Estrogen signaling in arcuate Kiss1 neurons suppresses a sex-dependent female circuit promoting dense strong bones. Nat. Commun.10, 163 (2019). 10.1038/s41467-018-08046-4 - DOI - PMC - PubMed
    1. Ingraham, H. A., Herber, C. B. & Krause, W. C. Running the female power grid across lifespan through brain estrogen signaling. Annu. Rev. Physiol.84, 59–85 (2022). 10.1146/annurev-physiol-061121-035914 - DOI - PMC - PubMed
    1. Khosla, S., Oursler, M. J. & Monroe, D. G. Estrogen and the skeleton. Trends Endocrinol. Metab.23, 576–581 (2012). 10.1016/j.tem.2012.03.008 - DOI - PMC - PubMed
    1. Doolittle, M. L. et al. Skeletal effects of inducible ERα deletion in osteocytes in adult mice. J. Bone Miner. Res.37, 1750–1760 (2022). 10.1002/jbmr.4644 - DOI - PMC - PubMed

MeSH terms