. 2024 Jul;631(8022):857-866.
doi: 10.1038/s41586-024-07627-2. Epub 2024 Jul 10.

Interferon subverts an AHR-JUN axis to promote CXCL13+ T cells in lupus

Collaborators, Affiliations

Interferon subverts an AHR-JUN axis to promote CXCL13+ T cells in lupus

Calvin Law et al. Nature. 2024 Jul.

Erratum in

  • Publisher Correction: Interferon subverts an AHR-JUN axis to promote CXCL13+ T cells in lupus.
    Law C, Wacleche VS, Cao Y, Pillai A, Sowerby J, Hancock B, Horisberger A, Bracero S, Skidanova V, Li Z, Adejoorin I, Dillon E, Benque IJ, Nunez DP, Simmons DP, Keegan J, Chen L, Baker T, Brohawn PZ, Al-Mossawi H, Hao LY, Jones B, Rao N, Qu Y, Alves SE; Accelerating Medicines Partnership: RA/SLE Network; Jonsson AH, Shaw KS, Vleugels RA, Massarotti E, Costenbader KH, Brenner MB, Lederer JA, Hultquist JF, Choi J, Rao DA. Law C, et al. Nature. 2024 Aug;632(8025):E6. doi: 10.1038/s41586-024-07845-8. Nature. 2024. PMID: 39060417 No abstract available.

Abstract

Systemic lupus erythematosus (SLE) is prototypical autoimmune disease driven by pathological T cell-B cell interactions1,2. Expansion of T follicular helper (TFH) and T peripheral helper (TPH) cells, two T cell populations that provide help to B cells, is a prominent feature of SLE3,4. Human TFH and TPH cells characteristically produce high levels of the B cell chemoattractant CXCL13 (refs. 5,6), yet regulation of T cell CXCL13 production and the relationship between CXCL13+ T cells and other T cell states remains unclear. Here, we identify an imbalance in CD4+ T cell phenotypes in patients with SLE, with expansion of PD-1+/ICOS+ CXCL13+ T cells and reduction of CD96hi IL-22+ T cells. Using CRISPR screens, we identify the aryl hydrocarbon receptor (AHR) as a potent negative regulator of CXCL13 production by human CD4+ T cells. Transcriptomic, epigenetic and functional studies demonstrate that AHR coordinates with AP-1 family member JUN to prevent CXCL13+ TPH/TFH cell differentiation and promote an IL-22+ phenotype. Type I interferon, a pathogenic driver of SLE7, opposes AHR and JUN to promote T cell production of CXCL13. These results place CXCL13+ TPH/TFH cells on a polarization axis opposite from T helper 22 (TH22) cells and reveal AHR, JUN and interferon as key regulators of these divergent T cell states.


Figures

Extended Data Figure 1.
Extended Data Figure 1.. Clinical associations of PD-1+/ICOS+ and CD96hi cell clusters.
a, Differentially expressed proteins on memory CD4+ T cells from SLE patients compared to controls. p-values from t-test with Bonferroni correction. b, Heatmap of marker expression on mass cytometry cell clusters (left) and MASC association statistics for each cluster comparing SLE vs controls (right). SLE OR = odds ratio of representation in SLE vs control. CI = confidence interval. Adj. p-value by FDR. c, Correlation plot of PD-1/ICOS+ cluster and CD96hi cluster abundances in SLE patients and controls. Spearman statistics shown. d, Association of indicated cluster proportions with serum anti-dsDNA antibody level in SLE patients (n=19). e, Association of indicated cluster proportions with SLE disease activity by SLEDAI-2K (n=19). f, Association of indicated cluster proportions with prednisone dose or equivalent at time of sample collection. g, Cluster proportions of PD-1+/ICOS+ (left) and CD96hi (right) clusters in SLE patients stratified by immunosuppressant drug use at time of sample collection (no, n=7; yes, n=12). Spearman correlation statistics shown in d-f. Boxes in g show median ± interquartile, with bars indicating min/max values within 1.5x interquartile range. Statistics by Mann-Whitney test.
Extended Data Figure 2.
Extended Data Figure 2.. CD96hi cells are a Th22 cell population.
a, Example of flow cytometry sorting of CD4+ T cell subsets for bulk RNA-seq analysis. b, PCA plot of bulk RNA-seq profiles of CD4+ T cell subsets sorted from SLE (n=6) or healthy control (n=5) donors. Colors indicate cell subsets and shapes indicate clinical group. c, Multi-set Venn diagram of the number of differentially expressed genes between CD96hi cells and indicated CD4+ T cell subsets. d, Expression of IL22 and CXCL13 by qPCR in T cell populations from SLE patients (n=6), plotted relative to expression in CD96hi cells. IL22 expression p-values from left to right: 0.0063, 0.0075. CXCL13 expression p-values from left to right: 0.0128, 0.0012, 0.0283. e, Flow cytometry detection of IL-22 and IL-17A in PMA/ionomycin-stimulated CD96hi CD4 T cells (left) and quantification of IL-22+ IL-17A+ cells (right) in cell subsets from controls (n=6). Boxes indicate median bounded by 1st and 3rd quartile; bars indicate min/max. f,g, Flow cytometry quantification of cytokines from PMA/ionomycin stimulated CD4+ T cell subsets sorted from healthy donors (f, n=5, p=0.0012 for Th17 versus Tph) and base chemokine receptor expression (g, n=6–7). p-values for g from left to right, all comparing to CD96hi subset, for CCR6: 0.0156, 0.0156, 0.0156, for CXCR5: 0.0313, 0.0313, 0.0313, for CXCR3: 0.0156, 0.0156, 0.0156. Data for f and g are shown as mean ± S.D. P-values (*p<0.05, **p<0.01, ***p<0.001, ****p<0.0001) were obtained by ratio paired t-test in d, f, g or by Wilcoxon test in e.
Extended Data Figure 3.
Extended Data Figure 3.. AHR controls T cell production of CXCL13.
a, CXCL13 quantification by ELISA from cells in CRISPR screen without TGF-β. Results from 2 independent experiments using different donors. b, Western blot for CBLB in memory CD4+ T cells treated with control or sgCBLB CRISPR guide (left) and ELISA quantification of CXCL13 from indicated cells (n=4, 2 biological donors each with 2 technical replicates, p=0.031). c, Western blot for AHR in cells nucleofected with sgAHR and sgCD8a control. d, ELISA quantification of cytokines from memory CD4+ T cells nucleofected with sgAHR or sgCD8 (n=12 donors). For CXCL13 p=4.88e-4 and IL-22 p=4.88e-4. e, CXCL13 quantification by ELISA in supernatants of memory CD4+ T cells nucleofected with sgAHR or sgCD8a in the presence or absence of TGF-β (n=8). From left to right, p=0.0078, 0.0078, 0.0078, 0.0156. f,g, Normalized (to DMSO control) ELISA quantification of indicated cytokines in supernatants of memory (f) or naive CD4+ T cells (g) stimulated under indicated conditions (n=5–7). For AHRinh and TCDD in f, respectively, p=7.31e-4 and 0.00304 for CXCL13, and p=0.00159 and 0.0124 for IL-22. For AHRinh and TCDD in g, respectively, p=0.0679 and 0.00108 for CXCL13, and p=0.0192 and 0.0157 for IL-22. h, Normalized (to DMSO control) ELISA quantification of indicated cytokines in supernatants of memory CD4+ T cells stimulated with AHR agonist FICZ, AHR inhibitor GNF-351, or DMSO control (n=3–4). For FICZ and GNF-351, respectively, p=0.0109 (GNF-351 only) for CXCL13, and p=0.0084 and 0.0393 for IL-22. i, Effects of AHR CRISPR deletion (left, n=10) and pharmacological modulation (middle[n=9] and right[n=3]) on IFNγ production measured by ELISA. AHR modulators as in g and h were tested. Results shown normalized to DMSO control. j, Flow cytometry quantification of indicated cytokines in memory CD4+ T cells cultured in polarizing conditions as indicated (n=6). p=0.0316 for IL-17. k, ELISA data for CXCL13 (left) and IL-22 (right), normalized to control (DMSO) condition, in supernatants of CD4+ T cells stimulated and cultured with indicated factors. Each dot represents a donor (n=4–5). l, ELISA data for CD8+ T cells stimulated in the presence of TGF-β with indicated AHR modulators, normalized to DMSO condition per donor (n=6). For AHRinh and TCDD compared to DMSO, respectively, p=0.0021 and 0.0038 for CXCL13, and p=0.0103 and 0.0032 for IL-22. m, ELISA measurement for CXCL13 in supernatants of memory CD8+ T cells nucleofected with sgAHR or control CRISPR guide (n=6, P=0.0312). n, Expression of ICOS (left) and CD96 (right) by flow cytometry in memory CD8+ T cells stimulated in indicated conditions, normalized to DMSO condition (n=8). For AHRinh and TCDD, respectively, p=0.0158 (AHRinh only) for ICOS, and p=7.09e-3 and 0.0371 for CD96. Data for f, g, h, i, l and n are shown as mean ± S.D. p-values (NS≥0.05, *p<0.05, **p<0.01, ***p<0.001) by ratio paired t-test for b, f-j, l, n, Wilcoxon test in e, m.
Extended Data Figure 4.
Extended Data Figure 4.. Effects of chronic AHR modulation in CD4+ T cells.
a, ELISA data for indicated cytokines in supernatants of memory (top) and naïve (bottom) CD4+ T cells re-stimulated each week for 3 weeks, normalized to DMSO 1 week result for each donor (n=3–4 donors). b, UMAP of RA synovial T cell clusters and expression of CXCL13. c, UMAP of cells from Fig. 2e mapped to RA synovial T cell UMAP. d, Cluster abundance of in vitro cultured memory CD4+ T cells from Fig. 2e mapped to RA synovial T cell clusters (n=3). Compared to DMSO condition, from top to bottom, for TGF-β+DMSO p=0.0092, 0.0023, 0.0275, 0.0323, and for TGF-β+AHRinh P=0.0188, 0.0023, 0.0323. ANOVA with Holm-Sidak test. e, CXCL13 expression (by fragments per kilobase of transcript per million mapped reads, FPKM) in bulk RNA-seq samples of cell stimulated under indicated conditions (n=3). f, GSEA enrichment plots of Tph gene signature in naïve or memory CD4+ T cells stimulated with TGF-β plus either AHR agonist TCDD or inhibitor (AHRinh) CH-223191. g, GSEA enrichment plots for Tph gene signature in T cells stimulated with or without TGF-β, under indicated conditions of AHR agonist TCDD, AHR inhibitor (AHRinh) CH223191, or DMSO control. Mean ± SD shown in a, e.
Extended Data Figure 5.
Extended Data Figure 5.. Effects of AHR and TGF-β on CD4+ T-cell subsets.
a, ELISA measurement of CXCL13 in supernatants of sorted CD4+ T cell subsets from healthy donors (n=10), stimulated under indicated conditions. Statistical comparisons compare AHR agonist/inhibitor to DMSO within presence or absence of TGF-β, and TGF-β versus no TGF-β within each treatment. p-values from left to right for Naïve: 0.0188, 0.0188, Tph: 0.0032, 4.7e-5, Tfh: 0.0123, 0.0050, CD96hi: 0.0063, 0.0003, 0.0079, Th17: 0.0231, 0.0032, 0.0188, Th1: 0.0050, 0.0050, 0.0421. b, ELISA measurement of CXCL13 from CD4+ T cell subsets nucleofected with either sgAHR or sgCD8a CRISPR guides (n=4). From left to right, p=0.0331, 0.0507, 0.0539, 0.0154, 0.0127.c, TGF-β gene signature score in bulk RNA-seq data of T cell subsets as in Fig 1h. Comparisons made against Tph subset, from left to right p=1.14e-4, 1.85e-3, 0.0197, 1.85e-3. d, ELISA measurement for IL-22 in supernatants of indicated CD4+ T cell subsets stimulated under indicated conditions (n=10). Statistical comparisons performed as in (a). p-values from left to right in each subset is as follows, Naïve: 0.0123, CD96hi: 0.0188, 7.24e-4, 1.96e-3, Th17; 4.31e-4, 0.028, 3.17e-3, 0.0188, Th1: 0.002. e, Surface expression of indicated markers in CD4+ T cell subsets by flow cytometry, normalized (to DMSO w/o TGF-β) mean fluorescence intensity (MFI), after stimulation as indicated (n=4–5). Statistical comparisons performed as in (a). For ICOS, p-value from left to right in each subset is as follows, Naïve: 0.0188, 8.98e-3, 0.0264, 3.57e-3, Tph: 2.73e-3, 5.21e-3, 5.57e-3, 0.0104, 0.0109, 0.0293, Tfh: 2.20e-4, 1.54e-3, 3.34e-4, 8.89e-4, 5.49e-5, 1.31e-3, CD96hi: 5.17e-3, 6.66e-3, 4.52e-4, 0.0154, 2.10e-3, 3.14e-7, 4.39e-3. For CD96, p-value from left to right in each subset is as follows, Naïve: 0.0112, Tph: 0.0312, 0.0205, 6.75e-3, 5.57e-3, Tfh: 0.0315, CD96hi: 0.0463, 5.93e-3, 0.0296, 0.0224. For TIGIT, p-value from left to right in each subset is as follows, Naïve: 0.0160, 0.0203, Tph: 2.41e-3, 0.0115, 0.0165, 1.69e-3, Tfh: 3.26e-3, 0.0238, 0.0321, 4.35e-3, 8.51e-3, 6.84e-3, CD96hi: 0.0105, 0.0157. For PD-1, p-value from left to right in each subset is as follows, Naïve: 9.17e-3, 4.63e-3, 1.04e-3, 2.33e-3, 8.55e-4, 0.0331, Tph: 0.0133, 0.0119, 3.49e-3, 0.0104, Tfh: 8.49e-4, 5.38e-3, 3.73e-4, 1.03e-3, 1.75e-3, 0.0292, 6.66e-3, CD96hi: 9.75e-3, 0.0485, 0.0129, 0.0197, 2.94e-3, 2.07e-3, 0.0328. Boxes indicate median bounded by 1st and 3rd quartile, with bars indicating min/max for a and d, and as mean ± S.D for c and e. p-values (*p<0.05, **p<0.01, ***p<0.001, ****p<0.0001) by Friedman’s test with post-test by Dunn’s test for a, c and d, and by ratio paired t-test for b and e.
Extended Data Figure 6.
Extended Data Figure 6.. ATAC-seq analysis of Tph cells, Tfh cells, and AHR inhibitor-treated cells.
a,b, Example flow cytometry cell sorting of CD4+ T cell populations from RA synovial fluid (a) or tonsil (b) mononuclear cells. c, PCA plot of ATAC-seq data from CD4 T cell populations sorted from RA synovial fluid or from tonsil based on PD-1 expression level. d, PCA plot of ATAC-seq data from blood CD4+ T cells of healthy donors cultured with DMSO, AHR agonist TCDD or AHR inhibitor (AHRinh) CH-223191 in the presence of TGF-β. e, GSEA plots of annotated genes of DARs from synovial fluid Tph cells (top, p=0.001) and tonsil Tfh cells (bottom, p=0.001) in CD4+ T cells treated with AHRinh versus TCDD in presence of TGF-β for 1 week. f, Differentially accessible regions (red square) near the CXCL13 gene locus from ATAC-seq of each indicated cell type/culture condition. TCDD = AHR agonist; AHRinh = AHR inhibitor CH-223191.
Extended Data Figure 7.
Extended Data Figure 7.. Detection of PD-1+ Tph cells in SLE PBMC.
Gating strategy for flow cytometry detection of PD-1+ CXCR5 Tph cells and CD96hi cells in PBMC from SLE patient after treatment with AHR inhibitor (AHRinh) CH-223191.
Extended Data Figure 8.
Extended Data Figure 8.. Transcriptomic and epigenetic evaluation of AHR activation in T cells and association with AP-1 family members.
a, Schematic of RNA-Seq time course experiment to identify early transcriptomic events of AHR modulation. b, PCA plots of RNA-seq samples after 12 hours (left) and 48 hours (right) of stimulation with TGF-β and either AHR agonist (TCDD) or AHR inhibitor (AHRinh) CH-223191. c,d, Volcano plots of DESeq2 results from RNA-Seq analysis of memory CD4+ T cells cultured for 12 hours (c) and 48 hours (d) in TGF-β and either TCDD or AHRinh. The samples used for DESeq2 analysis correspond with the PCA plots in b. e, Pathway enrichment analysis of genes upregulated in TCDD-treated CD4+ T cells at 48 and 72 hours of culture, based on Elsevier pathway collection. f, Transcription factor enrichment analysis of samples at 12 hours using EnrichR databases TRRUST Transcription factors 2019 (left) and EnrichR Transcription factor Co-occurence (right). g, AHR CUT&RUN binding signal (top) and heat map (bottom). h, Volcano plot of AHR CUT&RUN Diffbind analysis comparing samples with and without AHR CRISPR knockout (top) and HOMER motif analysis of all upregulated peaks found in AHR WT samples (bottom). i, Representative AHR binding regions. j, Comparison of AHR binding in cells treated with AHR agonist or AHR antagonist. k, Venn diagram of overlapped genes bound by AHR with Th22 signature genes as shown in Fig 1e, hypergeometric P-value is shown. l, Pathway enrichment analysis of AHR-bound peak associated genes. TCDD = AHR agonist; AHRinh = AHR inhibitor, CH-223191.
Extended Data Fig 9.
Extended Data Fig 9.. Overexpression of JUN in human CD4+ T cells.
a, Illustration of JUN-targeting sgRNAs used in CRISPR screens and validation experiments, and Western blot detection of JUN in T cells nucleofected with control (sgCtrl) or JUN-targeting guide (JUN-sg5), western blot has been reproduced in at least 5 different biological donors. b, Flow cytometry detection of CXCL13 in memory CD4+ T cells nucleofected with control (upper left) or JUN-sg5 (lower left), and quantification after stimulation under indicated conditions (n=4, right), p-value from left to right: 3.81e-4, 0.0372. c, Flow cytometry detection of IL-22 detection and quantification of IL-22 as for CXCL13 in b. For flow cytometry data (right, n=4, p=3.6e-5). d, Top 10 HOMER motifs (left) from JUN CUT&RUN peaks in TCDD-treated memory CD4+ T cells with pathway enrichment analysis (middle and right). e, Venn diagram of CUT&RUN peaks bound by AHR and JUN. f,g Verification of AHR and JUN as interactors. Immunoblot (WB) analysis of HA (f) or Flag (g) immunoprecipitates from the indicated cell lysates probed with the indicated antibodies, both have been repeated two times in HEK293T cells. h, Cytoplasmic or nuclear extracts (as indicated on bottom) from HEK293T cells stably expressing HA-AHR or vector control treated with AHRinh, TCDD or vehicle control (DMSO) were immunoblotted for AHR, JUN and respective controls (β-tubulin for cytoplasmic extract, Histone H3 for nuclear extract), this has been repeated 3 times in HEK293T cells. i, JUN expression by Western blot in T cells transduced with JUN overexpression construct or control vector. j, Example of flow cytometry sorting to obtain JUN-overexpressing cells based on GFP positivity. k, JUN overexpression (JUN OE) CUT&RUN assessment by peak density on total JUN bound peaks compared to vector control as in Fig 3k and top HOMER motifs for each respective condition. p-values (*p<0.05, **p<0.01, ***p<0.001, ****p<0.0001) by ratio paired t-test for b and c. TCDD = AHR agonist; AHRinh = AHR inhibitor, CH-223191.
Extended Data Fig 10.
Extended Data Fig 10.. Increased IFN in SLE patients inhibit AHR signaling.
a, IFN signature score in RNA-seq data of CD4+ T cell subsets from SLE and control patients as in Fig 1g. Median ± interquartile range shown. b, Elsevier pathway enrichment from annotated genes of DAR in No IFN-β control treated CD4+ T cells. c, Normalized relative expression of CYP1A1 measured by qPCR in CD4+ T cells cultured in DMSO or TCDD with the addition of vehicle control or IFN-α (n=8, p=0.0016 by paired t-test). TCDD = AHR agonist.
Figure 1.
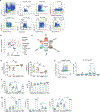
Figure 1.. Imbalanced CXCL13+ Tph/Tfh cells versus IL-22+ CD96hi cells in SLE patients.
a, UMAP showing co-varying neighborhood analysis (red, enriched in SLE; blue, enriched in controls by FDR<0.05, global p=0.001). b, Feature plots showing expression of indicated proteins on memory CD4+ T cells. c, UMAP showing memory CD4+ T cell clusters. d, Quantification of indicated clusters in SLE patients (n=19) and controls (n=19), p=6.3e-6 for PD-1/ICOS+, p=2.9e-9 for CD96hi. e, Heatmap of upregulated genes in Treg, Tph/Tfh cells, and CD96hi cells in RNA-seq data from blood T cell subsets (n=11; 6 SLE patients, 5 controls). f, Th22 and Tph gene signature scores in RNA-seq data in e. Th22 score compared to CD96hi T cells, p-values from left to right: 6.24e-8, 9.53e-3, 1.11e-7, 4.75e-3. Tph score compared to Tph cells, from left to right p= 3.42e-7, 4.73e-4, 2.04e-4. g, Flow cytometry quantification of IL-22 and IL-17A cells in cell subsets from controls (n=6). Boxes indicate median bounded by 1st and 3rd quartile; bars indicate min/max. Comparing between CD96hi and Th17 subsets, IL-22+ IL-17A p=0.0312, IL-22 IL-17a+ p=0.0312. Data for d, f, show mean ± SD, and min/max/median for g. p-values (NS≥0.05, *p<0.05, **p<0.01, ***p<0.001, ****p<0.0001) by Mann-Whitney test in d, Friedman test with Dunn multiple comparisons test in f, Wilcoxon test in g.
Figure 2.
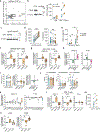
Figure 2.. AHR controls a CXCL13-IL-22 differentiation axis in human T cells.
a, Schematic of arrayed CRISPR screen. b, CXCL13 quantification by ELISA from cells in CRISPR screen with TGF-β. Results from 2 independent experiments using different donors. c, ELISA quantification of cytokines, normalized to DMSO condition, from total CD4+ T cells stimulated as indicated with TGF-β (n=10). For AHRinh and TCDD, respectively, p=1.44e-6 and 1.55e-4 for CXCL13, and p=1.33e-4 and 2.76e-4 for IL-22. d, Flow cytometry quantification of ICOS and CD96 on memory CD4+ T cells, normalized to DMSO condition (n=8). For AHRinh and TCDD compared to DMSO, respectively, p=0.0052 and 0.0004 for ICOS, p=0.0020 and 0.018 for CD96. e, UMAPs of scRNA-seq data of memory CD4+ T cells stimulated under indicated conditions for 2 weeks. f, UMAP as in e coloured by enrichment of Tph gene signature. g, GSEA plot of Tph gene signature enrichment (red) and CD96hi gene signature enrichment (blue) in cells treated with TGF-β+AHRinh for 2 weeks versus TCDD without TGF-β for 1 week. h, AHR reporter activity in indicated conditions with serum from SLE patients (n=11) or anti-nuclear antibody (ANA)+ controls (n=12), p=2.80e-3. i, Flow cytometry quantification of indicated cell populations, normalized to DMSO condition, in T cells from PBMC of SLE or controls (n=9 each). Comparisons of AHR agonist/inhibitor to DMSO for SLE or control. For PD-1+CXCR5 p=0.0022. For CD96hi, from left to right, p=0.0041, 2.2e-5, 7.9e-5. j, Quantification of CD38hi CD27+ plasmablasts in co-cultures of B cells with Tfh cells pretreated as indicated (n=4 donors), p=0.021. c, d, h-j show mean ± SD. p-values (*p<0.05, **p<0.01, ***p<0.001, ****p<0.0001) by ratio paired t-test in c,d,i and j, Mann-Whitney test for h. TCDD = AHR agonist; AHRinh = AHR inhibitor CH-223191.
Figure 3.
Figure 3.. AHR coordinates with JUN to promote Th22 over Tph/Tfh phenotypes.
a, AHR-induced gene cluster identified by maSigPro and pathway enrichment. b, Enrichment of transcription factors and co-occurrence from a. c, AHR CUT&RUN motif analysis. d,e, ELISA quantification of CXCL13 (d) and IL-22 (e) from AP-1-targeted arrayed CRISPR screen of T cells (n=2, biological). f, CXCL13 (n=3) and IL-22 (n=3) production by T cells after JUN CRISPR, from left to right p=0.00979, 0.0528, 0.0108, 0.0517, 0.0226, 0.045. g, GSEA of Th22 (p=0.27) and Tph (p=8.3e-05) signatures in T cells with JUN-sg5 or control. h, Representative JUN binding peaks and AHR binding peaks in T cells treated with TCDD. i, Venn diagram of JUN and AHR co-bound peak-associated genes that overlap with cluster 6 (AHR-induced) genes from 3a. j, Representative JUN binding peaks in AHRinh-treated T cells (left) and overall JUN binding signal (right) at AHR peaks in T cells treated with TCDD or AHRinh. k, Venn diagram and heatmap of JUN bound peaks in T cells treated with TCDD and AHRinh. l, Western blot of JUN and JUN-pS73 in T cells stimulated as indicated. m, Densitometry quantification of Western blot as in g, normalized to DMSO condition (n=13), from left to right p=0.0010, 3.1e-5, 0.0265, 6.6e-5. n, ELISA quantification of indicated cytokines in JUN-overexpressing (JUN OE) or control-transduced T cells, stimulated in TGF-β as indicated (n=4). From left to right p=0.00343, 0.0153, 0.0312, 0.069, 0.091, 0.0391. o, JUN binding peaks of AHRinh-treated T cells expressing empty vector or JUN overexpression vector (JUN OE) at CXCL13 and IL22 loci. p, Pathway enrichment analysis of genes associated with enriched peaks in JUN OE T cells. q, GSEA of Th22 (p=0.02) and Tph (p<0.001) gene signature enrichment in JUN OE and control T cells treated with AHRinh. h shows mean ± S.D. p-values obtained by ratio paired t-test for f, m, n. T cells = memory CD4+ T cells.
Figure 4.
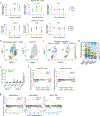
Figure 4.. Increased IFN in SLE patients promotes Tph cell differentiation and inhibits AHR.
a, CXCL13 in CD4+ T cells from ISGhi and ISGlow SLE patients (n=12, p=0.0013). b, Serum CXCL13 in SLE patients treated with anifrolumab or placebo, stratified by IFN signature level. Sample size as indicated. Error bars indicate 95% confidence intervals. For IFN High p=2.67e-07 by mixed effect model for 1 year trajectory. c, Schematic of scRNA-seq data generation. d, UMAP clustering of memory CD4+ T cells from lupus patients pre-anifrolumab and feature plots for indicated gene signatures. e, Violin plots of expression of indicated signatures (from 1e) in Tph and Th22 clusters. p<2.2e-16 for Tph, p<2.2e-16 for CD96hi. f, Violin plots of ISG signature (p=4.57e-8), JUN transcriptional signature (p<2.2e-16) and JUN mRNA expression (p=0.81) in Tph and Th22 clusters from d. h, Tph and Th22 cluster proportions among memory CD4+ T cells before and after anifrolumab. p= 0.03 for Tph, 0.016 for Th22. i, Cytokine quantification by ELISA from memory CD4+ T cells stimulated as indicated (n=6). From left to right, p-value for CXCL13: 8.5e-5, 4.05e-4, 2.9e-5; for IL-22: 2.35e-3, 8.76e-4, 0.0338. j, ELISA for CXCL13 in total CD4+ T cells nucleofected with sgAHR or control CRISPR guides, stimulated under indicated conditions (n=4). p-value from left to right: 5.17e-4, 2.8e-4, 7.1e-5, 1.35e-3. k, Venn diagram of overlapped DAR regions in IFN-β-treated CD4+ T cells (left) or control (right) with SF PD-1hi and AHRinh treated CD4+ T cells. l, Accessible regions near CXCL13 locus in CD4+ T cells treated with IFN-β or control. m, AHR reporter activity in cells stimulated as indicated with or without IFN-β pre-treatment (3 experiments with 2–4 replicates each, total n=9, left to right p=0.0117, 0.00391). a, i, and j show mean ± S.D. p-value (*p<0.05, **p<0.01, ***p<0.001) by Mann-Whitney in a, linear mixed model in e, f, g and m, paired t-test in h, ratio paired t-test in i and j.
Figure 5.
Figure 5.. IFN opposes IL-2 and JUN to promote CXCL13+ Tph cells.
a, Cytokines by ELISA from cells from IFN-targeted arrayed CRISPR screen. Results of 2 independent experiments using different donors. b, IL-2-induced gene signature in Tph and Th22 clusters. p=0.0175. c, Cytokines by ELISA from memory CD4+ T cells stimulated with plate-bound anti-CD3 antibody and IL-2 at indicated concentrations. From left to right, p-values for CXCL13: 9.45e-4, 4.34e-5, 1.34e-5, 3.05e-6, 4.30e-6, 4.24e-6 and for IL-22: 2.21e-3, 4.51e-4. d, Western blot for STAT5 and ELISA for cytokines from memory CD4+ T cells nucleofected with sgSTAT5A, sgSTAT5B, both (combined) or control CRISPR guides, stimulated as indicated (n=3). Comparison of IL-2 effect within each CRISPR condition. p-values from left to right for CXCL13: 4.16e-5, 4.12e-4, 1.73e-3; IL-22: 1.94e-2, 2.53e-2, 6.06e-4. e, ELISA for CXCL13 from memory CD4+ T cells stimulated under indicated conditions. p-value from left to right for anti-CD3/CD28 (n=6): 5.52e-3, 1.70e-2, 1.08e-2, 2.40e-2; anti-CD3 antibody (n=5): 2.54e-2, 7.2e-3, 1.57e-2. f, ELISA for IL-2 from memory CD4+ T cells stimulated with anti-CD3/CD28 as indicated (n=8), p=0.0008. g, Western blot for phosphoS73-JUN and JUN in memory CD4+ T cells under indicated conditions and quantification normalized to control (n=5). JUN p=0.0044, JUN-pS73 p=0.0016. h, JUN binding signal at JUN peaks in memory CD4+ T cells stimulated with or without IFN-α and representative JUN binding peaks at IL22. i, Pathway enrichment for annotated differentially bound peaks by JUN enriched in control versus IFN-α-treated conditions from h. j, ELISA for cytokines from memory CD4+ T cells with JUN overexpression (JUN OE) or control with or without IFN-α (n=4). p-values from left to right for CXCL13: 0.011, 0.041; IL-22: 0.013, 0.033. k, Model of factors influencing Tph versus Th22 balance. c, d, e, g show mean ± S.E.M. p-value (*p<0.05, **p<0.01, ***p<0.001) by linear mixed model in b, 2-way ANOVA in c, ratio paired t-test in d, e, f, g, j.

Comment in

References

    1. Tsokos GC Autoimmunity and organ damage in systemic lupus erythematosus. Nature immunology 21, 605–614 (2020). 10.1038/s41590-020-0677-6 - DOI - PMC - PubMed
    1. Jenks SA, Cashman KS, Woodruff MC, Lee FE & Sanz I Extrafollicular responses in humans and SLE. Immunological reviews 288, 136–148 (2019). 10.1111/imr.12741 - DOI - PMC - PubMed
    1. Bocharnikov AV et al. PD-1hi CXCR5- T peripheral helper cells promote B cells responses in lupus via MAF and IL-21. JCI insight (2019). 10.1172/jci.insight.130062 - DOI - PMC - PubMed
    1. He J et al. Circulating precursor CCR7(lo)PD-1(hi) CXCR5(+) CD4(+) T cells indicate Tfh cell activity and promote antibody responses upon antigen reexposure. Immunity 39, 770–781 (2013). 10.1016/j.immuni.2013.09.007 - DOI - PubMed
    1. Havenar-Daughton C et al. CXCL13 is a plasma biomarker of germinal center activity. Proc Natl Acad Sci U S A 113, 2702–2707 (2016). 10.1073/pnas.1520112113 - DOI - PMC - PubMed

MeSH terms