. 2024 Jul;631(8021):601-609.
doi: 10.1038/s41586-024-07608-5. Epub 2024 Jul 10.

Brainstem Dbh+ neurons control allergen-induced airway hyperreactivity

Affiliations

Brainstem Dbh+ neurons control allergen-induced airway hyperreactivity

Yujuan Su et al. Nature. 2024 Jul.

Abstract

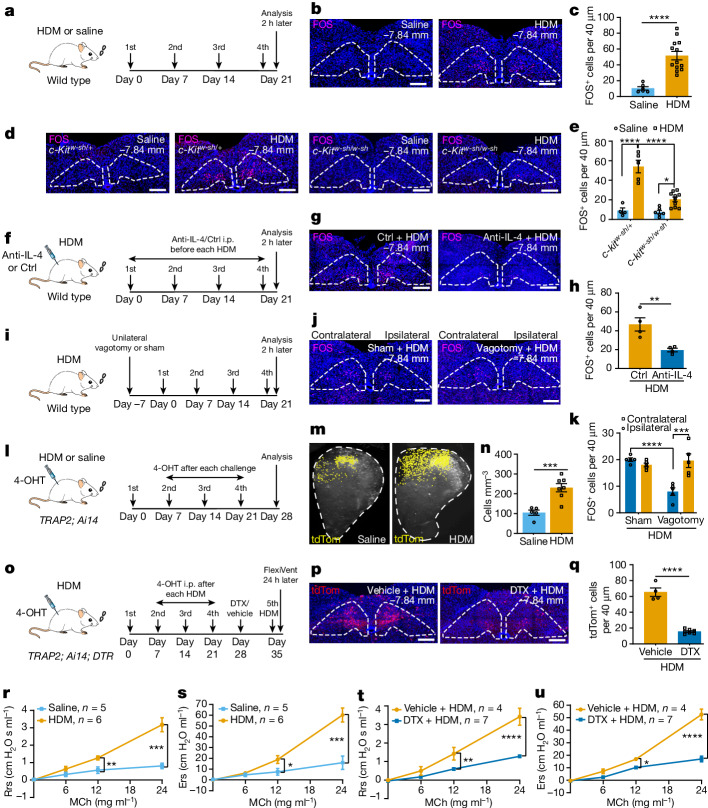
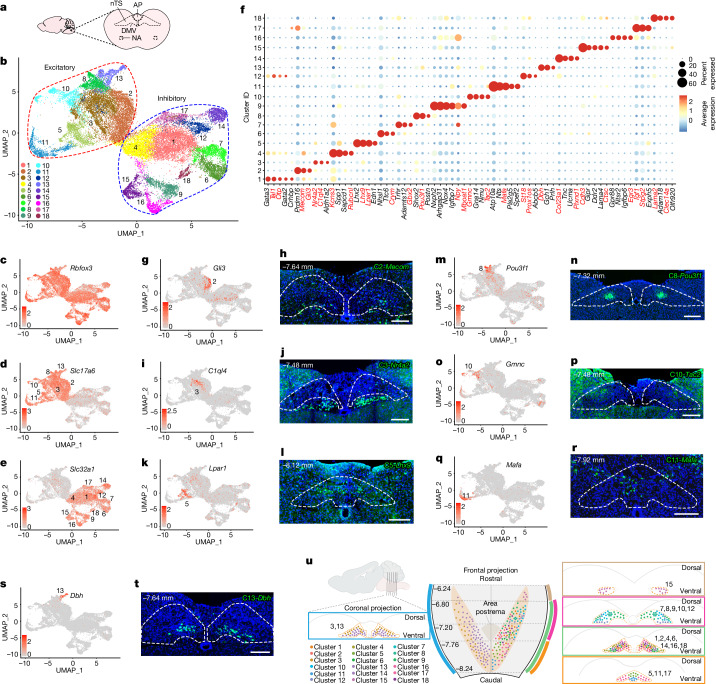
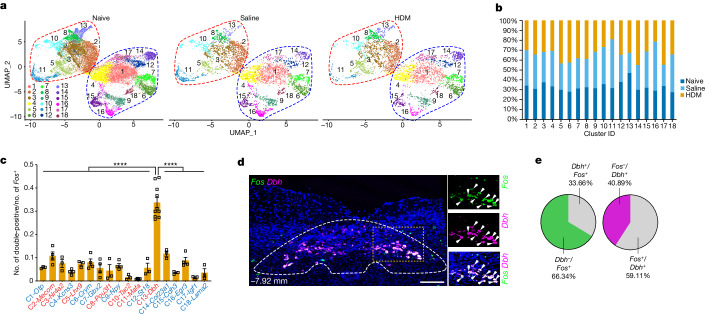
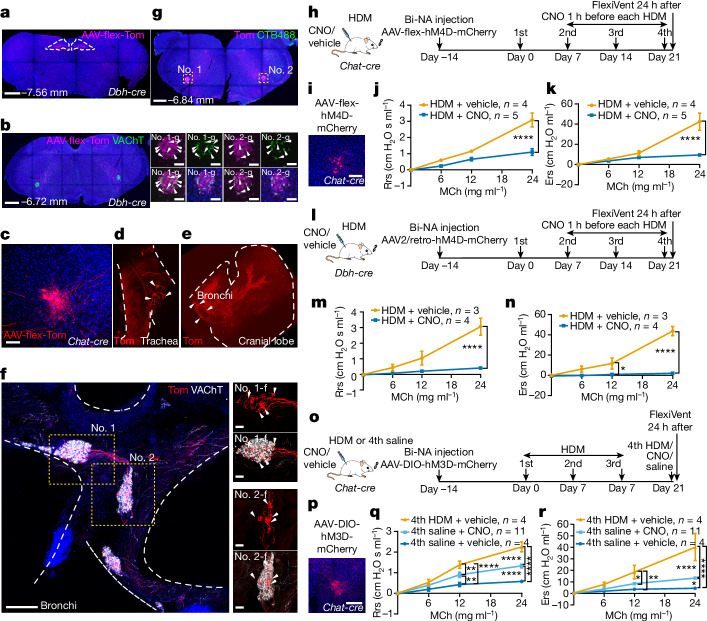
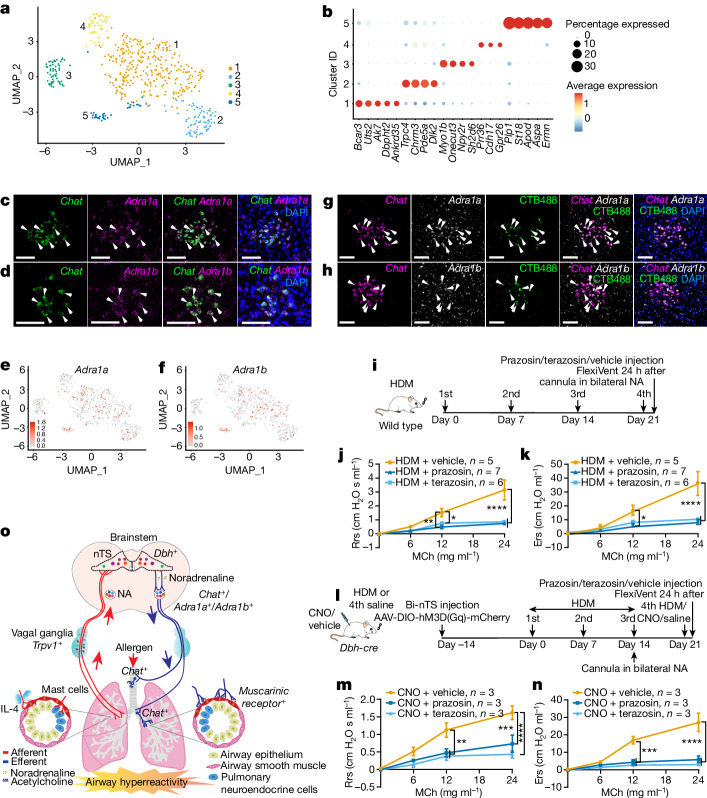
Exaggerated airway constriction triggered by repeated exposure to allergen, also called hyperreactivity, is a hallmark of asthma. Whereas vagal sensory neurons are known to function in allergen-induced hyperreactivity1-3, the identity of downstream nodes remains poorly understood. Here we mapped a full allergen circuit from the lung to the brainstem and back to the lung. Repeated exposure of mice to inhaled allergen activated the nuclei of solitary tract (nTS) neurons in a mast cell-, interleukin-4 (IL-4)- and vagal nerve-dependent manner. Single-nucleus RNA sequencing, followed by RNAscope assay at baseline and allergen challenges, showed that a Dbh+ nTS population is preferentially activated. Ablation or chemogenetic inactivation of Dbh+ nTS neurons blunted hyperreactivity whereas chemogenetic activation promoted it. Viral tracing indicated that Dbh+ nTS neurons project to the nucleus ambiguus (NA) and that NA neurons are necessary and sufficient to relay allergen signals to postganglionic neurons that directly drive airway constriction. Delivery of noradrenaline antagonists to the NA blunted hyperreactivity, suggesting noradrenaline as the transmitter between Dbh+ nTS and NA. Together, these findings provide molecular, anatomical and functional definitions of key nodes of a canonical allergen response circuit. This knowledge informs how neural modulation could be used to control allergen-induced airway hyperreactivity.


Conflict of interest statement

The authors declare no competing interests.

Figures

Fig. 1
Fig. 1. Activation of nTS neurons following repeated allergen challenges to lung.
a, Experimental scheme for HDM treatment. b,c, Representative FOS antibody staining (b) and quantification (c). Dashed areas represent nTS. n = 6 saline and n = 13 HDM mice, unpaired t-test, P < 0.0001. d,e, Representative FOS antibody staining (d) and quantification (e), showing decreased FOS+ cells in the nTS of c-Kitw-sh/w-sh mice, compared to c-Kitw-sh/+ mice. n = 4 saline and n = 5 HDM, c-Kitw-sh/+ mice, P < 0.0001; n = 6 saline and n = 10 HDM, c-Kitw-sh/w-sh mice, P = 0.0339; for comparison between c-Kitw-sh/+ and c-Kitw-sh/w-sh mice following HDM, P < 0.0001, two-way analysis of variance (ANOVA) with Bonferroni post hoc test. f, Experimental scheme for treatment with anti-IL-4 antibody. g,h, Representative FOS antibody staining (g) and quantification (h). n = 4 mice for both groups, unpaired t-test, P = 0.0095. i, Experimental scheme for HDM treatment after vagotomy. j,k, Representative FOS antibody staining (j) and quantification (k). n = 5 mice for both sham and vagotomy, P = 0.0001 between vagotomy ipsilateral and vagotomy contralateral; P < 0.0001 between sham ipsilateral and vagotomy ipsilateral; not significant (NS) for remaining pairs, two-way ANOVA (Bonferroni post hoc). l, Experimental scheme for labelling allergen-activated neurons in TRAP2; Ai14 mice. m,n, Coronal view of CLARITY-cleared brainstem hemisphere (m, dashed areas) and quantification (n, n = 5 saline and n = 7 HDM mice, unpaired t-test, P = 0.0010). o, Experimental scheme for ablating allergen-activated neurons in TRAP2; Ai14; DTR mice. p,q, Representative FOS antibody staining (p) and quantification (q). n = 4 vehicle and n = 7 DTX mice, unpaired t-test, P < 0.0001. r,s, FlexiVent-measured maximal resistance (Rrs, cm H2O s ml−1, airway pressure (cm H2O) per time derivative of tidal volume, r) and elastance (Ers, cm H2O ml−1, airway pressure per tidal volume, s) of wild-type airways following increasing doses of methacholine (MCh), demonstrating hyperreactivity following HDM. n = 5 saline and n = 6 HDM mice, unpaired t-test was performed at each MCh concentration separately, for Rrs (r), at 12 mg ml−1 MCh, P = 0.0087; at 24 mg ml−1, P = 0.0007; for Ers (s), at 12 mg ml−1, P = 0.0450; and at 24 mg ml−1, P = 0.0009; NS for all other pairwise comparisons. t,u, Blunted airway hyperreactivity in DTX + HDM group. n = 4 vehicle and n = 7 DTX mice, unpaired t-test, for Rrs (t), at 12 mg ml−1, P = 0.0069; for Ers (u), at 12 mg ml−1, P = 0.0436; P < 0.0001 for both Rrs (t) and Ers (u) at 24 mg ml−1; NS for all other pairs. Data are presented as mean ± s.e.m., two-sided for unpaired t-test. b,d,g,j,p, Scale bars, 200 µm. Ctrl, control; i.p. intraperitoneal. Source Data
Fig. 2
Fig. 2. Single-nucleus transcriptomic signatures of the nTS.
a, Diagram illustrating the relative locations of brainstem regions of interest. AP, area postrema. b, UMAP plots of integrated nTS snRNA-seq data from naive adult males (n = 4 biological repeats, n = 2 mice in each group), mice at 1.5 h after the fourth saline treatment (2 males in the group) and mice at 1.5 h after the fourth HDM challenge (2 males in the group). ce, Feature plots showing pan-neuronal marker Rbfox3 (c), excitatory marker Scl17a6 (d) and inhibitory marker Slc32a1 (e). f, Dotplot showing top markers for each cluster. Genes in red were used for validation by either Feature plots or RNAscope. Using default Seurat dotplot settings (Methods), percentage expressed was plotted from 0 to 60% detected and the colour bar shows the average of scaled normalized expression values across cells in a given cluster. gt, Feature plots (g,i,k,m,o,q,s) and RNAscope (h,j,l,n,p,r,t) of excitatory markers Gli3 (g), Mecom (h), C1ql4 (i), Nr4a2 (j), Lpar1 (k), Lhx9 (l), Pou3f1 (m,n), Gmnc (o), Tac2 (p), Mafa (q,r) and Dbh (s,t). Bregma levels with maximal signals are shown. Scale bars, 200 µm. u, Diagram summarizing spatial distribution of the 18 nTS clusters with coronal (middle) and transverse (left and right) views, based on RNAscope data on serial nTS sections. Whereas clusters 3 and 13 are found throughout the rostral–caudal axis (left), cluster 13 is ventral to cluster 3 in the rostral portion while intermingled in the caudal portion. Neurons in the other clusters are more regionally restricted to selective bregma regions, as illustrated by curved coloured lines corresponding to coloured boxes (right). Dorsal–ventral and medial–lateral distributions of each cluster are reflected by placement of coloured dots. Brainstem illustration in u was created with BioRender.com.
Fig. 3
Fig. 3. Dbh+ neurons in the nTS were preferentially activated following allergen challenge to lung.
a,b, UMAP plots (a) and stacked bar plot (b) showing the corresponding 18 neuron clusters in naive (n = 4 biological repeats, n = 2 mice in each group), saline- (2 males in the group) and HDM-challenged (2 males in the group) nTS. c, Quantification from double RNAscope showing the overlap between Fos and the top marker gene of each individual nTS cluster 1.5 h following the fourth HDM. Red and blue indicate excitatory and inhibitory clusters, respectively. Data are mean ± s.e.m. Each data point represents an individual animal. n = 3 for cluster 1 (C1), n = 4 for C2, n = 3 for C3, n = 4 for C4, n = 3 for C5, n = 4 for C6, n = 4 for C7, n = 3 for C8, n = 4 for C9, n = 3 for C10, n = 4 for C11, n = 3 for C12, n = 10 for C13, n = 3 for C14, n = 3 for C15, n = 4 for C16, n = 3 for C17, n = 3 for C18. Multiple-comparisons one-way ANOVA (Bonferroni post hoc test), P < 0.0001 for comparison between C13 Fos and Dbh overlap and that between Fos and marker genes of the other 17 nTS clusters. d,e, Dbh and Fos double RNAscope (d) and quantification (n = 12 mice, e) in nTS; boxed areas are enlarged on the right, arrowheads indicate overlapping expression. Scale bars, 200 µm. Source Data
Fig. 4
Fig. 4. Dbh+ neurons in the nTS mediate airway hyperreactivity.
a, Experimental scheme for chemical ablation of Dbh+ nTS neurons. Bi-nTS, bilateral nTS. b, DBH antibody staining in nTS. c,d, FlexiVent data showing blunted airway hyperreactivity following DBH–SAP treatment. n = 4 blank–SAP and n = 8 DBH–SAP mice, unpaired t-test at 0, 6, 12 and 24 mg ml−1 MCh separately, at 24 mg ml−1 MCh of both Rrs (c) and Ers (d), P < 0.0001; NS for all other pairwise comparisons. e, Experimental scheme for genetic ablation of Dbh+ nTS neurons. f, Dbh RNAscope in nTS. g,h, FlexiVent data showing blunted airway hyperreactivity following DTX injection. n = 4 vehicle and n = 10 DTX mice, unpaired t-test, for Rrs (g) at 12 mg ml−1 MCh, P = 0.0022; for Ers (h) at 12 mg ml−1 MCh, P = 0.0002; and for both Rrs (g) and Ers (h) at 24 mg ml−1, P < 0.0001; NS for all other pairwise comparisons. i, Experimental scheme for chemogenetic inhibition of Dbh+ nTS neurons. j,k, FlexiVent data showing blunted airway hyperreactivity following CNO injection. n = 5 vehicle and n = 9 CNO mice, unpaired t-test, for Rrs (j) at 24 mg ml−1 MCh, P < 0.0001; for Ers (k) at 12 mg ml−1 MCh, P = 0.0370, at 24 mg ml−1 MCh, P < 0.0001; NS for all other pairwise comparisons. l, Experimental scheme for chemogenetic activation of Dbh+ nTS neurons. m,n, FlexiVent data showing partially increased airway hyperreactivity following CNO injection, in place of the fourth HDM. All groups received the first, second and third HDM challenges. n = 4 fourth HDM, n = 11 fourth CNO and n = 7 fourth saline mice, multiple-comparisons one-way ANOVA (Bonferroni post hoc test), for Rrs (m) at 12 mg ml−1 MCh, P < 0.0001 between fourth HDM and fourth saline, between fourth CNO and fourth saline, at 24 mg ml−1 MCh, P < 0.0001 for all pairs; for Ers (n) at 12 mg ml−1 MCh, P = 0.0384 between fourth HDM and fourth saline, P = 0.0252 between fourth CNO and fourth saline, at 24 mg ml−1 MCh, P < 0.0001 for all pairs; NS for all other pairwise comparisons. Data are mean ± s.e.m., two-sided for unpaired t-test. b,f, Scale bars, 200 µm. Source Data
Fig. 5
Fig. 5. Parasympathetic neurons in the NA are necessary and sufficient downstream of the nTS for allergen-induced airway hyperreactivity.
a, Brainstem section showing injection of AAV-flex-tdTomato into Dbh-cre mouse. b, In the same mouse, tdTom+ nerves project to the NA (vesicular acetylcholine transporter; VAChT+). c, Injection of AAV-flex-tdTomato into the NA of a Chat-cre mouse. d,e, In the same mouse, tdTom+ projects to both trachea (d) and extrapulmonary bronchi (e). f, NA-originated tdTom+ fibres innervate postganglionic parasympathetic ganglia (VAChT+) on extrapulmonary bronchi. Arrowheads indicate innervated signals. g, In Chat-cre; Ai14 mice, injection of CTB488 in dorsal trachea labelled CTB488+tdTom+ NA neurons. Arrowheads indicate overlapping expression. h, Scheme for chemogenetic inhibition of Chat+ neurons in bilateral NA (bi-NA). i, AAV-flex-hM4D-mCherry signals. j,k, FlexiVent, n = 4 vehicle and n = 5 CNO mice, unpaired t-test, at 24 mg ml−1 MCh, P < 0.0001 for both Rrs (j) and Ers (k); NS for all other pairs. l, Scheme for inhibiting NA-innervating Dbh+ nTS neurons by injecting AAV2/retro-flex-hM4D-mCherry bilaterally into NA of Dbh-cre mice. m,n, FlexiVent, n = 3 vehicle and n = 4 CNO mice, unpaired t-test, for Ers (n), at 12 mg ml−1 MCh, P = 0.0127; at 24 mg ml−1 MCh, P < 0.0001 for both Rrs (m) and Ers (n); NS for all other pairs. o, Scheme for chemogenetic activation of Chat+ neurons in bilateral NA. p, AAV-DIO-hM3D-mCherry signals. q,r, FlexiVent, n = 4 fourth HDM, n = 11 fourth CNO and n = 4 fourth saline mice, multiple-comparisons one-way ANOVA (Bonferroni post hoc test), for Rrs (q), at 12 mg ml−1 MCh, P < 0.0001 between fourth HDM and fourth saline, P = 0.0092 between fourth CNO and fourth saline, P = 0.0081 between fourth HDM and fourth CNO; at 24 mg ml−1 MCh, P < 0.0001 for all comparisons; for Ers (r), at 12 mg ml−1 MCh, P = 0.0022 between fourth HDM and fourth saline, P = 0.0145 between fourth HDM and fourth CNO; at 24 mg ml−1 MCh, P = 0.0371 between fourth CNO and fourth saline, P < 0.0001 for remaining pairs; NS for all other pairwise comparisons. Data are mean ± s.e.m., two-sided for unpaired t-test. Scale bars, 500 µm (a,b), 100 µm (c,i,p), 200 µm (f, 50 µm in magnified views; g, 100 µm in magnified views). Source Data
Fig. 6
Fig. 6. Blocking noradrenaline receptors in the NA blunted allergen-induced airway hyperreactivity.
a, UMAP plot of our snRNA-seq data integrated with published datasets,. b, Dotplot showing top marker genes from the integrated dataset which overlap with those in published datasets,. Using default Seurat dotplot settings (Methods), percentage expressed was plotted from 0 to 30% detected, and the colour bar shows the average of the scaled normalized expression values across cells in a given cluster. c,d, Double RNAscope of NA showing overlap (arrowheads) for Adra1a (c) and Adra1b (d). e,f, Feature plots of Adra1a (e) and Adra1b (f). g,h, Injection of CTB488 into dorsal trachea in wild-type mouse labelled NA neurons for Adra1a (g) and Adra1b (h). i, Experimental scheme for noradrenaline receptor antagonist treatment. j,k, FlexiVent, n = 5 vehicle, n = 7 prazosin and n = 6 terazosin mice, multiple-comparisons one-way ANOVA (Bonferroni post hoc test), for Rrs (j), at 12 mg ml−1 MCh, P = 0.0017 prazosin versus vehicle, P = 0.0348 terazosin versus vehicle; at 24 mg ml−1 MCh, P < 0.0001 prazosin or terazosin versus vehicle; for Ers (k), at 12 mg ml−1 MCh, P = 0.0288 prazosin versus vehicle; at 24 mg ml−1 MCh, P < 0.0001 prazosin or terazosin versus vehicle; NS for all other pairwise comparisons. l, Experimental scheme for chemogenetic activation of the Dbh+ nTS neurons and delivering noradrenaline receptor antagonists into the NA of the same mouse. m,n, FlexiVent, n = 3 vehicle, n = 3 prazosin and n = 3 terazosin mice, multiple-comparisons one-way ANOVA (Bonferroni post hoc test), for Rrs (m), at 12 mg ml−1 MCh, P = 0.0047 prazosin versus vehicle, P = 0.0014 terazosin versus vehicle; at 24 mg ml−1 MCh, P = 0.0002 prazosin versus vehicle, P < 0.0001 terazosin versus vehicle; for Ers (n), at 12 mg ml−1 MCh, P = 0.0010 prazosin versus vehicle, P = 0.0002 terazosin versus vehicle; at 24 mg ml−1 MCh, P < 0.0001 prazosin or terazosin versus vehicle; NS for all other pairwise comparisons. o, Diagram illustrating multiple nodes of the complete allergen neural circuit. Data are mean ± s.e.m. Scale bars, 100 µm in c,d,g,h. Source Data
Extended Data Fig. 1
Extended Data Fig. 1. nTS neurons were activated after allergen challenge to lung.
(a) PAS staining shows that HDM challenge effectively induced mucus-secreting airway goblet cells (blue), as expected. (b-d) Flow cytometry analyses of innate lymphoid cells (ILC2s), eosinophils (Eos) and T-helper type 2 cells (Th2) from whole lungs after consecutive challenges showing significant increase following HDM, when compared to saline controls. Data are presented as mean values ± SEM. n = 6 (first saline, first HDM, second saline, second HDM, third saline, third HDM), 3 (fourth saline) and 4 (fourth HDM) mice. Unpaired t-test (two-sided) was used between first saline and first HDM, second saline and second HDM, third saline and HDM, fourth saline and fourth HDM, separately. For b, P = 0.0012 (1st), P < 0.0001 (2nd), P = 0.0002 (3rd), P = 0.0052 (4th), for c, P = 0.0022 (1st), P = 0.0001 (2nd), P < 0.0001 (3rd), P = 0.0027 (4th), for d, P = 0.0369 (1st), P = 0.0004 (2nd), P < 0.0001 (3rd), P = 0.0005 (4th). (e-x) FOS antibody staining two hours after the fourth challenge in serial sections of the whole brainstem. Increased FOS+ cells were enriched in the nTS region from Bregma −7.20 to −8.08 mm in HDM-treated mice (outlined in yellow) compared to the saline-treated control mice. Outlines delineate nTS regions at indicated Bregma levels. (y) Quantification (unpaired t-test, two-sided, P = 0.0003) of total number of FOS+ cells after HDM (n = 11 mice) or saline (n = 5 mice) treatment in the whole nTS regions (Bregma −6.24 mm to −8.24 mm). Scale bars, 100 µm (a), 200 µm (e-x). Source Data
Extended Data Fig. 2
Extended Data Fig. 2. nTS neurons were activated only after repeated allergen challenges to the lung of B6 mice.
(a,b) Fos RNAscope from brainstem section of naïve mice 1.5 h after HDM challenge to lung showing Fos RNA signals are not found in the AP as defined by Gfral (a) or Glp1r (b). (c) FOS antibody staining from brainstem section of Chat-cre; Ai14 mice 2 h after HDM showing that there is little overlap between FOS+ cells and tdTom+ DMV and 12 N regions. (d) Quantifications of the number of Fos+ neurons in the AP (n = 6 mice), DMV (n = 7 mice) or 12 N (n = 7 mice). (e,h,k) Experiment scheme for the first, second or third HDM challenge in wild-type mice. (f,g,i,j,l,m) FOS antibody staining (f,i,l) and quantification (g,j,m) showing no statistically significant increase of FOS+ cells after the first, second or third HDM challenge. n = 6 mice each, unpaired t-test, NS. (n) Experiment scheme for single saline or HDM challenge in naive mice and tissue collection 30 min after the challenge for Fos RNAscope. (o) No significant difference in the number of Fos+ neurons in the nTS 30 min following a single saline (n = 3 mice) or HDM (n = 3 mice) challenge, unpaired t-test, NS. (p) Experiment scheme for HDM challenge and tissue collection in wild-type mice for Fos RNAscope. (q) The number of Fos+ neurons in the nTS are increased in the HDM-treated (n = 11 mice) group, compared to saline-treated controls (n = 11 mice), unpaired t-test, P = 0.0024. Outlines in a,b,c,f,i and l delineate nTS regions at indicated Bregma levels. Scale bars, 200 µm. Data are mean values ± s.e.m., statistical tests are two-sided. Source Data
Extended Data Fig. 3
Extended Data Fig. 3. Genetic ablation of HDM-activated nTS neurons did not affect goblet cell metaplasia or immune cell infiltration.
(a) Experiment scheme for labeling HDM-activated trapped neurons. (b,c) Representative image (b, nTS outlined) and quantification (c) from sections of TRAP2; Ai14 mice. n = 8 saline and 11 HDM mice, unpaired t-test, P < 0.0001. (d) Quantification of tdTom+ nTS neurons of TRAP2; Ai14 mice after consecutive HDM challenges. n = 5 saline and 10 HDM mice for first 4-OH, 6 saline and 6 HDM mice for both second and third 4-OH, 8 saline and 11 HDM mice for fourth 4-OH, unpaired t-test, P < 0.0001 fourth 4-OH saline versus fourth HDM. NS. for all other pairwise comparisons. (e) Experiment scheme for FOS immunostaining after trapping HDM-activated neurons. (f,g) Representative image (f, nTS outlined) and quantification (g, n = 9 mice) showing the overlap between FOS+ and tdTom+ nTS neurons. Arrowheads indicate tdTomFOS+ nTS neurons. (h) Experiment scheme for rabies retrograde tracing of HDM-activated neurons from nTS. (i,j) Representative vagal ganglia (i) and quantification (j). n = 5 saline and 5 HDM mice, unpaired t-test, P = 0.0373. (k,l) Representative RNAscope (k) or immunostaining (l) images showing TRPV1+GFP+ neurons (arrowheads) in the vagal ganglia of TRAP2 mice after rabies nTS injection and HDM challenge. (m) Experiment scheme for ablating saline-activated, or HDM-activated nTS neurons. (n,o) FlexiVent, n = 4 saline+DTX and 4 HDM + DTX mice, unpaired t-test, at 24 mg ml−1 MCh, P = 0.0002 for Rrs (n) and P = 0.0003 for Ers (o). NS for all other pairwise comparisons. (p) Experimental scheme for DTX ablation of HDM-activated nTS neurons. (q,r) PAS staining (q) and qPCR (r) showing no change in goblet cell metaplasia. n = 3 vehicle and 3 DTX mice, unpaired t-test, NS. (s-u) Flow cytometry analyses of ILC2s, Eos and Th2 (n = 4 vehicle and 7 DTX mice) and qPCR of Il4, Il5 and Il13 (n = 3 vehicle and 3 DTX mice), unpaired t-test, NS for all pairs. Scale bars, 200 µm (b,f,i, k-l), 100 µm (q). Data are mean ± s.e.m., statistical tests are two-sided. Source Data
Extended Data Fig. 4
Extended Data Fig. 4. snRNA-seq provided a transcriptomic atlas of nTS.
(a) Quality control data including nFeature RNA (the number of genes detected in each cell), nCount RNA (the total number of molecules detected within a cell) and mitochondrial percentage of our integrated nTS snRNA-seq datasets. (b) Dot Plot showing little expression of genes enriched in AP (Gfral, Prlhr, Glp1r, Casr and Ntrk1) or DMV (Chat, Gm4881 and Nppb) compared to pan-neuronal marker genes (Rbfox3 and Snap25) in our integrated nTS snRNA-seq datasets. Using default Seurat dotplot settings (Methods), percent expressed was plotted from 0 to 75% detected, and the colour bar shows the average of the scaled normalized expression values across cells in a given cluster. (c) Stacked bar plots showing relative contribution from four replicates of naïve nTS snRNA-seq datasets (Naïve_rep1, Naïve_rep2, Naïve_rep3 and Naïve_rep4). (d-g) Feature plots showing little to no expression of glia marker genes-Gfap (d), Olig1 (e), Aqp4 (f) or Tmem119 (g) in the neuronal clusters. (h-c’) Feature plots (left, h,j,l,n,p,r,t,v,x,z, b’) and RNAscope images (right, i,k,m,o,q,s,u,w,y,a’, c’) showing expression of marker genes in the nTS (outlined) inhibitory clusters. Bregma levels shown are tailored to layers with optimal signal for each marker. Genes validated here by Feature plots or RNAscope were indicated in red in Fig. 2f. Scale bars, 200 µm. Source Data
Extended Data Fig. 5
Extended Data Fig. 5. Dbh+ neurons in the nTS were activated upon allergen challenge to lung.
(a) RNAscope of Dbh on serial sections (each section was at 20 µm thickness, 80 µm interval between sections) of naïve brainstem shows Dbh cover most of the nTS from Bregma −6.96 mm to Bregma −8.08 mm. Dbh is detected in an average of 2,342 ± 169 neurons in the nTS (n = 7 mice). (b) Vagal ganglia of Trpv1-cre mouse after bilateral microinjection of AAV-flex-GFP to the vagal ganglia. n = 6 mice. (c) GFP+ Trpv1+ vagal fibers project to the vicinity of Dbh+ neurons in the nTS. Boxed areas magnified at the bottom. n = 6 mice. (d) Quantification of the number of Dbh+Fos+ neurons in the nTS after HDM challenge to lung by RNAscope. Data are mean values ± s.e.m. n = 5 saline and 10 HDM mice, unpaired t-test (two-sided), P = 0.0004. Dashed circles in a and c outline nTS at indicated Bregma levels. Scale bars, 200 µm. Source Data
Extended Data Fig. 6
Extended Data Fig. 6. Chemical depletion, genetic depletion or genetic inactivation of Dbh+ neurons did not affect goblet cell metaplasia or cytokine gene expressions.
(a) Experiment schemes for FOS+ cells detection after DBH-SAP injection and HDM. (b,c) Representative staining (b) and quantification (c, n = 4 blank-SAP and 4 DBH-SAP mice, unpaired t-test, P = 0.0155) showing reduced FOS+ cells following DBH-SAP treatment. (d) Experiment scheme for flexiVent after DBH-SAP injection and saline treatment. (e,f) FlexiVent, n = 3 blank-SAP and 4 DBH-SAP mice, unpaired t-test, NS. for all pairwise comparisons. (g-k) PAS staining (g) and qPCR (h-k) showing no change in goblet cell metaplasia or expression of type 2 cytokine genes. n = 3 blank-SAP and 3 DBH-SAP mice, unpaired t-test, NS. (l,m) Representative RNAscope (l) and quantification (m, n = 3 mice) showing extensive overlap of signals (arrowheads in l). (n) Experiment scheme for DTX-mediated ablation of Dbh+ neurons in the nTS. (o-s) PAS staining (o) and qPCR (p-s) showing that Dbh+ neuron ablation has no effect on goblet cell metaplasia or expression of type 2 cytokine genes. n = 3 vehicle and 3 DTX mice, unpaired t-test, NS. (t) Experiment scheme for Dbh+ neuron chemogenetic inhibition. (u) Representative AAV-flex-hM4D-mCherry signals in the nTS. (v,w) PAS staining (v) and qPCR (w, n = 3 vehicle and 3 CNO mice, unpaired t-test, NS) showing that chemogenetic inhibition of Dbh+ nTS neurons has no effect on goblet cell metaplasia. (x-b’) Flow cytometry analyses of ILC2s, Eos and Th2, and qPCR from whole lungs showing that chemogenetic inhibition of Dbh+ nTS neurons has no effect on immune cell infiltration. For x-z, n = 5 vehicle and 5 CNO mice, for a’ and b’, n = 3 vehicle and 3 CNO mice, unpaired t-test, NS. (c’) Experiment scheme for control virus AAV-flex-mCherry injection. (d’) Representative AAV-flex-mCherry signals in the nTS. (e’,f’) FlexiVent, n = 3 vehicle and 4 CNO mice, unpaired t-test, NS for all pairwise comparisons. Scale bars, 100 µm (g,o,v), 200 µm (b,l,u, d’). Data are mean values ± s.e.m., statistical tests are two-sided. Source Data
Extended Data Fig. 7
Extended Data Fig. 7. Ablation of Tacr1+ neurons, but not Th+ neurons in the nTS led to reduced airway hyperreactivity.
(a,b) Double RNAscope showing the overlap between Th and Fos (a), Tacr1 and Fos (b) in the nTS at 1.5 h after the fourth HDM challenge to lung. Arrowheads indicate cells with overlapping signals. (c) Quantification of Th+Fos+ (n = 5 mice) and Tacr1+Fos+ (n = 4 mice) neurons as compared to Dbh+Fos+ (n = 10 mice) neurons in the nTS after the fourth HDM challenge to lung by RNAscope. Multiple comparisons under one-way ANOVA (Bonferroni post hoc test), P = 0.0001 between Dbh+Fos+ and Th+Fos+, P = 0.0020 between Dbh+Fos+ and Tacr1+Fos+, NS between Th+Fos+ and Tacr1+Fos+. (d) Representative image showing Dbh+Fos+ neurons and Th+Fos+ neurons have only a few triple overlaps by RNAscope. Arrows indicate Dbh+Fos+ neurons or Th+Fos+ neurons, arrowheads indicate overlapping Dbh+Th+Fos+ neurons. (e) Experiment scheme for genetic ablation of Th+ nTS neurons. (f,g) FlexiVent data showing no effect on airway hyperreactivity after DTX injection. n = 3 vehicle and 4 DTX mice, unpaired t-test (two-sided), NS for all pairwise comparisons. (h) Representative image showing Dbh+Fos+ neurons and Tacr1+Fos+ neurons have clear triple overlaps by RNAscope. Arrowheads indicate overlapping Dbh+Tacr1+Fos+ neurons. (i) Experiment scheme for chemical ablation of Tacr1+ nTS neurons. (j,k) FlexiVent data showing blunted airway hyperreactivity after SSP-SAP treatment. n = 4 blank-SAP and 6 SSP-SAP mice, unpaired t-test (two-sided), for Rrs (j), at 12 mg ml−1 MCh, P = 0.0224, at 24 mg ml−1, P = 0.0254; for Ers (k), at 6 mg ml−1, P = 0.0033, at 24 mg ml−1, P = 0.0297. NS for all other pairwise comparisons. Outlines in a,b,d and h delineate nTS regions at indicated Bregma levels. Boxed areas in d and h are magnified as labeled. Scale bars, 200 µm. Data are mean values ± s.e.m. Source Data
Extended Data Fig. 8
Extended Data Fig. 8. Chemogenetic activation of Dbh+ nTS neurons did not affect goblet cell metaplasia, immune cell infiltration, or respiratory parameters.
(a) Representative mCherry signals (with Dsred antibody staining) following AAV-DIO-hM3D-mCherry injection in the nTS (outlined, no expression in AP). (b) Experiment scheme for repeated chemogenetic activation of Dbh+ nTS neurons. (c,d) FlexiVent, n = 3 HDM, n = 4 CNO*4 and n = 3 Saline mice, multiple comparisons under one-way ANOVA (Bonferroni post hoc test), for Rrs, at 12 and 24 mg ml−1 MCh, P < 0.0001 HDM versus saline or CNO*4, at 24 mg ml−1, P = 0.0010 CNO*4 versus saline, P < 0.0001 for the other two pairs; for Ers, at 12 mg ml−1, P = 0.0016 CNO*4 versus saline, P = 0.0001 HDM versus saline; at 24 mg ml−1, P = 0.0003 CNO*4 versus saline, P < 0.0001 HDM versus saline, P = 0.0034 HDM versus CNO*4. NS for remaining pairs. (e) Experiment scheme for repeated chemogenetic activation of allergen-activated Fos2A-iCreER (TRAP2) neurons. (f,g) FlexiVent, n = 3 HDM, n = 4 CNO*4 and n = 3 saline mice, multiple comparisons one-way ANOVA (Bonferroni post hoc test), for Rrs, at 12 mg ml−1 MCh, P = 0.0162 HDM versus saline, P = 0.0392 HDM versus CNO*4, at 24 mg ml−1, P = 0.0108 CNO*4 versus saline, P < 0.0001 for the other two pairs; for Ers, at 12 mg ml−1, P = 0.0002 HDM versus saline, P = 0.0074 HDM versus CNO*4, at 24 mg ml−1, P = 0.0002 CNO*4 versus saline, P < 0.0001 for the other two pairs. NS for remaining pairs. (h) Experiment scheme for control virus AAV-flex-mCherry injection to the nTS of Dbh-cre mice. (i,j) FlexiVent, n = 3 HDM, n = 3 saline and n = 3 CNO mice, multiple comparisons one-way ANOVA (Bonferroni post hoc test), for Rrs (i), at 12 and 24 mg ml−1 MCh, P < 0.0001 HDM versus saline or CNO; for Ers (j), at 12 mg ml−1, P = 0.0004 HDM versus saline, P < 0.0001 HDM versus CNO, at 24 mg ml−1, P < 0.0001 HDM versus saline or CNO. NS for remaining pairs. (k) Experiment scheme for activation of nTS Dbh+ neurons in naïve mice. (l,m) FlexiVent, n = 5 CNO versus n = 3 vehicle mice, unpaired t-test (two-sided), NS. (n) Experiment scheme for activation of nTS Dbh+ neurons in sensitized mice. (o,p) PAS staining (o) and qPCR (p). n = 3 mice for each group, unpaired t-test (two-sided), P = 0.0058 HDM versus saline, P = 0.0078 HDM versus CNO; NS CNO versus saline. (q-u) Flow cytometry (q and s, n = 4 saline, n = 4 HDM and n = 6 CNO; r, n = 6 saline, n = 6 HDM and n = 8 CNO) and qPCR (t,u, n = 4 saline, n = 3 HDM and n = 3 CNO). Multiple comparisons under one-way ANOVA (Bonferroni post hoc test), for q, P = 0.0144 HDM versus saline, P = 0.0040 HDM versus CNO; for r, P = 0.0261 HDM versus saline, P = 0.0141 HDM versus CNO; for s, P = 0.0256 HDM versus CNO; for t, P = 0.0344 HDM versus saline; for u, P = 0.0169 HDM versus saline, P = 0.0131 HDM versus CNO. NS for remaining pairs. (v-b’) Measurements of respiratory parameters. n = 3 mice for each group, multiple comparisons under one-way ANOVA (Bonferroni post hoc test), NS. Scale bars, 200 µm (a), 100 µm (o). Data are mean values ± s.e.m. Source Data
Extended Data Fig. 9
Extended Data Fig. 9. Parasympathetic neurons in the NA project to the airway-innervating postganglionic neurons.
(a-c) tdTom+ fibers from Fig. 5a were absent in the lung (a), while present in the lateral parabrachial nucleus (PBN, b) and dorsal raphe nucleus (DR, b) and arcuate hypothalamic nucleus (ARC, c). 3 V, the third ventricle. Yellow boxed areas are magnified on the right. (d-g) tdTom+ neurons/ganglia (arrowheads) reside in the trachea, main bronchi (d) and main airway entrance (hilum) of lung lobes (e-g) of Chat-cre; tdTomato mice. (h) tdTom+ nerves innervate postganglionic parasympathetic ganglia (VAChT+, arrowhead) in the extrapulmonary airway, rather than directly on smooth muscle cells (SMA+). (i,j) Zsgreen+ parasympathetic nerve terminals near both airway smooth muscles and immune cells. (k) Stereotaxic injection of AAV-flex-tdTomato into bilateral DMV (also labeled neurons in ventral adjoining 12 N) of Chat-cre mice. Yellow boxed area was magnified on the right, ovals outline DMV regions. (l) tdTom+ nerves were found passing through the space between trachea and esophagus (arrowheads). n = 3 mice for a-l. (m) Experiment scheme for measuring airway hyperreactivity after repeated chemogenetic activation of Chat+ neurons in the NA. (n,o) FlexiVent, n = 3 fourth HDM, 4 fourth CNO*4 and 3 fourth saline mice, multiple comparisons under one-way ANOVA (Bonferroni post hoc test), for Rrs (n), at 12 mg ml−1 MCh, P < 0.0001 fourth HDM versus fourth saline or fourth CNO, at 24 mg ml−1, P = 0.0002 fourth CNO*4 versus fourth saline, P < 0.0001 for remaining pairs; for Ers (o), at 12 mg ml−1, P = 0.0238 fourth HDM versus fourth saline, at 24 mg ml−1, P = 0.0014 fourth HDM versus fourth CNO*4, P < 0.0001 for remaining pairs. NS for all other pairs. (p) Experiment scheme for CNO activation of NA Chat+ neurons in naïve mice. Both groups received the 1st–3rd saline challenge. (q,r) FlexiVent, n = 3 fourth saline and 6 fourth CNO mice, unpaired t-test (two-sided), NS for all pairs. Scale bars, 500 µm (a,d-g), 200 µm (b-c,i,j,k,l), 100 µm (h). Data are mean values ± s.e.m. Source Data
Extended Data Fig. 10
Extended Data Fig. 10. Modulation of Calb1+ neurons or parasympathetic neurons in the DMV did not affect allergen-induced airway hyperreactivity.
(a) Experiment scheme for chemogenetic inhibition of Calb1+ neurons. Bi-DMV, bilateral DMV. (b) AAV-flex-hM4D-mCherry signals in the NA of Calb1-cre mouse. VAChT stains for cholinergic neurons in the NA. (c,d) FlexiVent, n = 4 HDM and 4 CNO mice, unpaired t-test (two-sided), NS for all pairs. (e) Experiment scheme for chemogenetic activation of Calb1+ neurons. (f) AAV-DIO-hM3D-mCherry signals in the NA of Calb1-cre mouse. VAChT stains for cholinergic neurons in the NA. (g,h) FlexiVent, n = 3 fourth HDM, 4 fourth CNO and 3 fourth saline mice, multiple comparisons under one-way ANOVA (Bonferroni post hoc test), for Rrs (g), at 12 mg ml−1 MCh, P = 0.0002 fourth HDM versus fourth saline, P = 0.0004 fourth HDM versus fourth CNO, at 24 mg ml−1, P < 0.0001 fourth HDM versus fourth saline or fourth CNO; for Ers (h), at 6 mg ml−1, P = 0.0418 fourth HDM versus fourth CNO, at 12 and 24 mg ml−1, P < 0.0001 fourth HDM versus fourth saline or fourth CNO. NS for all other pairs. (i) Calb1-cre; tdTom labeled neurons. (j) Experiment scheme for chemogenetic inhibition of Chat+ neurons in the DMV. (k,l) FlexiVent, n = 3 HDM and 6 CNO mice, unpaired t-test (two-sided), NS for all pairs. (m) Experiment scheme for chemogenetic activation of Chat+ neurons in the DMV. (n,o) FlexiVent, n = 4 fourth HDM, 4 fourth CNO and 4 fourth saline mice, multiple comparisons under one-way ANOVA (Bonferroni post hoc test), for Rrs (n), at 12 mg ml−1 MCh, P = 0.0023 fourth HDM versus fourth saline, P = 0.0248 fourth HDM versus fourth CNO, at 24 mg ml−1, P < 0.0001 fourth HDM versus fourth saline or fourth CNO; for Ers (o), at 24 mg ml−1, P < 0.0001 fourth HDM versus fourth saline or fourth CNO. NS for all other pairs. (p) UMAP plots of the integrated NA dataset. (q) Stacked bar plots. (r) Representative cryosection of the brainstem showing bilateral cannula implantation (tract indicated by arrowheads) target NA region (VAChT+). Arrowheads in b,f,i, labeled neurons that are outside of the region of the VAChT+ cholinergic NA neurons. Scale bars, 200 µm (b, f,i), 500 µm(r). Data are mean values ± s.e.m. Source Data

Update of

References

    1. McAlexander, M. A., Gavett, S. H., Kollarik, M. & Undem, B. J. Vagotomy reverses established allergen-induced airway hyperreactivity to methacholine in the mouse. Respir. Physiol. Neurobiol.212–214, 20–24 (2015). 10.1016/j.resp.2015.03.007 - DOI - PMC - PubMed
    1. Tränkner, D., Hahne, N., Sugino, K., Hoon, M. A. & Zuker, C. Population of sensory neurons essential for asthmatic hyperreactivity of inflamed airways. Proc. Natl Acad. Sci. USA111, 11515–11520 (2014). 10.1073/pnas.1411032111 - DOI - PMC - PubMed
    1. Talbot, S. et al. Silencing nociceptor neurons reduces allergic airway inflammation. Neuron87, 341–354 (2015). 10.1016/j.neuron.2015.06.007 - DOI - PMC - PubMed
    1. Zhao, Q. et al. A multidimensional coding architecture of the vagal interoceptive system. Nature603, 878–884 (2022). 10.1038/s41586-022-04515-5 - DOI - PMC - PubMed
    1. McGovern, A. E. et al. Evidence for multiple sensory circuits in the brain arising from the respiratory system: an anterograde viral tract tracing study in rodents. Brain Struct. Funct.220, 3683–3699 (2015). 10.1007/s00429-014-0883-9 - DOI - PubMed

MeSH terms