. 2024 Jul;631(8022):867-875.
doi: 10.1038/s41586-024-07630-7. Epub 2024 Jul 10.

A liver immune rheostat regulates CD8 T cell immunity in chronic HBV infection

Affiliations

A liver immune rheostat regulates CD8 T cell immunity in chronic HBV infection

Miriam Bosch et al. Nature. 2024 Jul.

Abstract

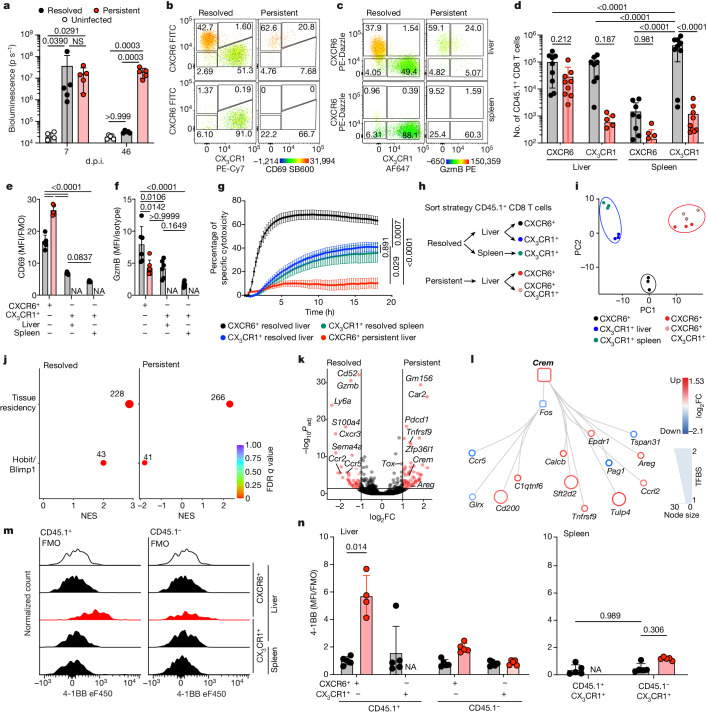
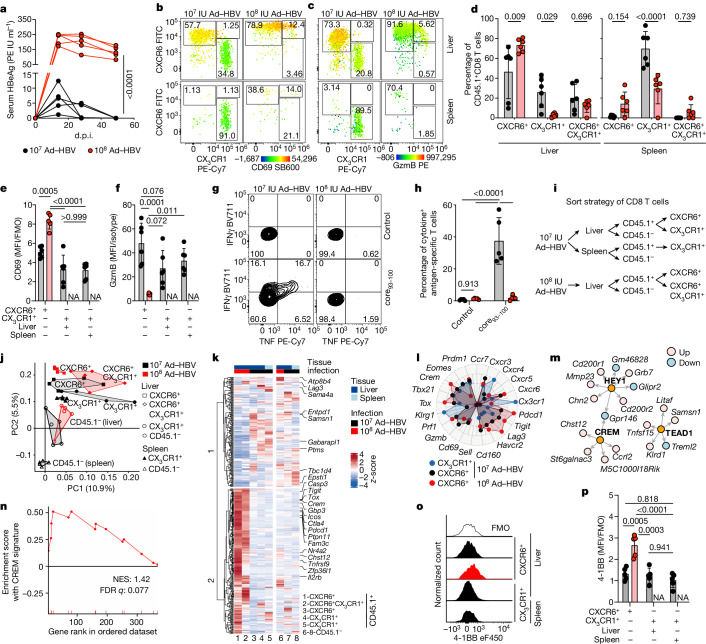
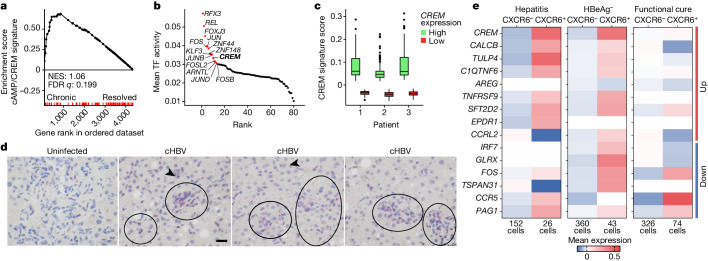
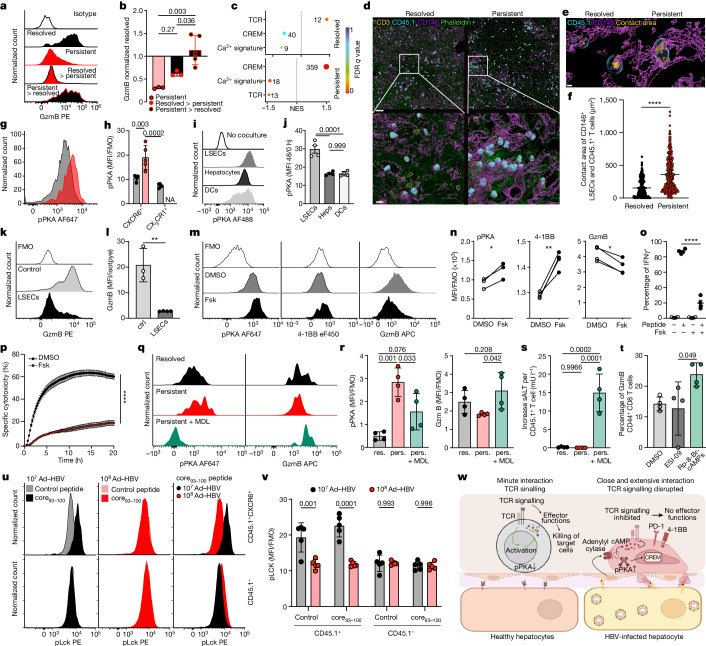
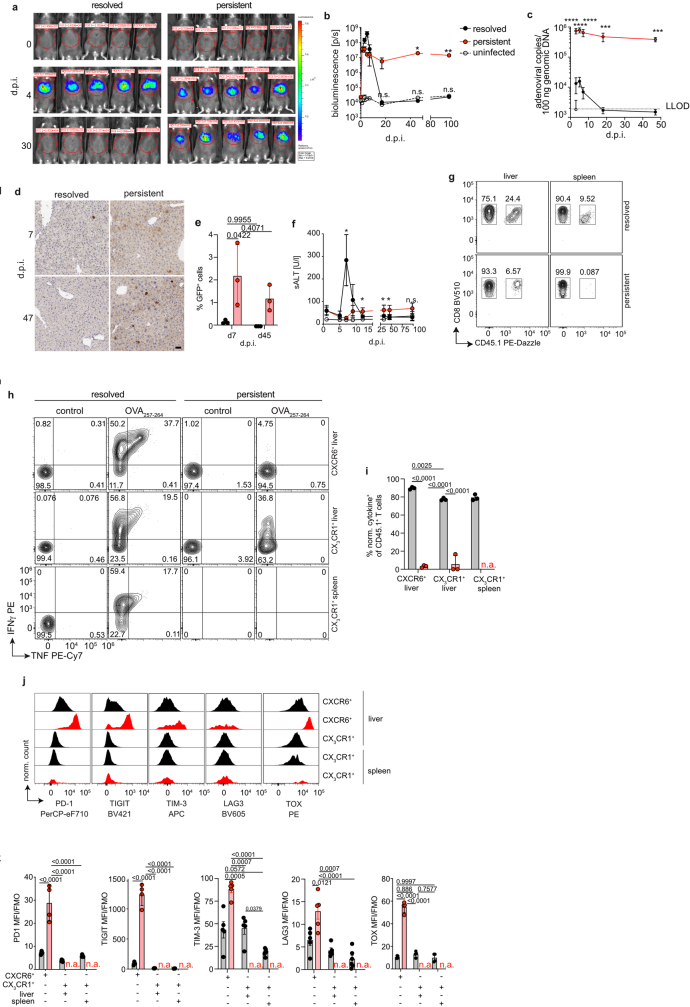
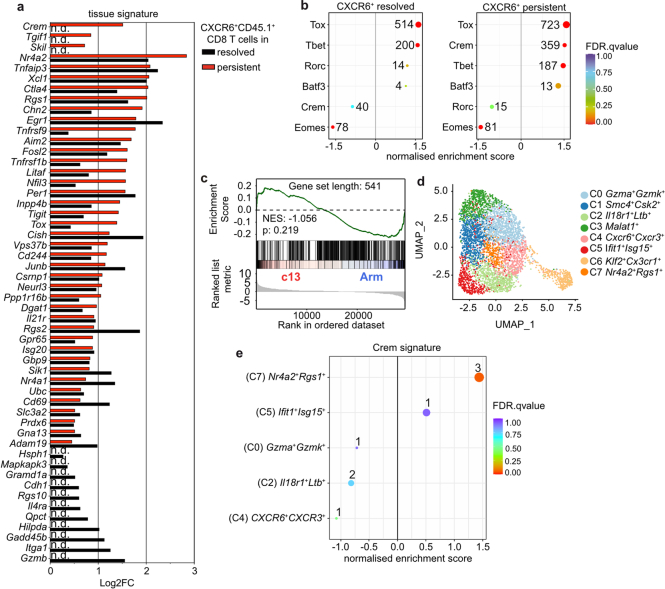
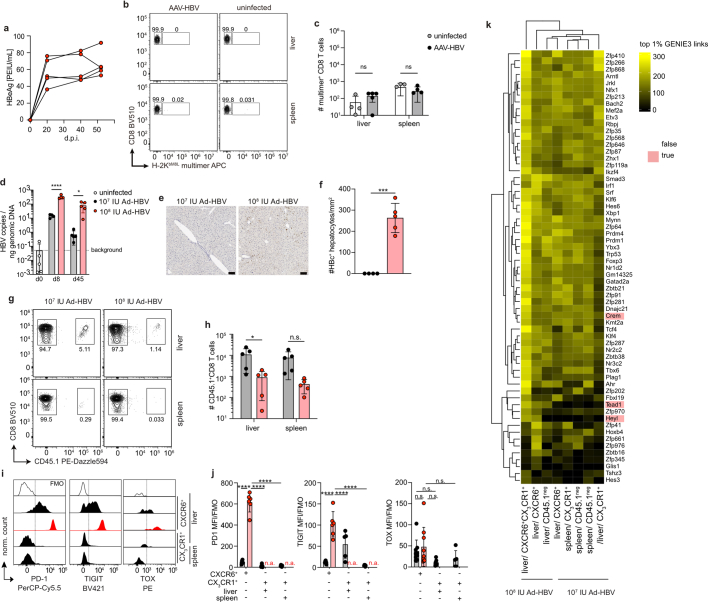
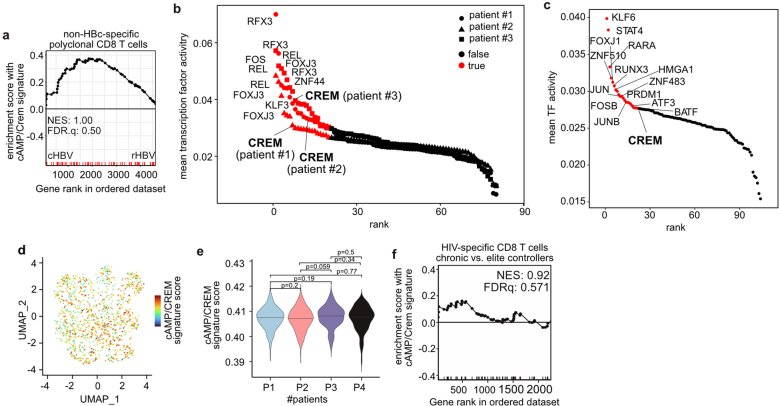
Chronic hepatitis B virus (HBV) infection affects 300 million patients worldwide1,2, in whom virus-specific CD8 T cells by still ill-defined mechanisms lose their function and cannot eliminate HBV-infected hepatocytes3-7. Here we demonstrate that a liver immune rheostat renders virus-specific CD8 T cells refractory to activation and leads to their loss of effector functions. In preclinical models of persistent infection with hepatotropic viruses such as HBV, dysfunctional virus-specific CXCR6+ CD8 T cells accumulated in the liver and, as a characteristic hallmark, showed enhanced transcriptional activity of cAMP-responsive element modulator (CREM) distinct from T cell exhaustion. In patients with chronic hepatitis B, circulating and intrahepatic HBV-specific CXCR6+ CD8 T cells with enhanced CREM expression and transcriptional activity were detected at a frequency of 12-22% of HBV-specific CD8 T cells. Knocking out the inhibitory CREM/ICER isoform in T cells, however, failed to rescue T cell immunity. This indicates that CREM activity was a consequence, rather than the cause, of loss in T cell function, further supported by the observation of enhanced phosphorylation of protein kinase A (PKA) which is upstream of CREM. Indeed, we found that enhanced cAMP-PKA-signalling from increased T cell adenylyl cyclase activity augmented CREM activity and curbed T cell activation and effector function in persistent hepatic infection. Mechanistically, CD8 T cells recognizing their antigen on hepatocytes established close and extensive contact with liver sinusoidal endothelial cells, thereby enhancing adenylyl cyclase-cAMP-PKA signalling in T cells. In these hepatic CD8 T cells, which recognize their antigen on hepatocytes, phosphorylation of key signalling kinases of the T cell receptor signalling pathway was impaired, which rendered them refractory to activation. Thus, close contact with liver sinusoidal endothelial cells curbs the activation and effector function of HBV-specific CD8 T cells that target hepatocytes expressing viral antigens by means of the adenylyl cyclase-cAMP-PKA axis in an immune rheostat-like fashion.


Conflict of interest statement

The authors declare no competing interests.

Figures

Fig. 1
Fig. 1. Dysfunctional hepatic virus-specific CXCR6CD8 T cells characterized by enhanced CREM activity during persistent hepatotropic infection.
a, Liver bioluminescence in vivo imaging of Ad–CMV–GOL (resolved), Ad–TTR–GOL (persistent) infected or uninfected mice. P values determined by one-way analysis of variance (ANOVA) with Tukey’s multiple comparisons per timepoint (n = 5). b,c, Expression of CXCR6, CX3CR1 and either CD69 (b) or GzmB (c) by antigen-specific CD45.1+ CD8 T cells in liver and spleen at 45 days post infection (d.p.i.). df, Quantification of CXCR6 and CX3CR1 (d), CD69 (e) and GzmB (f) expression data from b and c. P values determined by two-way-ANOVA with Tukey’s multiple comparison for adjusted P value (Padj) (n = 8 (d); n = 5 (e); n = 5 (f)). g, Real-time specific cytotoxicity of CD45.1+ CD8 T cells against OVA257–264 peptide-loaded hepatocytes. P values determined by one-way ANOVA with Tukey’s multiple comparison of area under the curve (AUC) for Padj (n ≥ 3). h, Scheme of CD45.1+ CD8 T cell FACSorting for RNA-seq analysis. i, Principal component (PC) analysis of RNA-seq results (n = 3). j, GSEA in liver CD45.1+CXCR6+ CD8 T cells from resolved (left) and persistent (right) infection for a tissue-residency signature and Hobit- and Blimp1-dependent genes (permutation test with Benjamini–Hochberg false discovery rate (FDR)). NES, normalized enrichment score, k, Differentially expressed genes (DEGs) in liver CD45.1+CXCR6+ CD8 T cells during persistent infection or after resolved infection (red, Padj < 1.31 (P < 0.05 Wald test with Benjamini–Hochberg’s correction) and log2-transformed fold change (FC)> 1 or >−1, n = 3). l, Transcription factor network analysis comparing CD45.1+CXCR6CD8 T cells in persistent and resolved infection (n = 3). TFBS, transcription factor-binding site. m,n, 4-1BB expression by virus-specific CD45+ CD8 T cells compared to bulk CD45.1 CD8 T cells at 45 d.p.i. (m) and quantification (n). P values determined by two-way ANOVA with Tukey’s multiple comparison for Padj (n = 5). In ag,m,n, one out of two or more independent experiments shown; NS, not significant, P ≥ 0.05, *P < 0.05, **P < 0.01, ***P < 0.001, ****P < 0.0001. Data are mean and s.d. FMO, fluorescence minus one; MFI, geometric mean fluorescence intensity; NA, not analysed. Source Data
Fig. 2
Fig. 2. A CREM signature in dysfunctional HBV-specific CXCR6CD8 T cells during persistent HBV gene expression in mice.
a, Serum HBeAg concentration after Ad–HBV transduction. PE IU, Paul Erlich Institute units. P values determined by two-way ANOVA with Sidak’s multiple comparison for Padj (n = 5). b,c, Expression of CXCR6, CX3CR1 and either CD69 (b) or GzmB (c) by liver HBcore-specific CD45.1CD8 T cells at 45 d.p.i. Quantification of CXCR6, CX3CR1 (d), CD69 (e) and GzmB (f) expression data from b and c. P values determined by one-way (e,f) or two-way (d) ANOVA with Tukey’s multiple comparison for Padj (n = 6) (d). g,h, Expression of IFNγ and TNF by liver CXCR6+ HBcoreCD8 T cells after ex vivo stimulation with HBcore93–100 peptide (g) and quantification (h). P values determined by two-way ANOVA with uncorrected Fisher’s least significant difference (LSD) test for individual P values (n = 5). i, Scheme of CD8 T cell FACSorting for RNA-seq analysis. j, Principal component analysis of Smart-Seq2 data from sorted HBcore CD8 T cells isolated at 50 d.p.i. (n ≥ 4). k, Hierarchical clustering of DEGs (n ≥ 4, 50 d.p.i., logCPM ≥ 0, FDR < 0.05, logFC ≥ 1). l, Radar plot of selected marker genes. m, Transcriptional regulatory networks inferred by GENIE3 illustrating enhanced expression and transcriptional activity of CREM, HEYl and TEAD1 (n ≥ 4). n, GSEA for the cAMP/CREM signature in liver HBcore-specific CD8 T cells recognizing antigen on hepatocytes. o,p, Expression of 4-1BB by HBcoreCD8 T cells (o) and quantification (p). P values determined by one-way ANOVA with Tukey’s multiple comparison (n = 5). In ah,o,p, one out of two or more independent experiments is shown; P ≥ 0.05, *P < 0.05, **P < 0.01, ***P < 0.001, ****P < 0.0001. Data are mean and s.d. Source Data
Fig. 3
Fig. 3. High CREM expression and CREM transcriptional activity in circulating and hepatic HBV-specific CD8 T cells in patients with chronic hepatitis B.
a, GSEA for the cAMP/CREM signature using Smart-Seq2 results from circulating HBV-specific CD8 T cells isolated from patients with chronic hepatitis B (permutation test with Benjamini–Hochberg FDR). b, Transcription factor (TF) activity inferred using pySCENIC in scRNA-seq results from circulating HBV-specific CD8 T cells from patients with chronic hepatitis B; top 20 active transcription factors shown as red dots. c, CREM transcriptional activity in CREMHBV-specific CD8 T cells from patients shown in b (median, 25th and 75th percentiles, highest and lowest values limited at 1.5× interquartile range shown, two-sided Wilcoxon test with P < 2 × 10−16 comparing high versus low CREM expression for patients 1–3) (n = 3). d, Immunohistochemistry for CD3 (red) and RNAscope detecting CXCR6 (purple) in T cells in livers of patients with chronic hepatitis B (cHBV) (n = 11) compared to uninfected liver tissue (n = 5). Scale bar, 20 µm. e, CREM signature in 977 hepatic HBV-specific CD8 T cells comparing CXCR6 to CXCR6+ CD8 T cells obtained by fine-needle aspiration from 21 patients with continuing hepatitis (HBeAg+ or HbeAg), HbeAg chronic HBV infection and individuals with functional cure from chronic hepatitis B (total of n = 11 patients), numbers of HBV-specific CD8 T cells detected are shown below the graph. Source Data
Fig. 4
Fig. 4. A liver immune rheostat acts on antigen-specific CXCR6+ T cells through an inhibitory adenylyl cyclase–cAMP–PKA axis to disrupt TCR signalling.
a,b, GzmB expression by liver CXCR6+CD45.1CD8 T cells from resolved or persistent infection (30 d.p.i.), transferred into mice with acute-resolving or persistent infection (2 d.p.i.), analysis 18 days after transfer (a) (n = 3 for groups persistent and resolved into persistent transfer, n = 4 for group persistent into resolved transfer) and quantification (b) by one-way ANOVA with Tukey’s multiple comparison for Padj. c, GSEA of liver CXCR6+CD45.1CD8 T cells from resolved or persistent infection (permutation test with Benjamini–Hochberg FDR, n = 3). d,e, Three-dimension-rendered volumetric confocal images of interacting CD45.1+ T cells and CD146+ LSECs at low (d) and high (e) resolution. Scale bars, 50 µm (d, top), 10 µm (d, bottom), and 2 µm (e) (n = 3). f, Quantification of T cell–LSEC contact area (n = 3, unpaired two-sided t-test: P < 0.0001). g,h, Phosphorylated (S114) PKA (pPKA) concentrations in liver CD45.1+CXCR6+ CD8 T cells at 45 d.p.i. (resolved versus persistent infection) (g) and quantification (h) (n = 5, two-way ANOVA with Tukey’s multiple comparison). i,j, Change in pPKA concentrations in CD8 T cells cocultured with liver cells (i) and quantification (j) (n = 4, one-way ANOVA with Tukey’s multiple component for Padj). DCs, dendritic cells; Heps, hepatocytes. k,l, GzmB expression by T cells cocultured with LSECs (k) and quantification (l) (n = 3, unpaired two-sided t-test P = 0.0023). mp, pPKA, 4-1BB and GzmB expression (m,n), IFNγ expression (o) and antigen-specific cytotoxicity (p) by Fsk-treated CD45.1+CXCR6CD8 T cells from resolved infection (n = 4; paired two-sided t-test pPKA P = 0.0323, 4-1BB P = 0.0045, GzmB P = 0.0069 (n); two-way ANOVA with Sidak’s multiple comparison without P = 0.9970, with peptide P < 0.0001 (o); unpaired two-sided t-test on AUCs, P < 0.0001) (p)). q,r, pPKA and GzmB concentrations in virus-specific CD8 T cells treated with the adenylyl cyclase inhibitor MDL-12,330A before transfer into mice with persistent infection, analysis 3 days later (q) and quantification (r) (n = 4, pPKA: ordinary one-way ANOVA with Tukey’s multiple comparison for Padj, GzmB: two-sided unpaired t-test). s, Serum alanine transaminase increase/hepatic CD45.1+/+ CD8 T cell (n = 4, ordinary one-way ANOVA with Tukey’s multiple comparison for Padj). t, GzmB concentrations in PKA-inhibited (Rp-8-bromo-cAMPs) or EPAC-inhibited (ESI-09) CD8 T cells cocultured with LSECs (n = 4, one-way ANOVA with Tukey’s multiple comparison). u,v, Phosphorylated pY394 Lck (pLck) concentrations in hepatic HBcore-specific CD8 T cells after resolved and persistent infection and ex vivo peptide stimulation (u) and quantification (v) (n = 5, two-way ANOVA and Tukey’s multiple comparison). w, Graphical abstract illustrating the function of the liver immune rheostat. Data are mean and s.d. (b,h,j,l,o,rt,v) or mean and s.e.m. (f,p). In ae,gv, one of two or more independent experiments is shown; P ≥ 0.05, *P < 0.05, **P < 0.01, ***P < 0.001, ****P < 0.0001. DCs, dendritic cells. Source Data
Extended Data Fig. 1
Extended Data Fig. 1. Kinetics of infection and frequencies of antigen-specific CD8 T cells during hepatotropic adenoviral infection.
a,b, In vivo bioluminescence imaging kinetic after hepatotropic infection and quantification (two-way ANOVA with Tukey’s multiple comparisons; d0: resolved vs. chronic Padj=0.9295, resolved vs. uninfected Padj=0.0959, chronic vs. uninfected Padj=0.1498; d1: resolved vs. chronic Padj=0.9902, resolved vs. uninfected Padj=0.0209, chronic vs. uninfected Padj=0.1021; d3: resolved vs. chronic Padj=0.2179, resolved vs. uninfected Padj=0.1025, chronic vs. uninfected Padj=0.1269; d5: resolved vs. chronic Padj=0.1413, resolved vs. uninfected Padj=0.1270, chronic vs. uninfected Padj=0.0168; d7: resolved vs. chronic: Padj=0.8271, resolved vs. uninfected Padj=0.5733, chronic vs. uninfected Padj=0.1293; d17: resolved vs. chronic Padj=0.3965, resolved vs. uninfected Padj=0.6564, chronic vs. uninfected Padj=0.3961; d46: resolved vs. chronic Padj=0.0218, resolved vs. uninfected Padj=0.0766, chronic vs. uninfected Padj=0.0219; d98: resolved vs. chronic Padj=0.0087, resolved vs. uninfected Padj=0.8296, chronic vs. uninfected Padj=0.0087; n = 5). c, Quantification of adenoviral copies in liver tissue (two-way ANOVA with Sidak’s multiple comparison, resolved vs. chronic Padj<0.0001 for all timepoints, n = 4). d,e, Liver immunohistochemistry detecting GFP-expressing virus-infected hepatocytes in brown (scale bar 50 µm) and quantification (two-way ANOVA with Tukey’s multiple comparisons for Padj, n = 3). f, Time kinetics of sALT (two-way ANOVA with Tukey’s multiple comparison, d0: uninfected vs. resolved Padj=0.0560, uninfected vs. chronic Padj=0.1210, resolved vs. chronic Padj=0.9971; d5: uninfected vs. resolved Padj=0.5088, uninfected vs. chronic Padj=0.0265, resolved vs. chronic Padj=0.6827: d7: uninfected vs. resolved Padj=0.0981, uninfected vs. chronic Padj=0.3799, resolved vs. chronic Padj=0.0163; d9: uninfected vs. resolved Padj=0.3044, uninfected vs. chronic Padj=0.1871, resolved vs. chronic Padj=0.1963; d12: uninfected vs. resolved Padj=0.0788, uninfected vs. chronic Padj=0.0442, resolved vs. chronic Padj=0.1289; d33: uninfected vs. resolved Padj=0.2294, uninfected vs. chronic Padj=0.1477, resolved vs. chronic Padj=0.0481; d46: uninfected vs. resolved Padj=0.9976, uninfected vs. chronic Padj=0.0102, resolved vs. chronic Padj=0.0809; d98: uninfected vs. resolved Padj=0.9274, uninfected vs. chronic Padj=0.2301, resolved vs. chronic Padj=0.1714; n = 5). g, Gating strategy for antigen-specific CD45.1+ T cells at d45 p.i. after adoptive transfer of 100 naive CD8 T cells on d-1 (n = 4). h,i, IFNγ and TNF expression by liver CD45.1+CD8 T cells at d45 p.i. after ex vivo re-stimulation with OVA257-264 -peptide and quantification (two-way ANOVA with Sidak’s and Tukey’s multiple comparison, n = 4). j,k, PD-1, TIGIT, TIM-3, LAG3 and TOX expression by liver and spleen CD45.1+CD8 T cells at d45 p.i. and quantification (one-way ANOVA with Tukey’s multiple comparison, n ≥ 4) One out of ≥ two independent experiments shown; LLOD = lower limit of detection; not significant (n.s.) p≥0.05, *p < 0.05, **p < 0.01, ***p < 0.001, ****p < 0.0001, errors shown as s.d.; FMO = fluorescence minus one, MFI = geometric mean fluorescence intensity, p.i. = post infection. Source Data
Extended Data Fig. 2
Extended Data Fig. 2. Transcriptional regulation of antigen-specific CD8 T cells after resolved and during persistent hepatotropic viral infection and LCMV infection.
a, Expression of tissue signature genes extracted from GSEA by CD45.1+CXCR6+CD8 T cells (n = 3). b, GSEA of liver CD45.1+CXCR6+CD8 T cells compared to spleen CD45.1+CX3CR1+CD8 T cells (n = 3). c, GSEA for CREM-dependent genes in liver LCMV gp33-specific CXCR6+CD8 T cells after LCMV Armstrong compared to LCMV clone 13 infection (permutation test with Benjamini-Hochberg FDR, n = 3). d,e, UMAP clusters of publicly available scRNA-seq of liver CD8 T cells during persistent LCMV infection and GSEA for CREM transcription factor target genes, no enrichment was found for clusters 1, 3, 6 (permutation test with Benjamini-Hochberg FDR). false discovery rate (FDR). Source Data
Extended Data Fig. 3
Extended Data Fig. 3. Liver CD45.1+CXCR6+CD8 T cells in a preclinical model of persistent versus acute-resolving HBV infection.
a, Serum HBeAg levels in mice after AAV–HBV infection (n = 4). b,c, HBcore-specific multimer+ CD8 T cells in liver and spleen on d≥84 p.i. (AAV–HBV) or uninfected controls and quantification (two-way ANOVA with Sidak’s multiple comparison, n = 4). d, HBV copies in liver tissue on d8 (left) and d45 (right) p.i. (Ad-HBV) (two-way ANOVA with uncorrected Fisher’s LSD, d8 p < 0.0001, d45 p = 0.0434, n = 5). e,f, anti-HBcore immunohistochemistry (brown) detecting HBV-replicating hepatocytes at d45 p.i. (Ad-HBV); scale bar 100 µm and quantification (unpaired two-sided t-test p = 0.0001, 107 IU Ad-HBV n = 4, 108 IU Ad-HBV n = 5). g,h, gating strategy to detect adoptively transferred CD45.1+ TCR-transgenic HBcore-specific CD8 T cells in liver and spleen d45 p.i. (Ad-HBV) and quantification (two-way ANOVA with Sidak’s multiple comparison, liver Padj=0.0311, spleen Padj=0.4872, n = 5). i,j, Expression of PD-1, TIGIT and TOX by HBcore-CD8 T cells in liver and spleen d45 p.i. (Ad-HBV) and quantification (two-way ANOVA with Tukey’s multiple comparison, PD1: liver CXCR6+ 107 vs. liver 108 IU Ad-HBV Padj<0.0001, liver CXCR6+ 108 IU Ad-HBV vs. liver CX3CR1+ 107 IU Ad-HBV Padj<0.0001, liver CXCR6+ 108 IU Ad-HBV vs. spleen CX3CR1+ 107 IU Ad-HBV Padj<0.0001, liver CXCR6+ vs. liver CX3CR1+ 107 IU Ad-HBV Padj=0.7782, liver CXCR6+ vs. spleen CX3CR1+ 107 IU Ad-HBV Padj=0.7807, liver CX3CR1+ vs. spleen CX3CR1+ 107 IU Ad-HBV Padj>0.9999, TIGIT: liver CXCR6+ 107 vs. liver 108 IU Ad-HBV Padj<0.0001, liver CXCR6+ 108 IU Ad-HBV vs. liver CX3CR1+ 107 IU Ad-HBV Padj=0.0177, liver CXCR6+ 108 IU Ad-HBV vs. spleen CX3CR1+ 107 IU Ad-HBV Padj<0.0001, liver CXCR6+ vs. liver CX3CR1+ 107 IU Ad-HBV Padj=0.0427, liver CXCR6+ vs. spleen CX3CR1+ 107 IU Ad-HBV Padj=0.9860, liver CX3CR1+ vs. spleen CX3CR1+ 107 IU Ad-HBV Padj=0.0118, TOX: liver CXCR6+ 107 vs. liver 108 IU Ad-HBV Padj=0.5073, liver CXCR6+ 108 IU Ad-HBV vs. liver CX3CR1+ 107 IU Ad-HBV Padj=0.2543, liver CXCR6+ 108 IU Ad-HBV vs. spleen CX3CR1+ 107 IU Ad-HBV Padj=0.3209, liver CXCR6+ vs. liver CX3CR1+ 107 IU Ad-HBV Padj=0.9849, liver CXCR6+ vs. spleen CX3CR1+ 107 IU Ad-HBV Padj=0.9920, liver CX3CR1+ vs. spleen CX3CR1+ 107 IU Ad-HBV Padj>0.9999, n = 5). k, Inferred upstream transcriptional regulators with GENIE3 (top 1% shown) for SMART-Seq2-transcriptomes of CD45.1neg, CD45.1+CX3CR1+, CD45.1+CXCR6+ and CD45.1+CXCR6+CX3CR1+ CD8 T cells after Ad-HBV infection (n≥4). d-j: one out of ≥ two independent experiments; n.a. = not analysed; p≥0.05, *p < 0.05, **p < 0.01, ***p < 0.001, ****p < 0.0001, not significant (n.s.) errors shown as s.d., FMO = fluorescence minus one, MFI = geometric mean fluorescence intensity, p.i. = post infection. Source Data
Extended Data Fig. 4
Extended Data Fig. 4. Transcriptional profiles of circulating HBV-specific CD8 T cells in patients with chronic Hepatitis B.
a, GSEA for cAMP signalling/CREM dependent genes with non-HBV-specific bulk CD8 T cells in chronic hepatitis B patients compared to patients with resolved infection (n = 5). b,c, Transcription factor activity analysis in circulating HBcore-specific CD8 T cells in two cohorts (n = 3 and n = 4) of chronic hepatitis B patients, top 20 transcription factors with enhanced activity are shown for each patient. d,e, UMAP and Ucell cAMP/CREM signature score analysis for circulating HBcore-specific CD8 T cells from four patients with chronic hepatitis B (Wilcoxon test). f, GSEA for cAMP signalling/CREM dependent genes with CD8 T cells in patients with persistent compared to controlled HIV infection (n = 4). Source Data
Extended Data Fig. 5
Extended Data Fig. 5. CREM/ICER has no checkpoint role to limit effector function in CD8 T cells during persistent hepatotropic infection.
a, Strategy for generation of T cell-specific Icer deficient mice and targeting of the Icer locus among the Crem exons for integration of loxP sites, for details see material and method section. b, Expansion of CD8 T cells from Icerfl/fl and Cd4Cre x Icerfl/fl mice after 24 h stimulation in vitro (unpaired two-sided t-test p = 0.5814, n = 4). c,d, CD25 expression and INFγ production of CD8 T cells from the spleen of Icerfl/fl and Cd4Cre x Icerfl/fl mice after activation for 3 d in vitro followed by 4 h restimulation with PMA/Ionomycin (PI) or anti-CD3/CD28-coated beads (αCD3/28) or left in medium as control (ctrl) (two-way ANOVA with Sidak’s multiple comparison, n = 3). e,f, Monitoring of Ad-TTR-GOL-infected Icerfl/fl and Cd4Cre x Icerfl/fl mice via bioluminescence in vivo imaging and sALT measurements (two-way ANOVA with Šídák’s multiple comparison, n = 5). g, Liver and spleen CD8 T cells from Icerfl/fl and Cd4Cre x Icerfl/fl mice on d30 p.i. (Ad-TTR-GOL) (two-way ANOVA with Šídák’s multiple comparison, Icerfl/fl: n = 7, Cd4CrexIcerfl/fl: n = 9). h, Frequencies of liver antigen-specific multimer+ CD8 T cells in Icerfl/fl and Cd4Cre x Icerfl/fl mice on d30 p.i. (Ad-TTR-GOL) (unpaired two-sided t-test, Icerfl/fl: n = 7, Cd4CrexIcerfl/fl: n = 9). i, INFγ-expressing CXCR6+ CD8 T cells from Icerfl/fl and Cd4Cre x Icerfl/fl mice on d30 p.i. (Ad-TTR-GOL) after re-stimulation with OVA257-264 peptide (one-way ANOVA with Sidak’s multiple comparison, medium Padj=0.9467, OVA257-265 Padj=0.0084, Icerfl/fl: n = 7, Cd4CrexIcerfl/fl: n = 9). j, sALT levels after 108 IU Ad-HBV infection of ICERfl/fl or Cd4Cre x Icerfl/fl mice (two-way ANOVA with Šídák’s multiple comparison, n = 6). k, IFNγ production by liver HBcore-specific CD8 T cells from Cd4Cre x Icerfl/fl or littermate control mice after Cor93-100 peptide restimulation ex vivo (two-way ANOVA with Turkey’s multiple comparison, n = 6). n.a. = not analysed; b-f one out of ≥ two independent experiments shown; p≥0.05, * p < 0.05, **p < 0.01, ***p < 0.001, ****p < 0.0001, not significant (n.s.). errors are shown as SD with mean. Source Data
Extended Data Fig. 6
Extended Data Fig. 6. Impact of the liver tissue rheostat via AC/cAMP/PKA signalling on virus-specific CD8 T cell function.
a, Experimental scheme illustrating the isolation of liver CXCR6+CD45.1+ CD8 T cells at d30 p.i. from mice with resolved or persistent infection that were transferred into mice with Ad–CMV-GOL resolving infection or into mice infected with Ad-TTR-GOL developing a persistent infection (d2 p.i.). b, Confocal volumetric imaging of liver tissue from mice with resolved or persistent infection (d45 p.i.) analysing localization of CD45.1+CD3+ T cells and CD146+ liver sinusoidal endothelial cells (LSECs), phalloidin for staining of cytoskeleton, bar 50 µm (n = 3). c, 3D-rendered surfaces of volumetric confocal microscopy imaging of CD103+CD11c+MHCII+ dendritic cells and CD45.1+ antigen-specific T cells in livers of mice with resolved or persistent infection (d45 p.i.; n = 5) d, Distance between CD45.1+CD3+ T cells and CD146+ LSECs or cDCs (unpaired two-sided t-test p < 0.0001, n = 3). e, Purity of LSECs ( ≥ 98%) isolated from murine livers determined by AcLDL uptake and CD146 expression. f, INFγ expression by HBc-specific CD8 T cells cocultured with Ad-HBV or mock-infected hepatocytes or LSECs pre-treated with supernatant of Ad-HBV or mock-infected hepatocytes before coculture to investigate cross-presentation of HBcore antigen (two-way ANOVA with Tukey’s multiple comparison, LSEC-ctrl vs. LSEC-Ad-HBV p = 0.9987, LCEC-ctrl vs. hepatocytes-ctrl p = 0.9992, LSEC-ctrl vs. hepatocytes-Ad-HBV p < 0.0001, LSEC-Ad-HBV vs. hepatocytes-ctrl p > 0.9999, LSEC-AdHBV vs. hepatocytes-AdHBV p < 0.0001, hepatocytes-ctrl vs hepatocytes-Ad-HBV p < 0.0001, n = 4, mean with SD). g, h, pS114 PKA (pPKA) levels in liver and spleen CD45.1+CD8 T cells on d45 p.i. (two-way ANOVA with Tukey’s multiple comparison, CD45.1+ resolved vs. persistent p = 0.0022, CD45.1neg resolved vs. persistent p = 0.9958, CD45.1+ resolved vs. CD45.1neg resolved p = 0.6024, CD45.1+ persistent vs. CD45.1neg persistent p = 0.0443, CD45.1+ persistent vs. CD45.1neg resolved p = 0.0285, CD45.1+ resolved vs. CD45.1neg persistent p = 0.4709, n = 5, mean with SD) c,h: one out of ≥ two independent experiments shown (n = 5); p≥0.05, *p < 0.05, **p < 0.01, ***p < 0.001, ****p < 0.0001, not significant (n.s.); FMO = fluorescence minus one, MFI = geometric mean fluorescence intensity, p.i. = post infection. Source Data
Extended Data Fig. 7
Extended Data Fig. 7. Increased adenylyl cyclase-cAMP-PKA signalling and disrupted T cell receptor signalling in CXCR6+ CD8 T cells during persistent hepatotropic infection.
a,b, CD39 and CD73 expression by LSECs and quantification (n = 4). c,d, GzmB expression by CD8 T cells co-cultured with activated LSECs for 24 h, T cells were treated with SCH58261 (A2AR antagonist), solvent control, or medium and quantification (one-way ANOVA with Dunnett’s multiple comparison, n = 4, mean with SD). e, Quantification of GzmB expression by CD44+CD8 T cells in coculture with activated LSECs, T cells were treated with PTPN22-IN (PTP22 inhibitor) or solvent control (unpaired two-sided t-test, DMSO: n = 5, PTP22-IN: n = 3, mean with SD). f, prostanoid E2 (PGE2) secretion by mouse LSECs, hepatocytes and dendritic cells (DCs) (one-way ANOVA, Tukey’s multiple comparison, LSECs vs. hepatocytes Padj=0.0214, LSECs vs. DCs Padj=0.0023, hepatocytes vs. DCs Padj=0.7465, LSEC: n = 6, hepatocytes: n = 4, DC: n = 6, mean with SD). g, Quantification of cytokine expression after OVA257-264 peptide stimulation by CD45.1+CXCR6+CD8 T cells isolated from resolved infection and treated with PGE2, Fsk, or solvent control (one-way ANOVA, Tukey’s multiple comparison, DMSO vs. Fsk Padj<0.0001, DMSO vs. PGE2 Padj=0.004, Fsk vs. PGE2 Padj=0.0036, n = 5, mean with SEM). h,i, GzmB expression and quantification by CD44+CD8 T cells in coculture with LSECs and the selective Cox2 inhibitor celecoxib or acetylsalicylic acid (ASS, two-way ANOVA with Tukey’s multiple comparison, ASS vs celecoxib Padj=0.0068, ASS vs ctrl Padj=0.1579, celecoxib vs ctrl Padj=0.0002, n = 5, mean with SD). J, GzmB expression and quantification by CD8 T cells co-cultured with activated LSECs for 24 h after 1 h pre-treatment of T cells with MDL-12330A (MDL), solvent control, or medium and T cells without LSEC contact (one-way ANOVA with Tukey’s multiple comparison no LSEC vs. MDL p = 0.0085, no LSEC vs. DMSO p < 0.0001, no LSEC vs. medium p < 0.0001, MDL vs. DMSO p = 0.0026, MDL vs. medium p = 0.0025, DMSO vs. medium p > 0.9999, n = 4, mean with SD). k, Gating strategy for the reisolation of CD45.1+/+ CD8 T cells activated in vitro for 3 d followed by 1 h pre-treatment with MDL-12,330 A (MDL) or mock before transfer into mice with resolved or persistent infection for 3d (unpaired t-test, n = 4). l,). l, IFNγ+TNF+ CD8 T cells (peptide-stimulated normalized to medium control) after 4 h pre-treatment of activated CD8 T cells with Sp-8br-cAMPS (PKA agonist), 8-pCPT-2′-O-Me-cAMP (EPAC agonist), or solvent control followed by 15 h peptide restimulation (one-way ANOVA with Tukey’s multiple comparison Sp-8br-camps vs, 8-pCPT-2′-O-Me-cAMP Padj=0.1091, Sp-8br-camps vs, DMSO Padj=0.0179, 8-pCPT-2′-O-Me-cAMP vs. DMSO Padj=0.3597, n = 3, mean with SD). M, pPKA levels by liver CXCR6+ NK, NKT or CD4 T cells at d45 after infection with 107 or 108 IU Ad-HBV (two-way ANOVA with Tukey’s multiple comparison, n = 5, mean with SD). n,o, pS473 Akt (pAkt) and pY394 Lck (pLck) levels in virus-specific liver CXCR6+CD8 T cells after ex vivo OVA257-264 peptide restimulation or medium control at d30 p.i. with Ad-CMV-GOL or Ad-TTR-GOL (one-way ANOVA with Sidak’s multiple comparison, pLck ctrl Padj=0.0320, Ova257-264 Padj=0.0315, pAkt ctrl Padj=0.0401, Ova257-264 Padj=0.0087, n = 5, mean with SD). A-o: one out of ≥ two independent experiments shown; p≥0.05, *p < 0.05, **p < 0.01, ***p < 0.001, ****p < 0.0001, not significant (n.s.); FMO = fluorescence minus one, MFI = geometric mean fluorescence intensity, Padj = adjusted p-value. Source Data
Extended Data Fig. 8
Extended Data Fig. 8. Strategy for the generation of a floxed ICER knockout mouse to achieve a T cell-specific ICER knockout.
a, Illustration of the genomic region encompassing the ICER-specific exon as well as the alternative promoters driving expression of ICER and smICER, respectively and of the flanked by loxP sites used for homologous recombination in mouse ES cells. b, illustration of the strategy for generating the Icerfl allele.

Similar articles

Cited by

References

    1. Wiktor, S. Z. & Hutin, Y. J. F. The global burden of viral hepatitis: better estimates to guide hepatitis elimination efforts. Lancet388, 1030–1031 (2016). - PubMed
    1. Thomas, D. L. Global elimination of chronic hepatitis. New Engl. J. Med.380, 2041–2050 (2019). - PubMed
    1. Thimme, R. et al. CD8+ T cells mediate viral clearance and disease pathogenesis during acute hepatitis B virus infection. J. Virol.77, 68–76 (2003). - PMC - PubMed
    1. Fisicaro, P. et al. Targeting mitochondrial dysfunction can restore antiviral activity of exhausted HBV-specific CD8 T cells in chronic hepatitis B. Nat. Med.23, 327–336 (2017). - PubMed
    1. Pallett, L. J. et al. Metabolic regulation of hepatitis B immunopathology by myeloid-derived suppressor cells. Nat. Med.21, 591–600 (2015). - PMC - PubMed

MeSH terms

Substances