. 2024 Aug;632(8023):114-121.
doi: 10.1038/s41586-024-07651-2. Epub 2024 Jul 10.

Repeated plague infections across six generations of Neolithic Farmers

Affiliations

Repeated plague infections across six generations of Neolithic Farmers

Frederik Valeur Seersholm et al. Nature. 2024 Aug.

Abstract

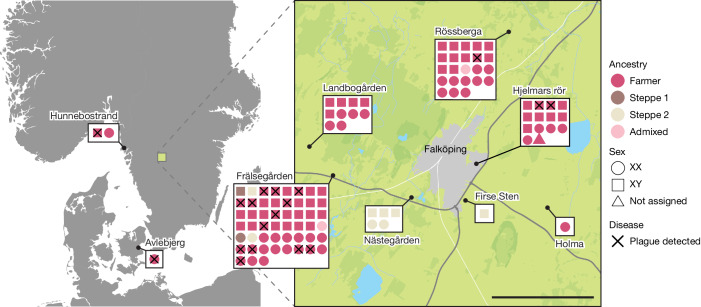
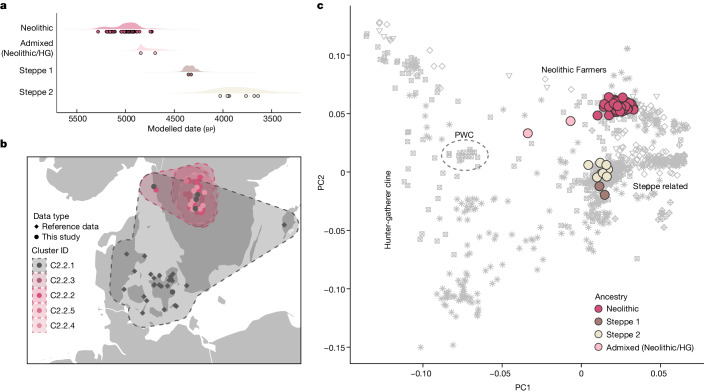
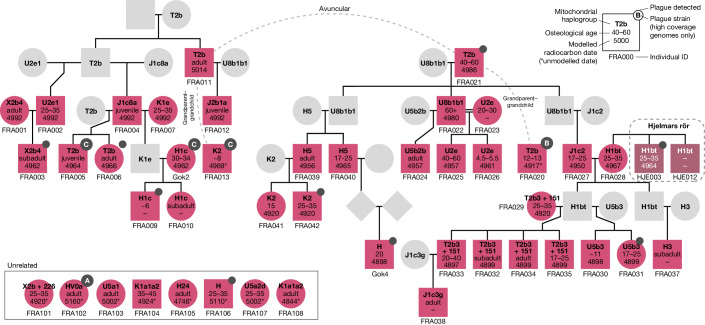
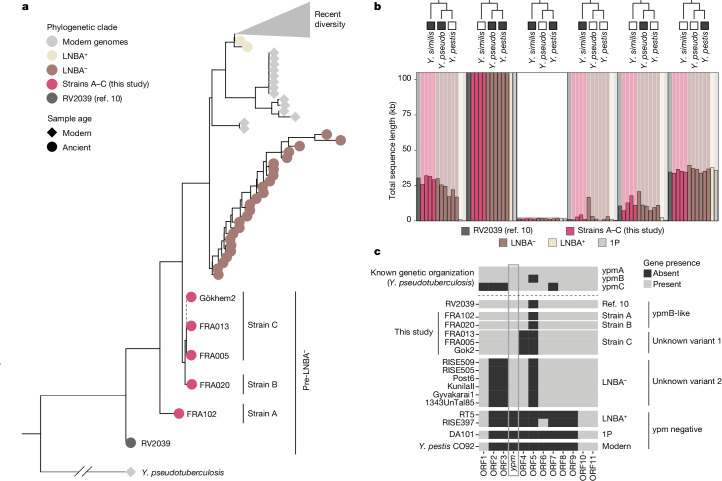
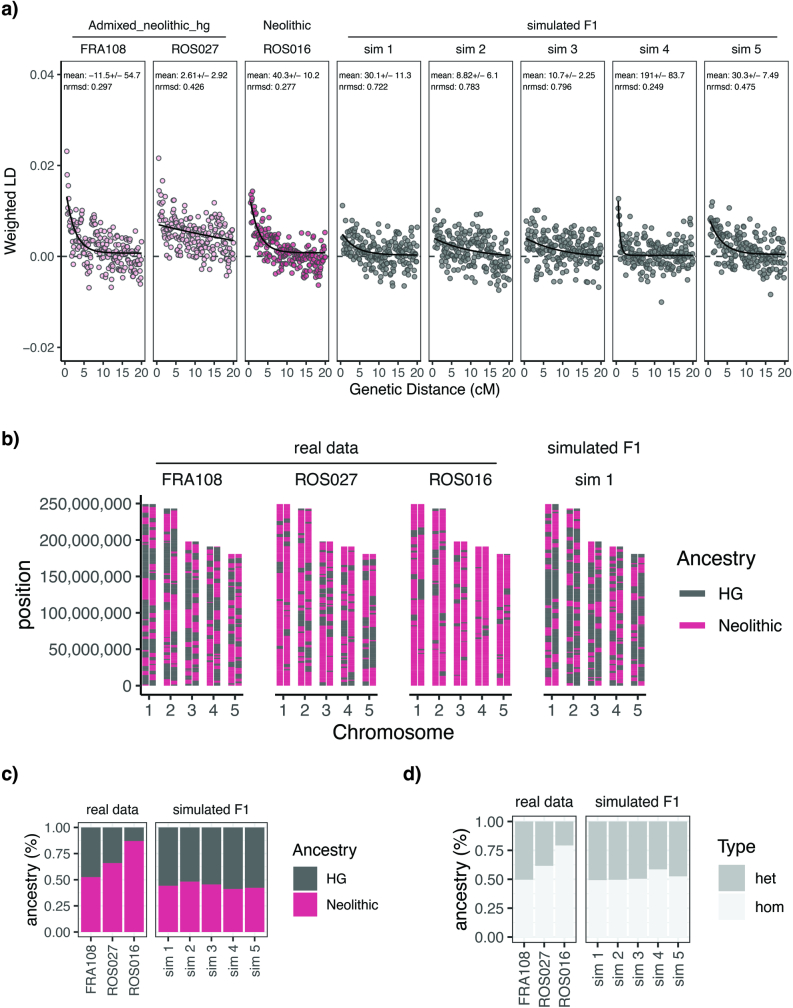
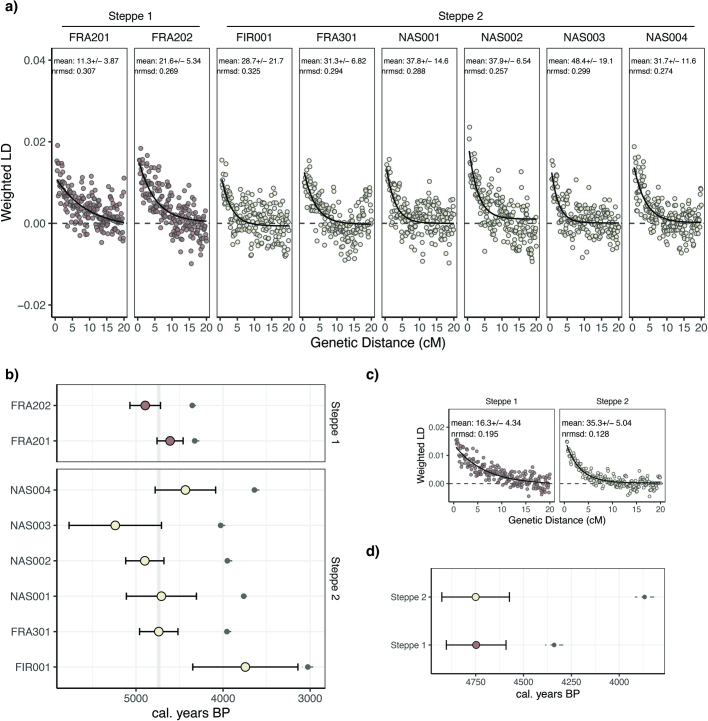
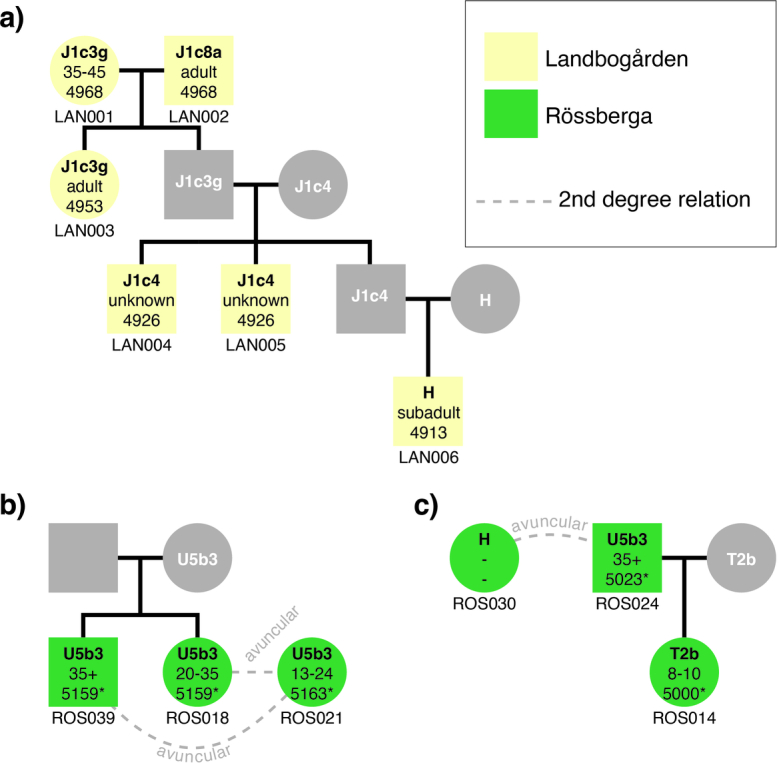
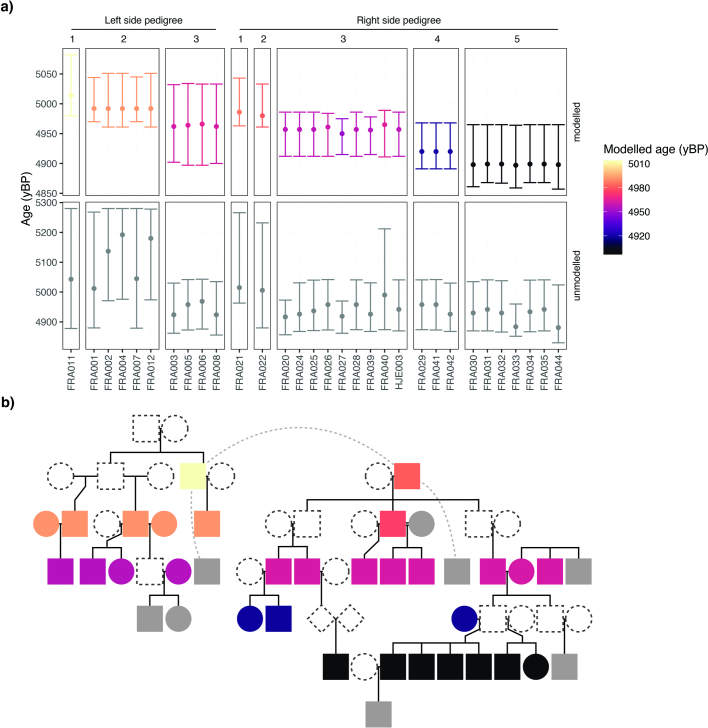
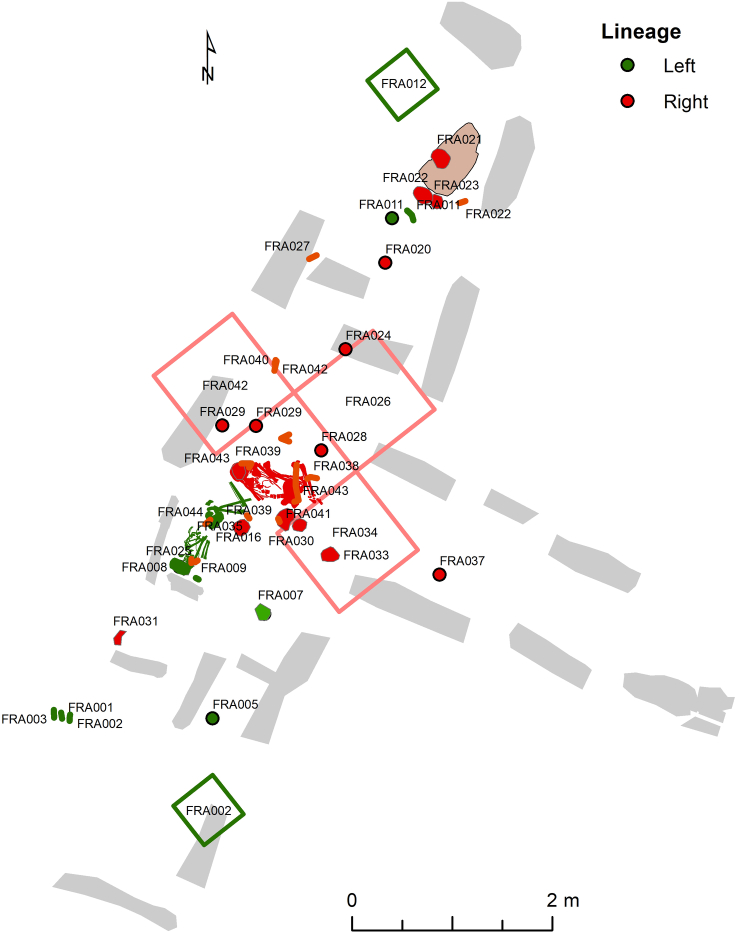
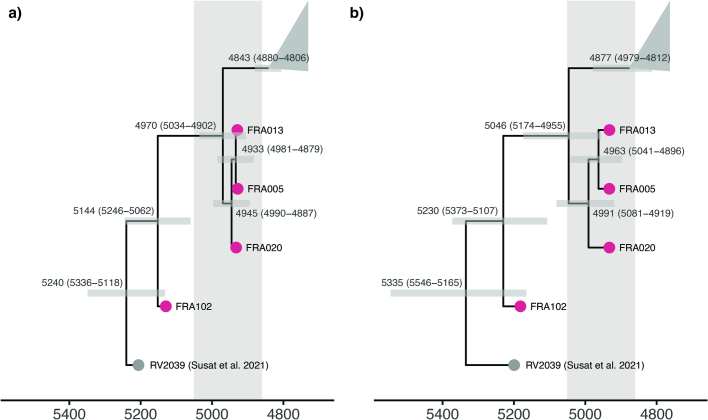
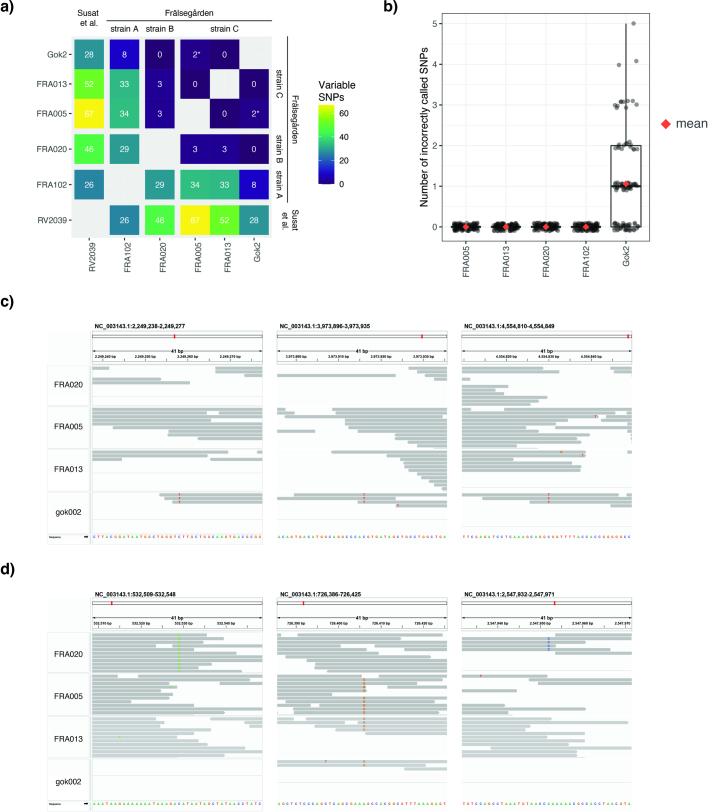
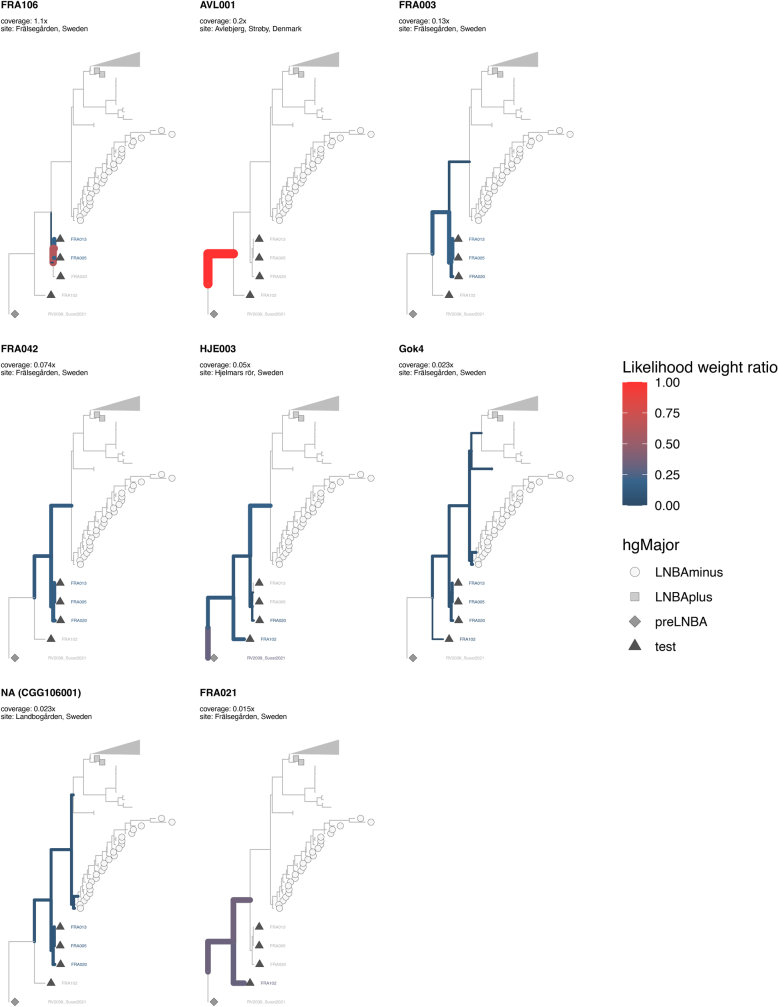
In the period between 5,300 and 4,900 calibrated years before present (cal. BP), populations across large parts of Europe underwent a period of demographic decline1,2. However, the cause of this so-called Neolithic decline is still debated. Some argue for an agricultural crisis resulting in the decline3, others for the spread of an early form of plague4. Here we use population-scale ancient genomics to infer ancestry, social structure and pathogen infection in 108 Scandinavian Neolithic individuals from eight megalithic graves and a stone cist. We find that the Neolithic plague was widespread, detected in at least 17% of the sampled population and across large geographical distances. We demonstrate that the disease spread within the Neolithic community in three distinct infection events within a period of around 120 years. Variant graph-based pan-genomics shows that the Neolithic plague genomes retained ancestral genomic variation present in Yersinia pseudotuberculosis, including virulence factors associated with disease outcomes. In addition, we reconstruct four multigeneration pedigrees, the largest of which consists of 38 individuals spanning six generations, showing a patrilineal social organization. Lastly, we document direct genomic evidence for Neolithic female exogamy in a woman buried in a different megalithic tomb than her brothers. Taken together, our findings provide a detailed reconstruction of plague spread within a large patrilineal kinship group and identify multiple plague infections in a population dated to the beginning of the Neolithic decline.


Conflict of interest statement

The authors declare no competing interests.

Figures

Fig. 1
Fig. 1. Overview of sample locations.
Each individual is represented by coloured shapes, with squares and circles representing males and females, respectively, and triangles representing sex unknown. Colours indicate genetic ancestry and black crosses designate plague-positive individuals. Scale bar, 5 km.
Fig. 2
Fig. 2. Age and ancestry.
a, Median radiocarbon date (years cal. bp) for samples, grouped by genetic ancestry (Supplementary Tables 1 and 4). Shaded area represents distribution of kernel density estimation for the group. b, Geographical distribution of IBD clusters of Scandinavian individuals with Neolithic Farmer ancestry (Supplementary Table 8). c, PCA of genomes sequenced in this study (coloured by ancestry) and a reference panel of 810 previously sequenced ancient shotgun genomes from Europe (grey shading; Supplementary Table 7). HG, hunter-gatherer.
Fig. 3
Fig. 3. Pedigree 1 reconstructed from genomic data.
Squares and circles represent males and females, respectively, and diamonds indicate sex unknown. Information on mitochondrial haplogroup, osteological age estimation and modelled radiocarbon date is indicated inside each shape. Pink and dark mauve indicate the sites Frälsegården and Hjelmars Rör, respectively, with grey representing inferred individuals. Solid black lines indicate first-degree relations, dashed grey lines signify unknown second-degree relationships and double black lines indicate mating between related individuals. Supplementary Fig. 2 shows the full pedigree, including individuals with uncertain kinship. For unrelated individuals, radiocarbon dates are not modelled but are reported only as the median of the calibrated date.
Fig. 4
Fig. 4. Plague genomes.
a, Phylogenetic relationship between previously published plague strains and the data produced for this study. Each circle represents one plague genome, coloured by phylogenetic clade. For clarity, all plague strains more divergent than the LNBA clade are collapsed (grey triangle); Supplementary Fig. 5 shows the full tree. b, Barplot showing the amount of reference graph gene content covered by ancient Y. pestis samples. Reference graph nodes were stratified into groups of presence/absence pattern among modern Y. pseudotuberculosis complex species, indicated by cartoon phylogenies. The shaded background in the plot represents the total length of reference graph nodes for a given group; coloured bars represent the total length of nodes within that group present in a particular sample. Values on the y axis are capped at 100 kb to aid visualization; groups of ancient strains are indicated by bar colour. c, Presence/absence of genes in the unstable genomic region surrounding the superantigen ypm gene in Y. pseudotuberculosis IP 31758. A gene is defined as being present if the ratio of observed over expected breadth of coverage (given the depth of coverage across the genome) is over 10% for that gene–sample combination (Extended Data Fig. 10). 1P, first pandemic.
Extended Data Fig. 1
Extended Data Fig. 1. An investigation of the two admixed individuals.
a) Estimates of admixture timing in admixed and simulated F1-individuals. Admixture time estimates were calculated with DATES using Swedish Neolithic farmer related individuals and PWC individuals as source groups (see methods). One un-admixed individual (ROS016) was included as a control. b) Local ancestry inference of admixed individuals across chromosomes one to five. RFmix estimates of hunter-gatherer (PWC) and Neolithic Swedish ancestries for admixed individuals (FRA108 and ROS027), a Neolithic individual with no evidence of recent admixture (ROS016) and simulated F1 individuals with equal parts HG and Neolithic DNA. To simplify the plot, only chromosomes one to five and one simulated individual is shown. c) Total fraction of each ancestry type across the genome of each individual. d) Total fraction of genotype class across the genome of each individual, where ‘het’ indicates regions where one allele is of HG ancestry while the other is of Neolithic ancestry, while ‘hom’ indicates that both alleles are of the same ancestry.
Extended Data Fig. 2
Extended Data Fig. 2. Estimates of admixture timing in Steppe related Individuals.
Admixture time estimates were calculated with DATES using Swedish Neolithic farmer related individuals and Yamnaya individuals as source groups (see methods). a) Sample-wise weighted linkage disequilibrium measures against genetic distance in centimorgan. In the top right corner of each plot, mean relative admixture time and standard error is shown in generations ago. b) Estimates of absolute admixture time using a generation time of 25 years and the calibrated ages of each sample (Supplementary Table 4; shown in grey). Highlighted in grey is the time period between 4,718 and 4,758 cal. BP where confidence intervals of all samples except FIR001 overlap. c) Weighted linkage disequilibrium measures against genetic distance estimated for the two Steppe related groups. d) Estimates of absolute admixture time for the two Steppe related groups using the average age of samples in each group (shown in grey) as the group age.
Extended Data Fig. 3
Extended Data Fig. 3. Pedigrees from Landbogården and Rössberga.
a) Pedigree 2 from Landbogården. b) Pedigree 3 from Rössberga. c) Pedigree 4 from Rössberga. Squares and circles represent males and females, respectively, and information on mitochondrial haplogroup, osteological age estimate, and radiocarbon date for each individual is indicated inside each shape. Yellow and green colours indicate the sites Landbogården and Rössberga, respectively, while grey colour represents unsampled individuals. Solid black lines indicate first degree relations. Dashed grey lines signify unknown 2nd degree relationships. *For individuals from Rössberga radiocarbon dates could not be modelled, accordingly dates for these individuals are just reported as the median of the calibrated date.
Extended Data Fig. 4
Extended Data Fig. 4. Runs of Homozygosity.
Total length of long Runs of Homozygosity (>0.5 cM) for each individual coloured by ROH size. Plot is split into four panels representing each ancestry group (see Fig. 2).
Extended Data Fig. 5
Extended Data Fig. 5. Chronological modelling.
a) Median ages and 2σ age ranges for modelled and unmodelled dates. Plot is stratified by pedigree branch (left side and right side, respectively) and generation in pedigree. b) Pedigree 1 from Frälsegården coloured by modelled age, following the color scheme of a. Grey color indicates individuals were no modelled age is available. Such individuals with missing data are comprised by 1) individuals that cannot be placed in the pedigree (stippled lines), 2) individuals with dates classified as outliers (Supplementary Table 4), or 3) individuals that are linked to the pedigree through unknown second degree relationships.
Extended Data Fig. 6
Extended Data Fig. 6. Burial locations within the Frälsegården passage grave coloured by lineage.
Green colour represents the left side pedigree from Fig. 3, while red colour represents the right side pedigree. For samples without exact coordinates, the quadrant from which the sample was excavated is plotted instead.
Extended Data Fig. 7
Extended Data Fig. 7. Molecular dating of ancient plague strains.
Dating analysis were carried out on preLNBA strains (grey and pink color) and LNBA- strains (collapsed in grey triangle). The modelled chronological span of the pedigree from Frälsegården is highlighted in grey. a) BEAST analysis using the Coalescent Bayesian Skyline demographic model and assuming an Optimised Relaxed Clock and the GTR substitution model with four gamma categories and empirical frequencies. b) BactDating analysis using the ‘relaxedgamma’ model.
Extended Data Fig. 8
Extended Data Fig. 8. Variation within preLNBA plague strains.
a) Heatmap of pairwise SNP diversity of preLNBA plague strains. Plague genomes identified in this study (from Frälsegården) are divided into strains A, B, and C (see Fig. 4). *Unreliable SNPs (discussed in Supplementary Note 4). b) Number of incorrectly called SNPs from simulated data. For each sample, simulated plague data was generated with the same damage profile and coverage as the real data in 100 replicates. After variant calling the total number of incorrectly called SNPs were counted for each replicate. c) SNPs unique to gok002. d) SNPs unique to FRA020.
Extended Data Fig. 9
Extended Data Fig. 9. Phylogenetic placements of lower-coverage partial genomes (0.01-1x).
Branch colouring and stroke indicates likelihood of placement on a given branch.
Extended Data Fig. 10
Extended Data Fig. 10. Pangenomic analysis of ancient plague genomes.
a-e) Per-gene coverage statistics from Y. pseudotuberculosis complex pangenome variation graphs. Heatmaps showing presence/absence of genes in five genomic regions where ancient Y. pestis lineages harbour Y. pseudotuberculosis complex pangenome gene content absent in modern Y. pestis. Fill colour indicates the ratio of observed over expected breadth of coverage given the depth of coverage across the genome for each gene and ancient sample. f) Variations in plasmid gene content among select Y. pestis strains. Barplot showing total length of reference graph nodes covered in a given sample. The plot is stratified into categories of reference plasmid presence/absence at a given node, and only nodes covered by any of the three Y. pestis plasmids are shown. I.e. ‘plasmid pCD1:plasmid pYV’ refers to gene content present in both pCD1 (from Y. pestis) and pYV (from P. pseudotuberculosis). Shaded background indicates the total amount of sequence within each class and coloured bars represent the total length of nodes within that category present in a particular sample. Groups of ancient strains are indicated by bar colour (1 P: first pandemic).

References

    1. Kristiansen, K. in The Oxford Handbook of Neolithic Europe (eds Fowler, C. et al.) Ch. 56 (Oxford Univ. Press, 2014).
    1. Müller, J. in Environment and subsistence - forty years after Janusz Kruk’s “Settlement studies” (eds Kadrow, S. & Włodarczak, P.) 493–506 (Dr. Rudolf Habelt GmbH, 2013).
    1. Colledge, S., Conolly, J., Crema, E. & Shennan, S. Neolithic population crash in northwest Europe associated with agricultural crisis. Quat. Res.92, 686–707 (2019).
    1. Rascovan, N. et al. Emergence and spread of basal lineages of Yersinia pestis during the Neolithic Decline. Cell176, 295–305 (2019). - PubMed
    1. Shennan, S. et al. Regional population collapse followed initial agriculture booms in mid-Holocene Europe. Nat. Commun.4, 31–34 (2013). - PMC - PubMed

Publication types

Substances

LinkOut - more resources