. 2024 Jul;631(8021):654-662.
doi: 10.1038/s41586-024-07623-6. Epub 2024 Jul 10.

Emergence of large-scale cell death through ferroptotic trigger waves

Affiliations

Emergence of large-scale cell death through ferroptotic trigger waves

Hannah K C Co et al. Nature. 2024 Jul.

Abstract

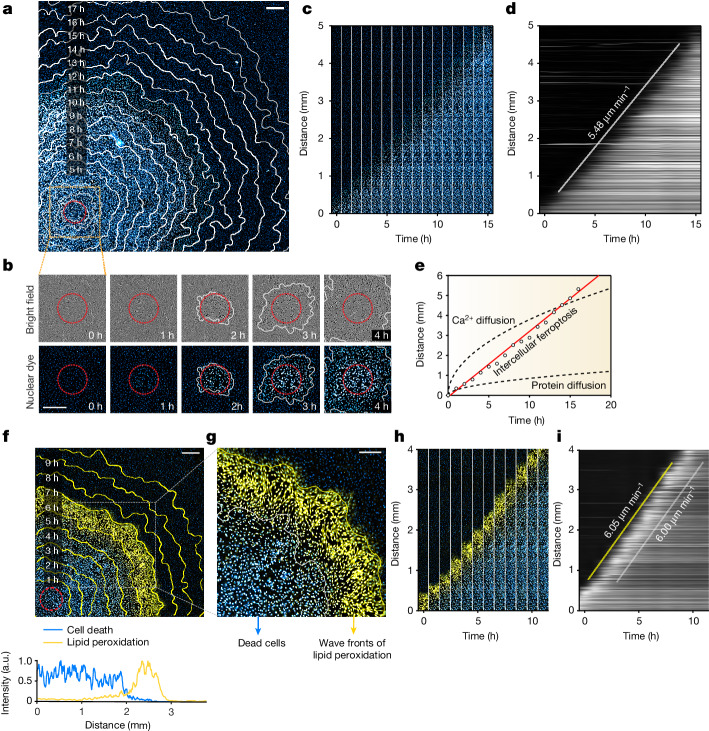
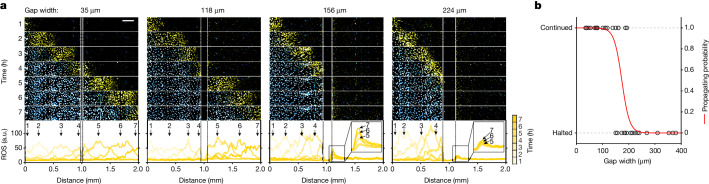
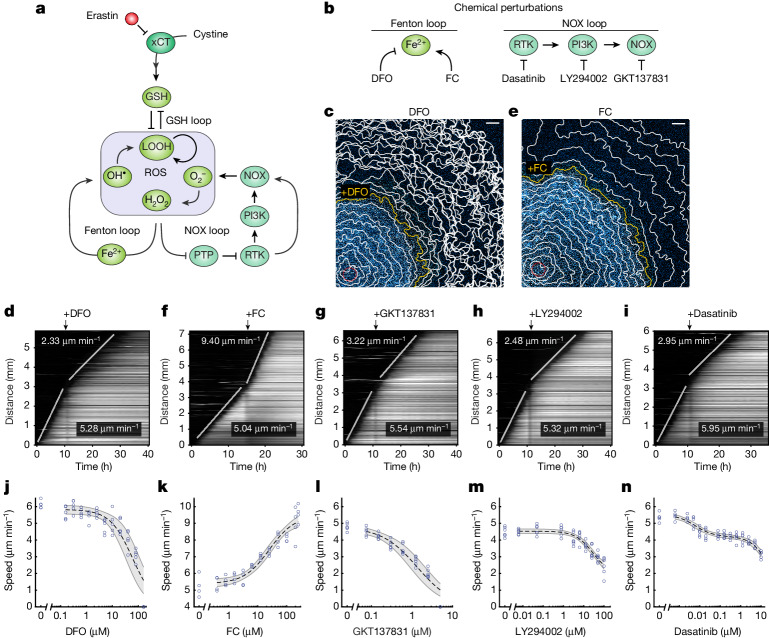
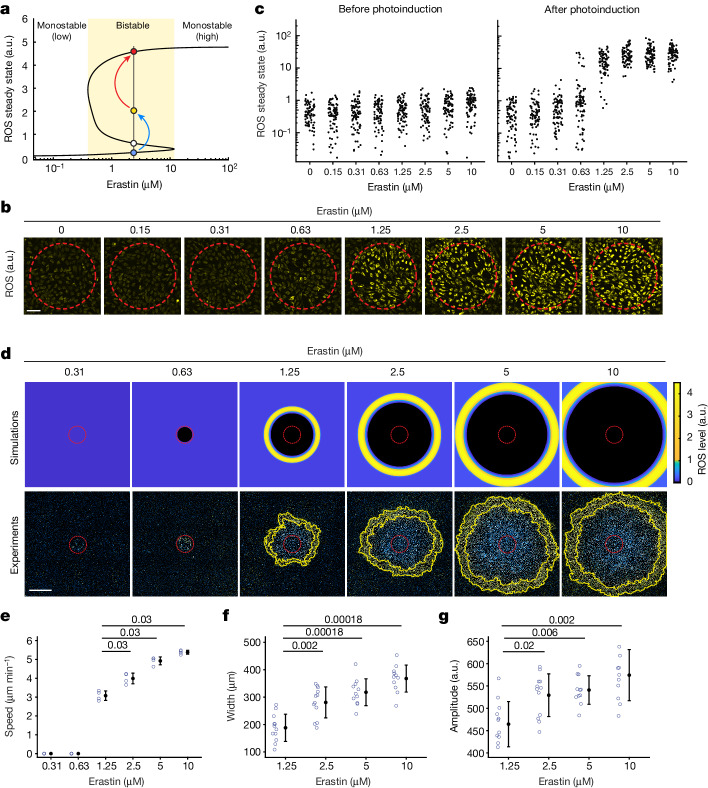
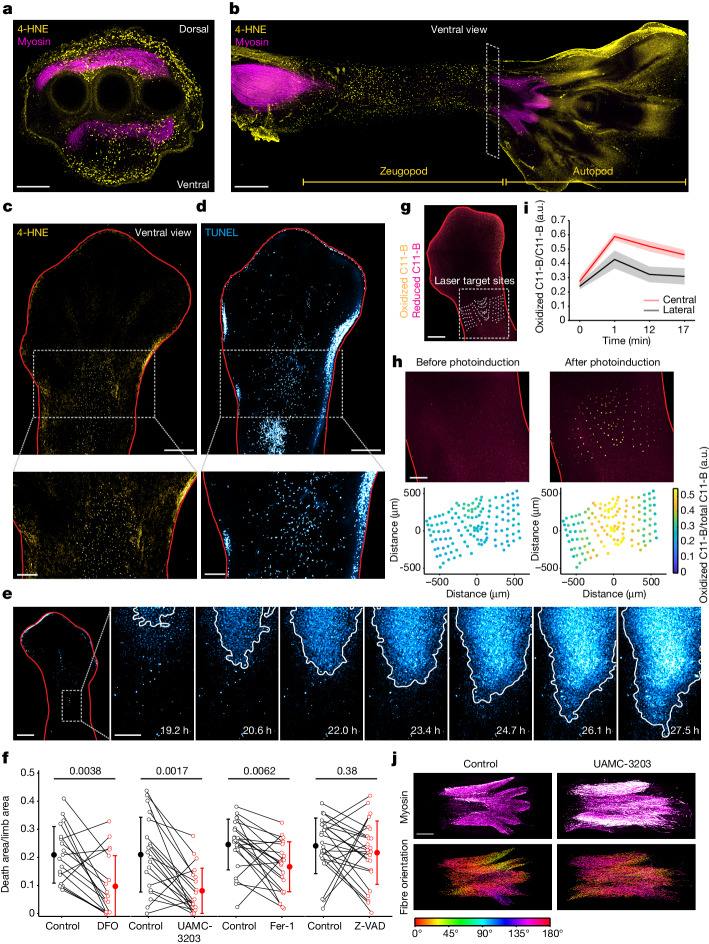
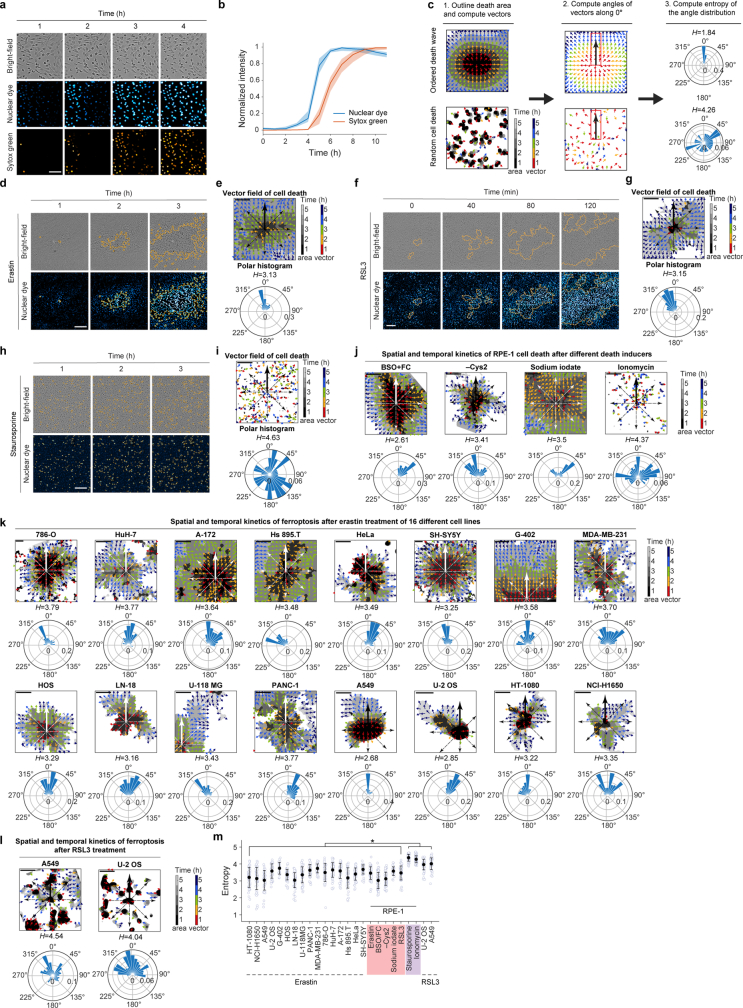
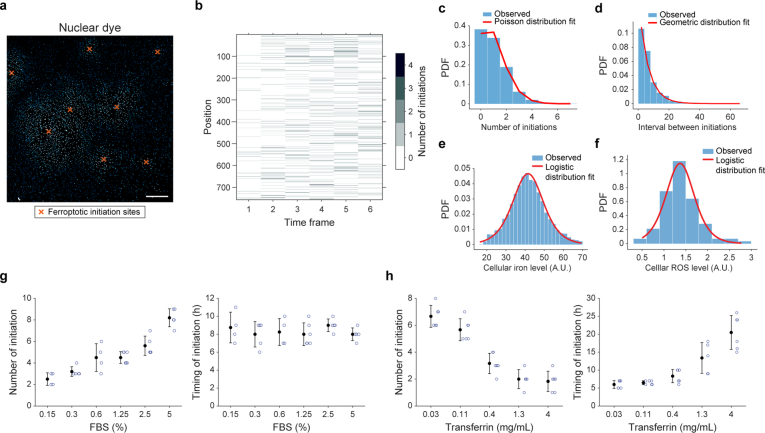
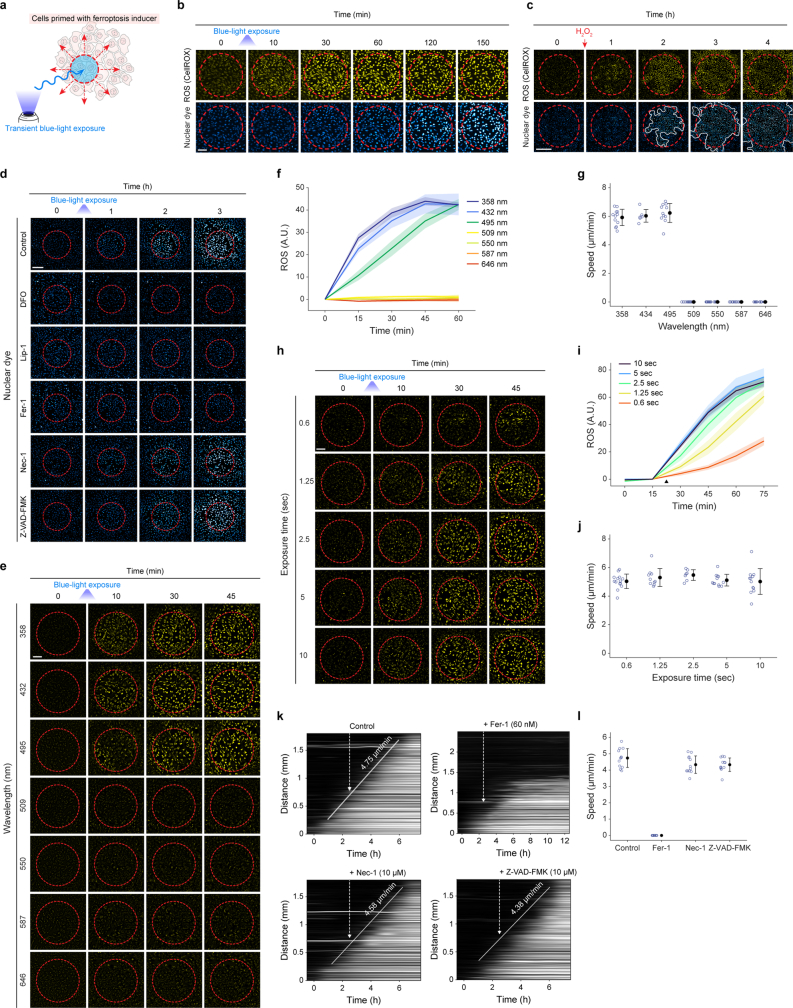
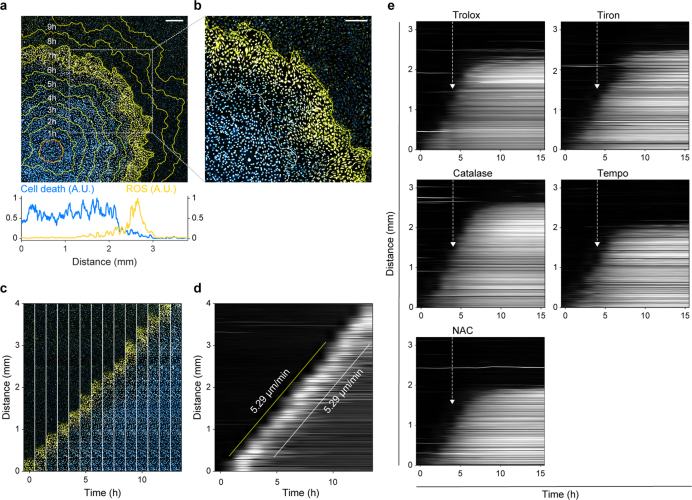
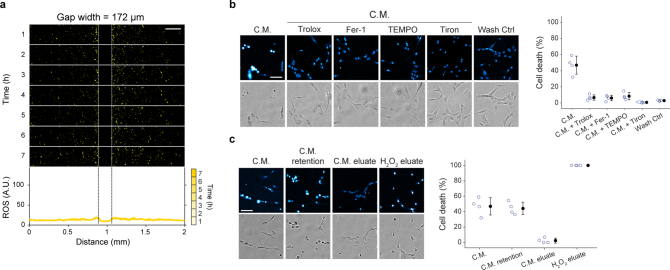
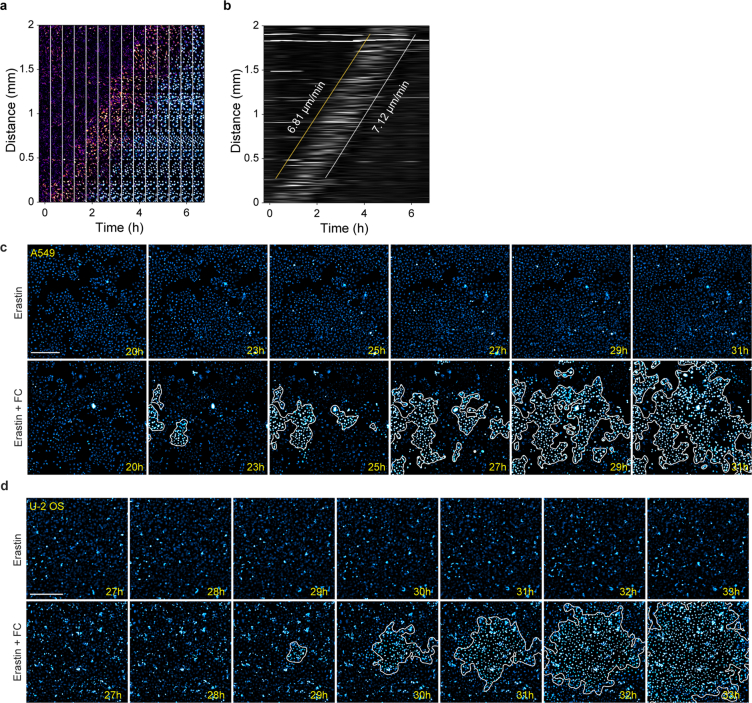
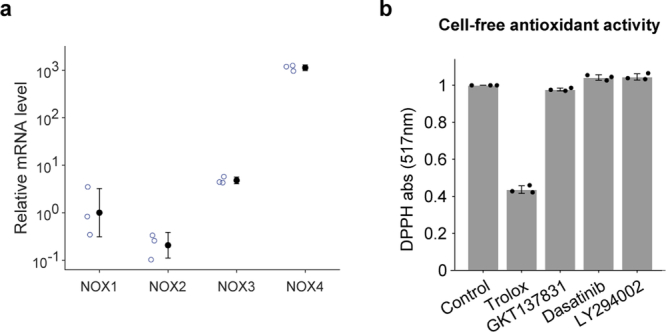
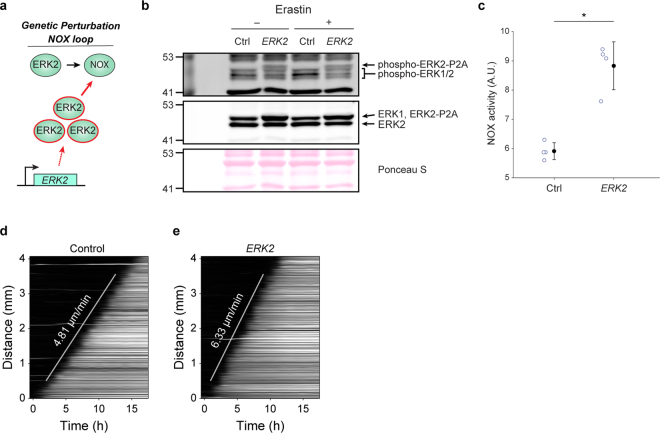
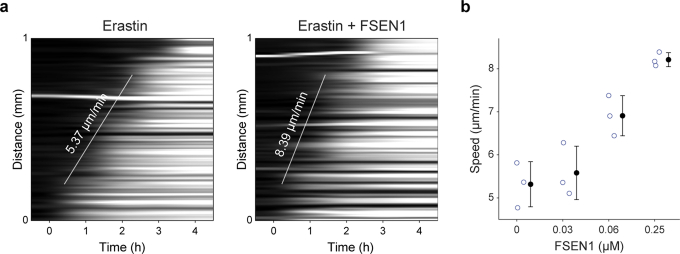
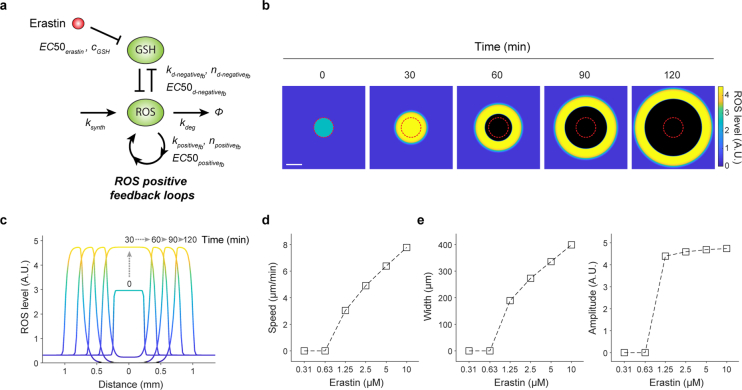
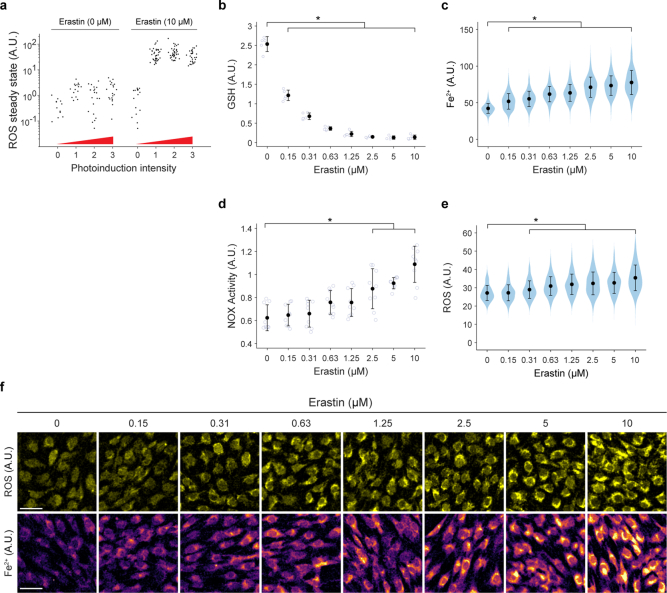
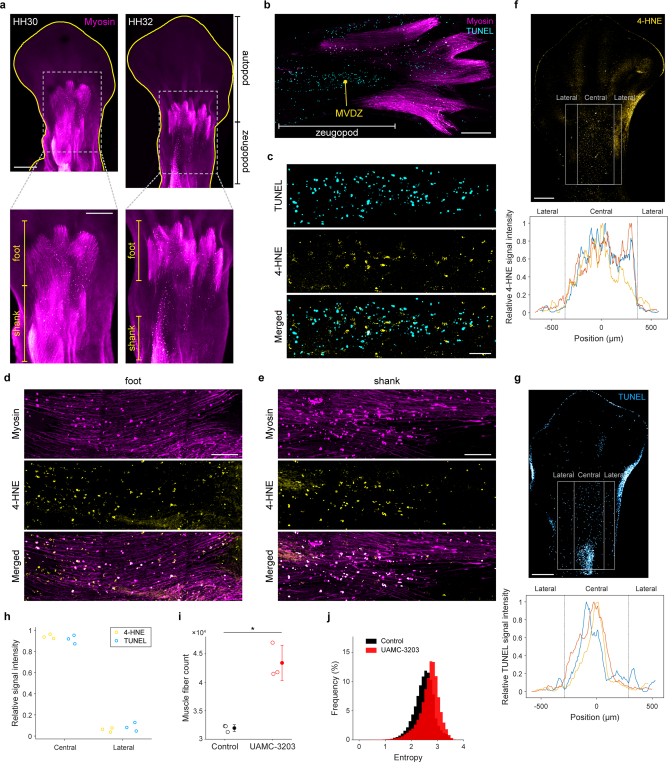
Large-scale cell death is commonly observed during organismal development and in human pathologies1-5. These cell death events extend over great distances to eliminate large populations of cells, raising the question of how cell death can be coordinated in space and time. One mechanism that enables long-range signal transmission is trigger waves6, but how this mechanism might be used for death events in cell populations remains unclear. Here we demonstrate that ferroptosis, an iron- and lipid-peroxidation-dependent form of cell death, can propagate across human cells over long distances (≥5 mm) at constant speeds (around 5.5 μm min-1) through trigger waves of reactive oxygen species (ROS). Chemical and genetic perturbations indicate a primary role of ROS feedback loops (Fenton reaction, NADPH oxidase signalling and glutathione synthesis) in controlling the progression of ferroptotic trigger waves. We show that introducing ferroptotic stress through suppression of cystine uptake activates these ROS feedback loops, converting cellular redox systems from being monostable to being bistable and thereby priming cell populations to become bistable media over which ROS propagate. Furthermore, we demonstrate that ferroptosis and its propagation accompany the massive, yet spatially restricted, cell death events during muscle remodelling of the embryonic avian limb, substantiating its use as a tissue-sculpting strategy during embryogenesis. Our findings highlight the role of ferroptosis in coordinating global cell death events, providing a paradigm for investigating large-scale cell death in embryonic development and human pathologies.


Conflict of interest statement

The authors declare no competing interests.

Figures

Fig. 1
Fig. 1. Ferroptosis propagates across RPE-1 cells at a constant speed through lipid peroxidation wavefronts.
a,b, Ferroptosis initiates from the photoinduction area (red circle) and propagates across erastin-treated cells over 5 mm for 18 h. The contours (white outline) represent the border of cell death at specific timepoints. a, Nuclear dye fluorescence image (11 h after photoinduction) overlaid with contours 2–18 h after photoinduction. b, Time-lapse images of cell death after photoinduction, showing magnified views of the orange box in a. Cell death is indicated by cell rupture (bright field) and increased nuclear dye fluorescence (cyan to white). c,d, Data derived from a. c, Time-lapse image array of ferroptosis propagation. d, Kymograph for ferroptosis propagation. The white line is a linear least-squares fit to the nuclear dye fluorescent fronts, where its slope represents the speed of propagation. e, Comparison of travelling distances over time among ferroptosis propagation and diffusive molecules (Methods). f,g, Merged images of lipid peroxidation (yellow) and nuclear dye fluorescence (cyan). Lipid peroxidation was monitored using C11-BODIPY581/591. The yellow contours represent the border of lipid peroxidation at specific timepoints. f, Image (7 h after photoinduction) overlaid with contours 1–10 h after photoinduction (top). Bottom, fluorescence intensities of cell death and lipid peroxidation quantified across the bottom region of the image. g, Magnified view of the box in f. h, Time-lapse image array of lipid peroxidation and cell death in f. i, Kymograph for lipid peroxidation propagation in f. The slopes of the yellow and white lines represent the speeds of lipid peroxidation and cell death propagation, respectively. Data shown are representative of three biological repeats. Scale bars, 400 μm (a, b and f) and 250 μm (g). Source Data
Fig. 2
Fig. 2. Diffusion of ROS signal as the coupling mechanism for ferroptotic trigger waves.
a, Gaps were created between a wave-initiated region (left) and a non-initiated region (right). Time-lapse image sequence of cell death (cyan) and ROS (yellow) propagation across a gap. ROS was monitored in erastin-treated cells using CellROX dye. The mean fluorescence intensity of ROS was quantified along the 2 mm distance at specific timepoints. Scale bar, 200 μm. b, The probability of a wave passing through different gap widths (35–380 μm). The propagating probability was obtained by fitting the data (from 38 wells) to a logistic model, px=11+eβ0+β1x, where p is the propagating probability and x is the gap width. Gaps were created by scratching the bottom of the plate with needles of different tip sizes (20–400 μm) after wave initiation. The time-lapse video for this experiment is shown in Supplementary Video 5. Data are representative of three biological repeats. Source Data
Fig. 3
Fig. 3. ROS feedback loops modulate the speed of ferroptotic trigger waves.
a, A ferroptosis network includes three ROS feedback loops. b, Chemical perturbations applied to modulate the strength of Fenton and NOX feedback loops in erastin-treated cells. c,d, The speed of ferroptotic trigger waves declines after iron chelation. c, Nuclear dye fluorescence image (11 h after photoinduction) overlaid with cell death contours. The yellow contour indicates the timepoint at which DFO (80 µM) was added. d, Kymograph for the experiment in c. e,f, The speed of ferroptotic trigger waves increases after iron addition. e, Nuclear dye fluorescence image (15 h after photoinduction) overlaid with cell death contours. The yellow contour indicates the timepoint at which FC (250 µM) was added. f, Kymograph for the experiment in e. gi, Addition of GKT137831 (1.25 µM) (g), LY294002 (100 µM) (h) or dasatinib (0.6 µM) (i) slows down ferroptotic trigger waves. jn, Wave speed as a function of DFO (j), FC (k), GKT137831 (l), dasatinib (m) and LY294002 (n) concentrations. The dose–response curves (dashed line) were obtained by fitting the data to a Michaelian inhibition function for DFO, LY294002 and GKT137831; to a Michaelian activation function for FC; and to a biphasic inhibition function for dasatinib (Methods). The shaded area bounded by grey lines represents the 95% confidence interval of model prediction. Data are derived from five (DFO, 0–0.6 µM and 2.5–160 µM), four (DFO, 1.25 µM), four (FC) and six (GKT137831, LY294002, dasatinib) technical replicates. Fitted parameters are shown in Extended Data Table 1. For cn, data are representative of three biological repeats. Scale bars, 500 μm (c and e). Source Data
Fig. 4
Fig. 4. Ferroptosis stress primes cells for ROS bistability and promotes the propagation of ferroptotic trigger waves.
a, In silico simulations showing ROS steady state as a function of erastin concentration. ROS steady state bifurcates from a monostable (low) to a bistable regime (yellow area) with increased erastin concentration. Stable low and high ROS steady states and the USS are denoted by blue, red and white circles, respectively. ROS elevation by photoinduction (blue arrow, elevation from blue to yellow circle) allows cells to surpass the USS, above which ROS is amplified (red arrow) to the high steady state. b, Images of ROS fluorescence (yellow) 20 min after photoinduction at different erastin concentrations. c, Single-cell ROS steady states were measured before and after photoinduction at different erastin concentrations in b. For each erastin level, 80 cells are shown. d, Increasing erastin concentrations promote ROS wavefront propagation. Simulations (top) and experiments (bottom) of ROS propagation in cell populations treated with different erastin concentrations 6 h after photoinduction. eg, Wave speed (e), wavefront width (f) and amplitude (g) at different erastin concentrations. Data are mean ± s.d. For wave speed, four technical replicates; wavefront width and amplitude were measured from twelve directions. Statistical analysis was performed using two-sided Wilcoxon rank-sum tests with false-discovery rate adjustment; P values are shown at the top. For bg, data are representative of three biological repeats. Scale bars, 100 μm (b) and 800 μm (d). Source Data
Fig. 5
Fig. 5. Ferroptosis and its propagation facilitate muscle remodelling in the avian limb.
a,b, Co-immunostaining of lipid peroxidation marker (4-HNE, yellow) and myosin heavy chain (myosin, magenta) in transverse (a) and longitudinal (b) sections (HH33 limbs). The transverse section (a) is located at the zeugopod (box in b). The longitudinal section (b) features the ectodermal layer. c,d, Whole-mount immunostaining of 4-HNE (c) and TUNEL staining (d) in HH32 limbs outlined in red (magnified views are shown at the bottom). e, Nuclear dye fluorescence image (HH31 limb) (left). Right, time-lapse images of cell death (magnified views of the box are shown on the left). f, Cell death area with or without DFO (10 mM, n = 18), UAMC-3203 (1 μM, n = 20), Fer-1 (10 μM, n = 22) and Z-VAD-FMK (200 μM, n = 24). Data are mean ± s.d. Statistical analysis was performed using two-sided Wilcoxon rank-sum tests; P values are shown at the top. g,h, PALP assay of C11-BODIPY581/591 (C11-B)-stained limbs (merged images of oxidized and reduced C11-BODIPY581/591). g, C11-BODIPY581/591-stained limb overlaid with the laser target sites. h, Magnified views of the box in g (top). Bottom, lipid peroxidation levels at target sites in the top images. i, Lipid peroxidation levels in the central (within 100 μm of the centre axis) and lateral (≥350 μm away from the centre axis) regions. Data are mean ± s.d. of 28 (central) and 61 (lateral) target sites. j, Immunostaining of myosin from UAMC-3203-treated and vehicle-control-treated embryos (HH33) (top). Bottom, muscle fibres colour coded according to their orientations. For ae and gj, data are representative of three biological repeats. Scale bars, 200 μm (a, c (bottom), d (bottom), h and e (right seven images)), 400 μm (b, c (top) and d (top)), 500 μm (g), 600 μm (e (left)) and 300 μm (j). Ventral views are shown unless otherwise stated. Source Data
Extended Data Fig. 1
Extended Data Fig. 1. Ferroptosis propagates across different cell types.
a, Time-lapse images showing cell rupture (bright-field) co-occurring with an increase in nuclear dye fluorescence (cyan to white), followed by an increase in sytox green (orange) after erastin (10 μM) treatment. b, Single-cell quantification of nuclear fluorescence and sytox green signal upon ferroptosis. Data represent median and interquartile range for 20 cells. c, Vector field of cell death representing directionality of death events was generated from cell death contours (1). Each vector and each area bounded by contours are colour-coded for a specific time-point. The angles of the vectors along a specific direction (i.e., 0°) from the initial death event are computed (2). The distribution of vector angles is shown in the polar histogram (3). Entropy (H) is calculated as an index for the randomness of the vector angles (Methods). d-i, Spatial and temporal analysis of cell death events in RPE-1 cells after treatment with erastin (d, e), RSL3 (f, g), or staurosporine (h, i). d, f, h, Time-lapse images of cell death in RPE-1 cells treated with erastin (10 μM) (d), RSL3 (0.15 μM) (f) or staurosporine (0.15 μM) (h). Shown are bright-field and nuclear dye fluorescence images overlaid with cell death contours (orange outlines). e, g, i, Upper panel: vector field of cell death. Lower panel: polar histogram with its entropy (H). j, Spatial and temporal analysis of cell death in RPE-1 cells induced by different chemicals: from left to right, ferroptosis inducers BSO (8 mM) + FC (1 mM), cystine starvation (- Cys2), sodium iodate (12.5 mM); and the intracellular calcium inducer ionomycin (2.5 μM). Upper panels: vector fields of cell death. Lower panels: example polar histogram of cell death vectors. k, l, Spatial and temporal analysis of erastin (10 μM)-induced ferroptosis in 16 different cell lines (k), and RSL3 (0.15 μM)-induced ferroptosis in U-2 OS and A549 cells (l). Upper panels: vector fields of cell death. Lower panels: example polar histogram of cell death vectors. m, Entropy calculation of cell death vector fields in (e-l). Data represent mean ± s.d. (18 angles from three cell death areas for each condition). The entropies of staurosporine- and ionomycin-induced cell death in RPE-1 cells, and RSL3-induced cell death in U-2 OS and A549 cells are significantly different from other conditions. Significance was tested by two-sided Wilcoxon rank-sum tests (* FDR-adjusted P < 1 × 10−5). Representative time-lapse movies for this experiment are shown in Supplementary Video 1. Scale bars, 100 (a, A549 and U-2 OS in k), and 200 (d-l) μm. Source Data
Extended Data Fig. 2
Extended Data Fig. 2. Ferroptosis initiation is a random process.
a, A representative image of RPE-1 cells cultured in RPMI media + 5% FBS, followed by erastin (10 μM) treatment for 7 h. Orange crosses indicate sites of ferroptosis initiation events. Scale bar, 500 μm. b, Time series of ferroptosis initiation events from 756 positions. Time interval between frames is 50 min. c, Distribution of the number of initiation events identified over 5 h with its fit to a Poisson distribution (mean = 1.01 initiation events in 5 h, two-sample Kolmogorov-Smirnov test P = 1, indicating no significant difference from the Poisson distribution). d, Distribution of the time interval between two consecutive initiation events with its fit to a geometric distribution (mean = 5.16 h, two-sample Kolmogorov-Smirnov test P = 0.23, indicating no significant difference from the geometric distribution). e, f, Distributions of single-cell iron (e) and ROS (f) levels in RPE cells after 8 h of erastin treatment with their fit to the logistic distribution. The two-sample Kolmogorov-Smirnov test P are 0.35 (e) and 0.51 (f). g, h, Adjusting the concentrations of transferrin and FBS reduces the number of ferroptotic initiation sites. Number of initiation sites (left panel) and timing of initiation (right panel) after erastin (10 μM) treatment as a function of FBS (g) and transferrin (h) concentrations. Cells were seeded in RPMI media for experiments in (g). For experiments in (h), cells were seeded in DMEM/F12 supplemented with different transferrin concentrations without FBS, followed by media-change to RPMI with 0.15% FBS one day after seeding. Data represent mean ± s.d. from at least four technical repeats. All experiments were independently repeated three times with similar results. Source Data
Extended Data Fig. 3
Extended Data Fig. 3. Blue light irradiation elevates cellular ROS levels, and causes ferroptosis cell death and its propagation in erastin-treated cells.
a, A cartoon illustrating a cell-based assay for long-distance measurement of ferroptosis propagation (Methods). RPE-1 cells were treated with erastin prior to blue light (432 nm) irradiation. A local area (the photoinduction area marked with a red circle, ~0.2 mm2) was irradiated with blue light to initiate ferroptosis at a desired time and location. b-d, The area of the red circles in (b) and (d) was irradiated with blue light (432 nm, 60 mW) 8 h after erastin (10 μM) treatment. b, c, Time-lapse images of ROS (yellow) and cell death (nuclear dye, cyan) after photoinduction in (b), and after local addition of H2O2 (80 µM, 2 µL) (approximately within the area indicated by the red circles) in (c). d, Chemical inhibitors of ferroptosis (DFO, 200 μM; Lip-1, 30 nM; Fer-1, 60 nM), necroptosis (Nec-1, 10 μM), and apoptosis (Z-VAD-FMK, 10 μM) were added before photoinduction. Cell death was monitored for 3 h after photoinduction using nuclear dye. e, Time-lapse image sequences of ROS (yellow) in erastin-treated cells before and after photoinduction with different wavelengths of light (358 nm, 432 nm, 495 nm, 509 nm, 550 nm, 587 nm, 646 nm). f, Quantification of ROS at the photoinduction area in (e). Data represent mean ± s.d. of four wells. g, Speeds of ferroptosis propagation initiated by different wavelengths of light. Data represent mean ± s.d. from four wells with more than two directions calculated for each. h, Time-lapse image sequences of ROS (yellow) in erastin-treated cells before and after photoinduction with 432 nm light of different durations (0.6, 1.25, 2.5, 5, 10 sec). i, Quantification of ROS at the photoinduction area in (h). Data represent mean ± s.d. of four wells. j, Speeds of ferroptosis propagation initiated by different durations of light exposure (432 nm). Data represent mean ± s.d. from three wells with more than two directions calculated for each. k, Kymographs of cell death propagation in erastin-treated cells with or without addition of cell death inhibitors. Chemical inhibitors of ferroptosis (Fer-1, 60 nM), necroptosis (Nec-1, 10 μM), and apoptosis (Z-VAD-FMK, 10 μM) were added 2.5 h after photoinduction (white arrow). l, Speed measurements for experiments in (k). Data represent mean ± s.d. from four wells with three directions calculated for each. All experiments were independently repeated three times with similar results. Scale bars, 100 (b, h, e), 500 (c), and 200 (d) μm. Source Data
Extended Data Fig. 4
Extended Data Fig. 4. Cellular ROS (·OH, O2 and H2O2) wave fronts precede ferroptosis propagation.
a, b, Cellular ROS was monitored in erastin-treated cells using a general ROS dye (CellROX) that detects ·OH, O2 and H2O2. Images are derived from merging ROS (yellow) and nuclear dye fluorescence (cyan). Each yellow contour represents the border of the ROS wave front at a specific time-point. a, Upper panel: Image (8 h after photoinduction) overlaid with ROS contours 1-11 h after photoinduction. Lower panel: Fluorescence intensities of cell death and ROS signals were quantified across the bottom region of the image. b, Zoomed-in view of the box in (a). c, Time-lapse image array of ROS (yellow) and cell death (cyan) over 14 h. The image sequence was cropped from the same experiment in (a). d, Kymograph for ROS propagation in (a). The slopes of the yellow and white lines represent the speeds of ROS wave fronts and cell death propagation, respectively. The time-lapse movie for this experiment is shown in Supplementary Video 4. e, Kymographs of cell death propagation in erastin-treated cells after addition of ROS scavengers (Trolox, 6 µM; Tiron, 2 mM; catalase, 2000 U/mL; TEMPO, 125 µM; NAC, 15 µM) 4 h after photoinduction (white arrow). Data shown are representative of three biological repeats. Scale bars, 400 (a), and 250 (b) μm. Source Data
Extended Data Fig. 5
Extended Data Fig. 5. The spatial coupling mechanism involves the diffusion of a type of ROS.
a, Time-lapse image sequence of ROS (yellow) in erastin-treated cells across a gap (width = 172 μm). Lower panel: the mean intensity of ROS was calculated along the 2-mm distance at specific time-points. b, Left panel: Nuclear fluorescence and bright field images 20 h after incubation with erastin-free conditioned media (C.M.), ROS scavenger-treated C.M. (Fer-1, 60 nM; Trolox, 20 µM; TEMPO, 125 µM; Tiron, 2 mM), and media after washing out erastin-containing media in a culture dish without cells (Wash Ctrl). c, Nuclear fluorescence and bright field images 12 h after incubation with C.M., the eluate and retention fractions of the centrifugally filtered C.M., and eluate of the centrifugally filtered H2O2-containing media. Right panels in (b, c): Cell death (%) quantified from left panel. Data represent mean ± s.d. of four wells. All experiments were independently repeated three times with similar results. Scale bars, 200 (a), and 100 (b, c) μm. Source Data
Extended Data Fig. 6
Extended Data Fig. 6. Fenton-mediated ROS feedback loop is critical for ferroptosis occurrence and propagation.
a, Time-lapse image array of cellular labile iron in pseudocolor (magenta) and cell death (cyan) propagation in erastin-treated cells. Cellular labile iron was monitored using an iron dye (FeRhoNox-1). b, Kymograph for cellular labile iron propagation from the image sequence shown in (a). The slopes of the yellow and white lines represent the speed of labile iron at the wave fronts and cell death propagation, respectively. c, d, Enhancing Fenton-mediated ROS feedback loop induces wave propagation in cells gaining ferroptosis resistance at high confluency. Time-lapse images of A549 (c) and U-2 OS (d) cells at the indicated time points after erastin treatment (10 μM) with or without ferric citrate (FC, 125 μM). Cell death is indicated by increased nuclear dye fluorescence signal. The white outlines represent the boundaries of cell death areas. Experiments were independently repeated three times with similar results. Scale bar, 300 μm (c, d).
Extended Data Fig. 7
Extended Data Fig. 7. Targeting the NOX feedback loop by chemical inhibitors.
a, NOX4 is the dominant NOX isoform in RPE-1 cells. RT-qPCR was performed to quantify the relative mRNA levels of NOX1-4 in RPE-1 cells. Data represent mean ± s.d. of three technical replicates. Data shown is a representative of three biological repeats. b, Small-molecule inhibitors targeting the NOX loop do not exhibit antioxidant potential. Cell-free antioxidant potentials of Trolox (32 µM), GKT137831 (5 µM), LY294002 (100 µM), and dasatinib (10 µM) were measured as the DPPH absorbance at 517 nm relative to DMSO (vehicle control). Data represent mean ± s.d. from three wells. Source Data
Extended Data Fig. 8
Extended Data Fig. 8. ERK2 overexpression in RPE-1 cells increases phosphorylated ERK2, NOX activity, and the speed of ferroptotic trigger waves.
a, Genetic modulation of NOX signalling by ERK2 overexpression. b, Western blot analysis of overexpressed ERK2 (ERK2-P2A) and its phosphorylated form (phospho-ERK2-P2A) with or without erastin treatment (10 μM) in ERK2-overexpressing and control RPE-1 cells. The size of ERK2-P2A is bigger than wild type ERK2 and co-migrates with ERK1 due to its fusion to P2A peptide. For blot source data, see Supplementary Fig. 1. c, Relative NOX activity measured in ERK2-overexpressing and control RPE-1 cells. Data represent mean ± s.d. with four technical repeats. NOX activity of ERK2-overexpressing cells is significantly different from that of control cells (* two-sided Wilcoxon rank-sum test P = 0.0286). d, e, ERK2 overexpression increases the speed of ferroptotic trigger waves. Kymographs representing ferroptosis propagation in control cells (d) and ERK-overexpressing cells (e). Data shown (b-e) are representative of three biological repeats. Source Data
Extended Data Fig. 9
Extended Data Fig. 9. FSP1 inhibition increases ferroptosis wave speed.
a, Kymographs of cell death propagation in RPE-1 cells treated with erastin (left panel) or erastin + FSEN1 (0.25 μM) (right panel). b, Wave speed as a function of FSEN1 concentration. Data represent mean ± s.d. with three technical repeats. Experiments were repeated three times with similar results. Source Data
Extended Data Fig. 10
Extended Data Fig. 10. In silico simulations of ROS trigger waves.
a, A diagram of the ROS feedback loops and parameters used to build the mathematical model. b, c, Time-course simulations of ROS levels in a 200 × 200 population of cells treated with 10 µM erastin. Photoinduction was simulated by elevating ROS levels above the unstable steady state (USS) within the area of the red circle. Scale bar, 400 μm (b). c, Cross-section of ROS kinetics along the midline in (b). d, Speed of ROS propagation as a function of erastin concentration. e, Width (left panel) and amplitude (right panel) of the ROS wave front as a function of erastin concentration. Source Data
Extended Data Fig. 11
Extended Data Fig. 11. Erastin quantitatively modulates ROS feedback loops.
a, ROS steady state remains low regardless of photoinduction intensity in the absence of erastin treatment. Single-cell ROS steady states were measured in cells (40 cells) treated with or without erastin (10 µM) after photoinduction with different light intensities (1: 60 mW for 10 s; 2: 240 mW for 10 s; 3: 240 mW for 40 s). b-e, Cellular levels of GSH (b), labile iron (c), NOX activity (d), and ROS (e) after treatment with different erastin concentrations. Data represent mean ± s.d. (GSH: four technical replicates; labile iron: ≥ 257 cells; NOX activity: three biological repeats, with three technical repeats each; and ROS: ≥ 249 cells). Measurements are significantly different from those of untreated (0 µM) cells (two-sided Wilcoxon rank-sum tests, * FDR-adjusted P < 0.05 (b), <2 × 10−30 (c), <4 × 10−3 (d), <2 × 10−5 (e)). (f) Representative images of ROS (upper panels) and labile iron (lower panels) 8 h after different erastin treatments. Scale bar, 50 μm. All experiments were independently repeated three times with similar trends. Source Data
Extended Data Fig. 12
Extended Data Fig. 12. Ferroptosis is involved in muscle remodelling during avian limb development.
a, Whole-mount immunostaining of myosin heavy chain (myosin) in avian hindlimb at stages HH30 and HH32 of embryonic development. Ventral views of the limbs are shown, with limb margins outlined in yellow. Lower panels: Zoomed-in views of the boxes in the upper panels. The foot and shank muscles are labelled. b-e, Longitudinal sections of stage HH33 limbs. b, Co-staining of myosin and TUNEL, showing the muscular ventral death zone (MVDZ) at the zeugopod area. c, Co-staining of TUNEL and 4-HNE at the MVDZ in (b). d, e, Co-immunostaining of myosin and 4-HNE in the foot (d) and shank (e) regions. Degenerating muscles display a rounded and beaded appearance. Data shown (a-e) are representative of three biological repeats. f, g, 4-HNE and TUNEL signals are abundant at the central region relative to the lateral regions of the limb zeugopod. Upper panels: Immunostaining of 4-HNE (f) and TUNEL staining (g) in stage HH32 limbs. Lower panels: The relative mean values of 4-HNE (f) and TUNEL (g) signal intensities were calculated along the indicated region (lateral and central, grey box 1600 × 1000 µm2) for three biological repeats (yellow, blue, orange curves). h, The 4-HNE and TUNEL signal intensities at the central and lateral regions normalized to the total signal intensities. i, j, In ovo ferroptosis suppression impairs muscle remodelling in avian embryonic limb. Muscle fibre count (i) and distribution of entropy of the muscle fibre orientation (j) in embryonic limbs dissected from UAMC-3203-treated and vehicle control (DMSO)-treated embryos. Data represent mean ± s.d. of three biological repeats. The muscle fibre count and entropy of the muscle fibre orientations for limbs dissected from UAMC-3203-treated embryos are higher than those from the control embryos (* two-sided Wilcoxon rank-sum tests, P = 0.0495 and 0, respectively). Scale bars, 500 (upper panels in a), 300 (lower panels in a), 200 (b), 50 (c), 100 (d, e), and 400 (f, g) μm. Source Data

References

    1. Clarke, P. G. & Clarke, S. Nineteenth century research on naturally occurring cell death and related phenomena. Anat. Embryol.193, 81–99 (1996). - PubMed
    1. Saunders, J. W. Jr. Death in embryonic systems. Science154, 604–612 (1966). - PubMed
    1. Linkermann, A. et al. Synchronized renal tubular cell death involves ferroptosis. Proc. Natl Acad. Sci. USA111, 16836–16841 (2014). - PMC - PubMed
    1. Roth, T. L. et al. Transcranial amelioration of inflammation and cell death after brain injury. Nature505, 223–228 (2014). - PMC - PubMed
    1. Li, Y. et al. Ischemia-induced ACSL4 activation contributes to ferroptosis-mediated tissue injury in intestinal ischemia/reperfusion. Cell Death Differ.26, 2284–2299 (2019). - PMC - PubMed

LinkOut - more resources