. 2024 Aug;632(8026):877-884.
doi: 10.1038/s41586-024-07681-w. Epub 2024 Jul 10.

In situ targeted base editing of bacteria in the mouse gut

Affiliations

In situ targeted base editing of bacteria in the mouse gut

Andreas K Brödel et al. Nature. 2024 Aug.

Abstract

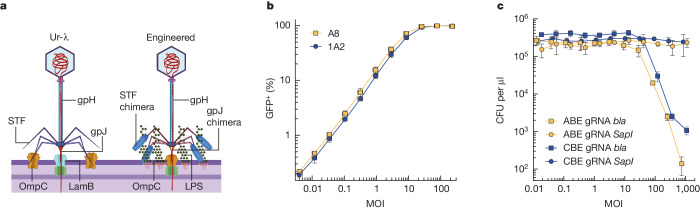
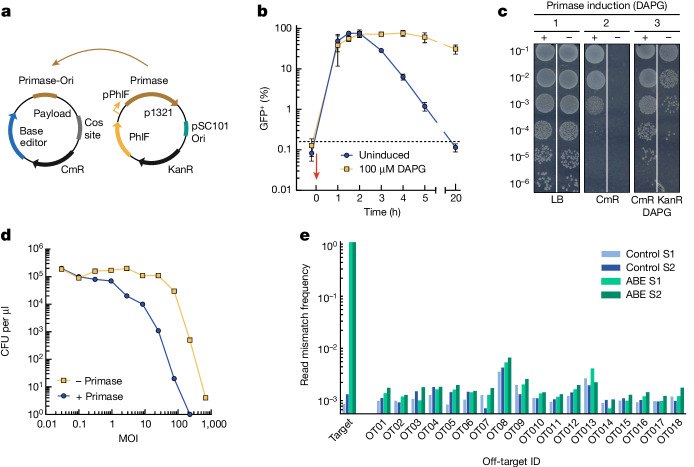
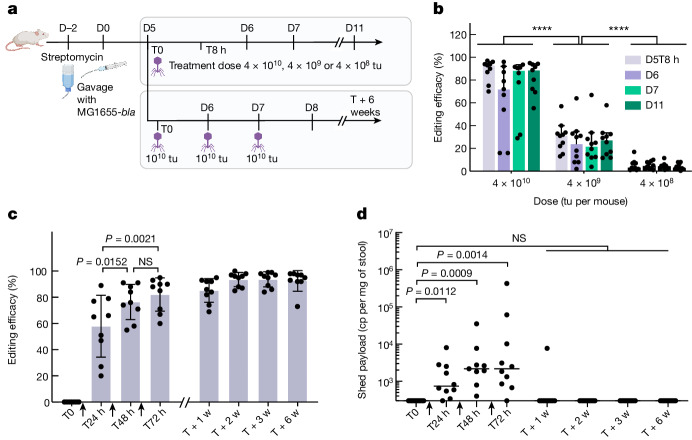
Microbiome research is now demonstrating a growing number of bacterial strains and genes that affect our health1. Although CRISPR-derived tools have shown great success in editing disease-driving genes in human cells2, we currently lack the tools to achieve comparable success for bacterial targets in situ. Here we engineer a phage-derived particle to deliver a base editor and modify Escherichia coli colonizing the mouse gut. Editing of a β-lactamase gene in a model E. coli strain resulted in a median editing efficiency of 93% of the target bacterial population with a single dose. Edited bacteria were stably maintained in the mouse gut for at least 42 days following treatment. This was achieved using a non-replicative DNA vector, preventing maintenance and dissemination of the payload. We then leveraged this approach to edit several genes of therapeutic relevance in E. coli and Klebsiella pneumoniae strains in vitro and demonstrate in situ editing of a gene involved in the production of curli in a pathogenic E. coli strain. Our work demonstrates the feasibility of modifying bacteria directly in the gut, offering a new avenue to investigate the function of bacterial genes and opening the door to the design of new microbiome-targeted therapies.


Conflict of interest statement

All authors are current or former employees, or paid advisors, of Eligo Bioscience. Eligo Bioscience owns US patent nos. 11,224,621, 11,376,286, 11,534,467 and 11,690,880 and international patent application no. WO2021/204967 relating to certain research described in this article.

Figures

Fig. 1
Fig. 1. Engineering of an efficient and selective DNA delivery vector for E. coli colonizing the mouse gut.
a, Schematic of the Ur-λ phage injection mechanism. Left, adsorption of phage Ur-λ to E. coli cells. Gene stf encodes for long appendages anchored at the base plate, which promote adsorption of the phage to target bacteria through interaction with the OmpC outer membrane porin. The tail tip protein gpJ recognizes the LamB outer membrane porin and, following binding of gpJ to its receptor, the gpH protein allows for injection of DNA through the periplasm and into the bacterial cytoplasm. Right, engineered λ-derived particles with λ-P2 STF chimeras recognizing LPS and with gpJ chimeras recognizing OmpC. b, Delivery efficiency of gpJ cosmid variants with a payload encoding sfGFP (plasmid p513) into E. coli s14269, measured by flow cytometry (excitation, 488 nm; emission, 530/30 BP). On the x axis, MOI represents the ratio of packaged cosmids to bacteria; the y axis represents the percentage of GFP+ population following incubation for 45 min. The graph shows the average and standard deviation of an experiment performed in triplicate. c, MOI-dependent adenine (ABE gRNA bla, p1396) and cytosine base editing (CBE gRNA bla, p2327) of β-lactamase on strain MG1655-bla (gpJ A8, λ-P2 STF chimera). Control samples with a non-targeting SapI spacer are shown (ABE gRNA SapI, p2771; CBE gRNA SapI, p2770). The y axis represents colony-forming units (CFU) per microlitre on carbenicillin plates. The graph shows the average and standard deviation of an experiment performed in triplicate. Panel a created with BioRender.com. Source Data
Fig. 2
Fig. 2. A non-replicative DNA payload can efficiently edit a target bacterial population.
a, Schematics for the conditional replication of a cosmid. Replication requires both the primase protein and the primase origin of replication (Primase-Ori). b, In vitro plasmid stability time-course assay. Bacteria carrying an inducible primase plasmid were grown either without inducer (blue) or with 100 µM DAPG (yellow). A cosmid harbouring a sfGFP gene (p1324) was delivered at an approximate MOI of 40 (red arrow). Samples from different time points were analysed in a flow cytometer. The graph shows the average and standard deviation of an experiment performed in triplicate. Dashed line indicates background fluorescence of cells before transduction. c, Cells carrying an induced (+) or uninduced (−) primase plasmid were transduced with a payload carrying the conditional origin of replication, incubated for 5 h and plated on either (1) lysogeny broth agar, (2) lysogeny broth agar with chloramphenicol 25 µg ml−1 or (3) lysogeny broth agar with kanamycin 50 µg ml−1, chloramphenicol 25 µg ml−1 and DAPG 100 µM. d, In vitro adenine base editing of bla using a non-replicative payload (p2328). MG1655-bla was transduced in either the presence (blue) or absence (yellow) of primase expression (plasmid p1321). After 2 h, cells transduced at varying MOI were plated on lysogeny broth with carbenicillin. e, Analysis of on- and off-target editing in MG1655-bla by next-generation sequencing. The frequency of mismatches in Illumina sequencing data is shown for all 20 base pair subsequences followed by a NGG PAM in the reference genome with up to seven mismatches to the target sequence, including up to two in the ten PAM-proximal nucleotides. Bars represent the mismatch frequency of the base with the highest frequency in each off-target. The sequence, coordinates and neighbouring genes of each off-target are listed in Supplementary Data 1. Data shown for two biological replicates of samples treated with either ABE or control. Source Data
Fig. 3
Fig. 3. Targeted adenine base editing of E. coli MG1655-bla in the gut of BALB/c mice.
a, Summary of the experimental set-up. Five days following colonization, mice were treated with packaged cosmids equipped with gpJ 1A2 and the λ-P2 STF chimera, and an ABE targeting the bla gene. In one arm we investigated dose–response and in the other the impact of multiple doses on treatment efficacy, following animals up to 6 weeks (w). Dose titres were measured as transducing units (tu). b, Editing efficiency at different time points for a single dose with decreasing concentrations. Points show individual mice (n = 10 per group), bars indicate median ± 95% confidence interval (****P < 0.0001 by one-way analysis of variance (ANOVA) with Tukey’s multiple-comparisons test). c, Editing efficiency following multiple treatments (P values indicated on the graph; not significant (NS), P > 0.05 by repeated-measures ANOVA with Tukey’s multiple-comparisons test; treatments are indicated by black arrowheads on the x axis; n = 9 animals). Bars represent mean ± s.d. d, Number of copies of payload (cp) recovered in the stool and quantified by ddPCR. Bars represent the group median (P values indicated on the graph; NS P > 0.05 by Kruskal–Wallis test with Dunn’s multiple-comparisons test; n = 10 animals). D0, day 0; T0, time 0. Panel a created with BioRender.com. Source Data
Fig. 4
Fig. 4. Targeted base editing of pathogenic E. coli and K. pneumoniae strains in vitro using a non-replicative DNA payload.
a, MOI-dependent cytosine base editing of target genes clbH, clbJ and cnf1 in strain UTI89 using a vector harbouring the λ-K1F STF chimera and gpJ 1A2. The CBE inserts a premature stop codon into the target genes. b, MOI-dependent cytosine base editing of target genes fimH, fimK and aph(3)-Ia in K. pneumoniae ST258 using a vector harbouring the λ-KL106 STF chimera and gpJ A8. The CBE inserts a premature stop codon into the target genes. c, MOI-dependent adenine base editing of the start codon of csgA (ATG to ACG) in strain TN03 using a vector harbouring the λ-K5 STF chimera and gpJ A8. d, Next-generation sequencing analysis of on- and off-target adenine base editing (ABE8e, plasmid p2515) in TN03-csgA in vitro. The frequency of mismatches in Illumina sequencing data is shown for all 20 base pair subsequences with an NGG PAM in the reference genome with up to seven mismatches to the target sequence, including up to two in the ten PAM-proximal nucleotides. Bars represent mismatch frequency of the base with the highest frequency in each off-target. The sequence, coordinates and neighbouring genes of each off-target are listed in Supplementary Data 2. Data shown for two biological replicates of samples treated with either ABE or control. Base-editing experiments shown in ac were performed in duplicate (1 and 2). Source Data
Fig. 5
Fig. 5. Targeted adenine base editing of gene csgA on the E. coli TN03 genome in the gut of BALB/c mice following packaged λ cosmid treatment using a non-replicative payload.
a, Summary of the experimental set-up. Five days following colonization, mice were treated with packaged cosmids equipped with gpJ A8 and λ-K5 STF chimera encoding an ABE targeting the csgA gene. In one arm we investigated the dose–response and in the other the impact of multiple doses on treatment efficacy. b, Editing efficacy 24 h following a single dose at decreasing concentration (n = 10 independent animals per group, ****P < 0.0001 by one-way ANOVA with Tukey’s multiple-comparisons test). Bars represent mean ± s.d. c, Family-level bacterial composition quantified by metagenomic 16S sequencing before (D4) and after treatment (D12) with 1 × 1010 particles (n = 10 animals); data for all mice and time points are provided in Extended Data Fig. 10. Boxes are drawn from the first to third quartile, with the midline representing the median; whiskers extend to the minimum and maximum in each category, excluding outliers shown as black diamonds. d, Changes in intestinal microbiome composition of individual mice over time, represented as weighted UniFrac distance from the D5 sample. Stool samples of mice treated with 1 × 1010 particles were analysed (n = 9 animals). The plot is drawn as in c. e, Editing efficacy following multiple treatments (P values indicated on the graph; NS, P > 0.05 by one-way ANOVA with Tukey’s multiple-comparisons test; n = 14 animals); treatments are indicated by black arrowheads on the x axis). Points show individual mice and bars represent the group median, with 95% confidence interval when applicable. Panel a created with BioRender.com. Source Data
Extended Data Fig. 1
Extended Data Fig. 1. Delivery efficiency of a DNA payload into a MG1655 strain deleted for both lamB and ompC and complemented with a set of 23 different ompC variants in trans.
Delivery efficiencies of a λ cosmid harboring P2-STF chimera and gpJ variant A8 (orange lines) or 1A2 (blue lines). Cosmids package a DNA payload encoding sfGFP and delivery into E. coli was measured by flow cytometry (excitation: 488 nm, emission: 530/30 BP). The multiple sequence alignment of the tested OmpC variants is provided in Supplementary Data 10. A phylogenetic tree is provided in Supplementary Fig. 1. Source Data
Extended Data Fig. 2
Extended Data Fig. 2. Cell receptor analysis for efficient cosmid delivery.
Delivery efficiency assays of cosmids harboring Ur-λ wild-type (WT) gpJ and stf, or harboring gpJ chimeras (1A2 or A8) and P2 STF. Transduction of a payload encoding a sfGFP fluorescent protein gene was measured in a flow cytometer (excitation: 488 nm, emission: 530/30 BP; Attune NxT Thermo Scientific) at different MOIs. a) Delivery efficiency into MG1655 WT, carrying the endogenous OmpC variant in the genome. b) and c) Delivery efficiency into a MG1655 strain deleted for both lamB and ompC genes, complemented with two different ompC variants on a plasmid (p1471 or p1472). d) Delivery efficiencies in E. coli MG1655 of λ particles carrying the WT λ STF (purple line), no STF (blue line) and λ-P2 STF chimera (p938) (orange line). Source Data
Extended Data Fig. 3
Extended Data Fig. 3. Targeted base editing of the E. coli genome in vitro after DNA payload transformation and antibiotic selection.
a) Adenine base editing (ABE8e, plasmid p2325) of MG1655-mCherry. The experiment was performed in the presence (48 colonies analyzed) or absence (2 colonies analyzed) of a guide RNA targeting the amino acid triad forming the fluorophore of mCherry (tripeptide: M71, Y72, G73). b) Cytosine base editing (CBE = evoAPOBEC1-nCas9-UGI, plasmid p2326) of mCherry on MG1655-mCherry genome. The experiment was performed in presence (48 colonies analyzed) or absence (2 colonies analyzed) of a guide RNA inserting a stop codon at position Q114* into mCherry. Fluorescence of individual colonies was measured by flow cytometry (excitation: 561 nm, emission: 620/15 BP; Attune NxT Thermo Scientific). Dots represent single colonies after overnight incubation on chloramphenicol plates. c) Adenine base editing of β-lactamase (bla) in MG1655-bla in vitro (plasmid p1396). The experiment was performed in presence or absence of a guide RNA targeting the active site of β-lactamase (K71E or K71R). d) Cytosine base editing of β-lactamase in MG1655-bla in vitro (plasmid p2327). The CBE inserts a premature stop codon (Q37*) into the target gene, resulting in the re-sensitization of the bacterial population to β-lactam carbenicillin. The no gRNA controls carried a SapI spacer in the ABE or CBE plasmids. Adenine and cytosine base editing of β-lactamase was analyzed by colony counting after overnight incubation on chloramphenicol (Cm) and Cm/carbenicillin agar plates at 30 °C. The percentage growth was obtained by dividing the number of colonies on Cm/carbenicillin plates by the number on Cm plates. One dot represents one transformation after overnight incubation on plates. Graphs show individual values (dots) and average plus standard deviation. Sequencing data at the target site are shown exemplarily for a single base-edited colony. Source Data
Extended Data Fig. 4
Extended Data Fig. 4. Multiplicity of injection (MOI)-dependent delivery efficiency and corresponding adenine base editing (ABE) and cytosine base editing (CBE).
Delivery efficiency was obtained by colony counting after overnight incubation on LB and LB (chloramphenicol) agar plates. Left y axis: The percentage delivery was obtained by dividing the number of colonies on chloramphenicol plates by the number on LB plates (blue line). Right y axis: Base editing of β-lactamase in strain MG1655-bla diminishes cell growth on carbenicillin plates (colony-forming units cfu per µl; orange line). For the control samples, the gRNA targeting bla was replaced by a non-targeting SapI spacer. The graphs show the average and standard deviation of an experiment performed in triplicate. Source Data
Extended Data Fig. 5
Extended Data Fig. 5. Estimated efficacy of targeted adenine base editing on the E. coli genome in the gut of BALB/c mice after cosmid treatment using a non-replicative payload.
a) Estimation of the editing efficacy as measured by repatching individual colonies onto agar plate with or without carbenicillin, for the initial dose-response experiment, and b) for the treatment with multiple doses. Bars represent the group median, with 95% confidence interval. Source Data
Extended Data Fig. 6
Extended Data Fig. 6. Colonization levels of E. coli s21052 in the streptomycin-treated BALB/c mice during treatment with base-editing cosmid particles.
a) Total E. coli bacteria were quantified by plating resuspended stool samples onto Drigalski plates supplemented with streptomycin. Wild-type WT (ie, non-edited) E. coli s21052 were quantified by plating samples onto Drigalski plates with carbenicillin. Source Data
Extended Data Fig. 7
Extended Data Fig. 7. Fitness experiment of the bla-edited versus non-edited strain in the gut of BALB/c mice.
a) Time-course of the relative abundance of the bla-edited compared to the WT E. coli s21052 strain in 15 mice. Five groups of three mice were treated with independent pairs of clones at an approximate ratio of 1:1 (from 0.92 to 0.96). Plots represent geometric mean and error bars the 95% confidence interval. b) Individual mice data from the same experiment. Colors represent the group of each animal. c) Time-course of the E. coli s21052 colonization level in the streptomycin-treated BALB/c model. Total E. coli bacteria were quantified by plating resuspended stool samples onto Drigalski plates supplemented with streptomycin. Bars represent the median and each dot individual values. d) E. coli s21052 colonization level in the streptomycin-treated BALB/c model for each group. Dots represent the geometric mean, and error bars the geometric standard deviation. Source Data
Extended Data Fig. 8
Extended Data Fig. 8. Delivery efficiencies into pathogenic strains of E. coli and K. pneumoniae.
a) Delivery efficiency assays in MG1655 carrying TN03-OmpC of cosmids harboring A8 (orange line) or 1A2 (blue line) gpJ chimeras and P2 STF. Grey line shows a comparison of the delivery efficiency of gpJ chimera 1A2 into MG1655 carrying OmpC-EDL933. Transduction of a payload encoding a sfGFP fluorescent protein gene was measured in a flow cytometer (excitation: 488 nm, emission: 530/30 BP) at different MOIs. b) Flow cytometry histogram of E. coli TN03 after delivery with a cosmid harboring λ-A8 gpJ chimera and λ-WT STF (blue line) or λ-K5 STF (red line) at an estimated MOI of ~10. Transduction of a payload encoding a mCherry fluorescent protein gene was measured in a flow cytometer (excitation: 561 nm, emission: 620/15 BP). c) Delivery efficiency into E. coli TN03 of λ particles carrying the λ-K5 STF chimera and payload from panel b at different MOIs. d) Delivery efficiencies of a DNA payload encoding the fluorescent gene venus (plasmid p2075) into UTI89 (gpJ 1A2, λ-K1F STF chimera), or a DNA payload encoding the fluorescent gene mCherry (plasmid p2074) into TN03 (gpJ A8, λ-K5 STF chimera) or Klebsiella pneumoniae (gpJ A8, λ-KL106 STF chimera), measured by flow cytometry (excitation: 488 nm, emission: 530/30 BP). Source Data
Extended Data Fig. 9
Extended Data Fig. 9. Fitness experiment of the edited versus WT E. coli TN03 strain in the gut of BALB/c mice.
a) Time-course of the relative ratio of the edited compared to the WT TN03 strain in 15 mice. Five groups of three mice were treated with independent pairs of clones at an approximate ratio of 1:1 (from 1.06 to 1.07). Plots represent geometric mean and error bars with a 95% confidence interval. b) Individual mice data from the same experiment (mouse number 16 to 30). Colors represent the group of origin for each animal. c) E. coli TN03 colonization level in the streptomycin-treated BALB/c model. Total E. coli bacteria were quantified by plating resuspended stool samples onto Drigalski plates supplemented with streptomycin. Bars represent the median and each dot individual values. d) E. coli TN03 colonization levels in the streptomycin-treated BALB/c model for each group. Dots represent the geometric mean, and error bars the geometric standard deviation. Source Data
Extended Data Fig. 10
Extended Data Fig. 10. Family-level bacterial composition quantified by metagenomic 16S sequencing for ten mice treated with 1 x 10¹⁰ particles per mouse.
Metagenomic 16S sequencing of stool samples was performed at two time points before treatment (D4 and D5) as well as three time points after treatment (D6, D9, and D12). The sample D5 M36 had to be excluded from the analysis due to low sequencing depth. The mean abundance per day is the average across the ten mice sequenced. The raw microbiome composition data are included in Supplementary Data. Source Data
Extended Data Fig. 11
Extended Data Fig. 11. Colonization levels of E. coli s21476.
a) Colonization levels in streptomycin-treated BALB/c mice after multiple treatment. Total E. coli bacteria were quantified by plating resuspended stool samples onto Drigalski plates supplemented with streptomycin (treatments are indicated with black arrowheads on the x-axis). b) Relative abundance of E. coli quantified by metagenomic 16S sequencing for ten mice treated with 1 x 10¹⁰ particles per mouse. Metagenomic 16S sequencing of stool samples was performed at two time points before treatment (D4 and D5) as well as three time points after treatment (D6, D9, and D12) for ten mice gavaged with 1 x 10¹⁰ particles per mouse. Source Data
Extended Data Fig. 12
Extended Data Fig. 12. Bray-Curtis dissimilarity analysis of microbial communities.
Metagenomic 16S sequencing of stool samples was performed at two time points before treatment (D4 and D5) as well as three time points after treatment (D6, D9, and D12) for ten mice gavaged with 1 x 10¹⁰ particles per mouse (n = 9 independent animals for each pair of timepoints due to a failed sequencing in one case). The boxes are drawn from the 1st to 3rd quartile with the middle line representing the median. Whiskers extend to the minimum and maximum in each category, excluding outliers shown as black diamonds. Only distances between samples from the same individual at different time points are shown. Source Data

Similar articles

Cited by

References

    1. Britton, G. J. & Faith, J. J. Causative microbes in host-microbiome interactions. Annu. Rev. Microbiol.75, 223–242 (2021). 10.1146/annurev-micro-041321-042402 - DOI - PubMed
    1. Chavez, M., Chen, X., Finn, P. B. & Qi, L. S. Advances in CRISPR therapeutics. Nat. Rev. Nephrol.19, 9–22 (2023). 10.1038/s41581-022-00636-2 - DOI - PMC - PubMed
    1. Mager, L. F. et al. Microbiome-derived inosine modulates response to checkpoint inhibitor immunotherapy. Science369, 1481–1489 (2020). 10.1126/science.abc3421 - DOI - PubMed
    1. Matson, V. et al. The commensal microbiome is associated with anti–PD-1 efficacy in metastatic melanoma patients. Science359, 104–108 (2018). 10.1126/science.aao3290 - DOI - PMC - PubMed
    1. Wang, C., Lau, C. Y., Ma, F. & Zheng, C. Genome-wide screen identifies curli amyloid fibril as a bacterial component promoting host neurodegeneration. Proc. Natl Acad. Sci. USA118, e2106504118 (2021). 10.1073/pnas.2106504118 - DOI - PMC - PubMed

MeSH terms

Substances

LinkOut - more resources