. 2024 Jul;631(8021):645-653.
doi: 10.1038/s41586-024-07671-y. Epub 2024 Jul 10.

Plasmacytoid dendritic cells control homeostasis of megakaryopoiesis

Affiliations

Plasmacytoid dendritic cells control homeostasis of megakaryopoiesis

Florian Gaertner et al. Nature. 2024 Jul.

Abstract

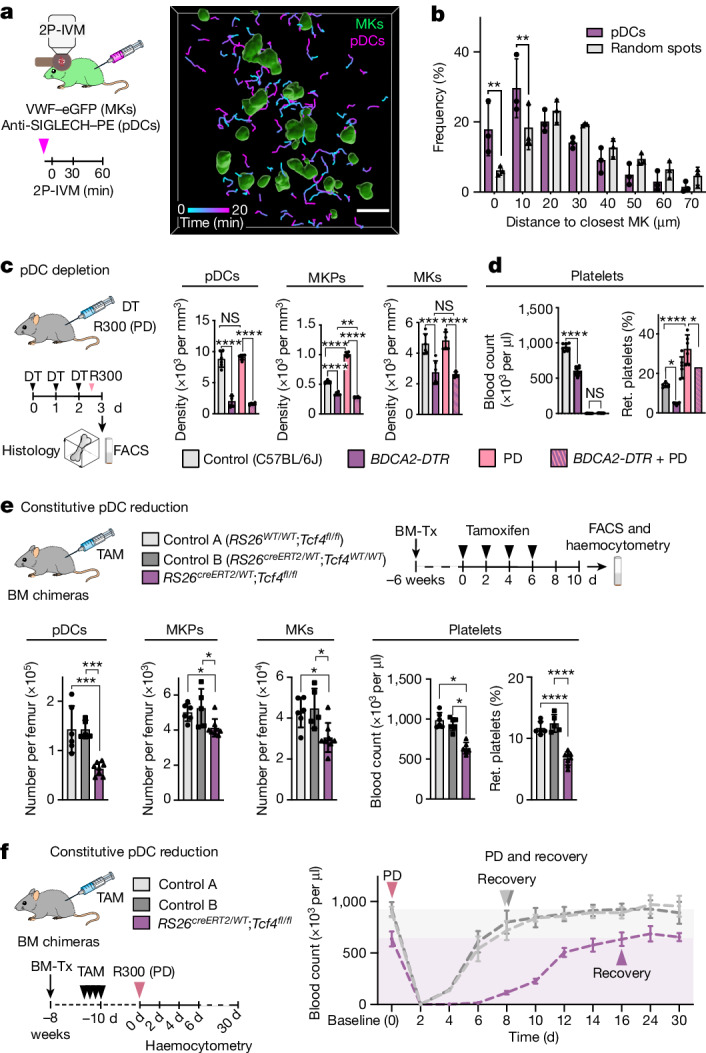
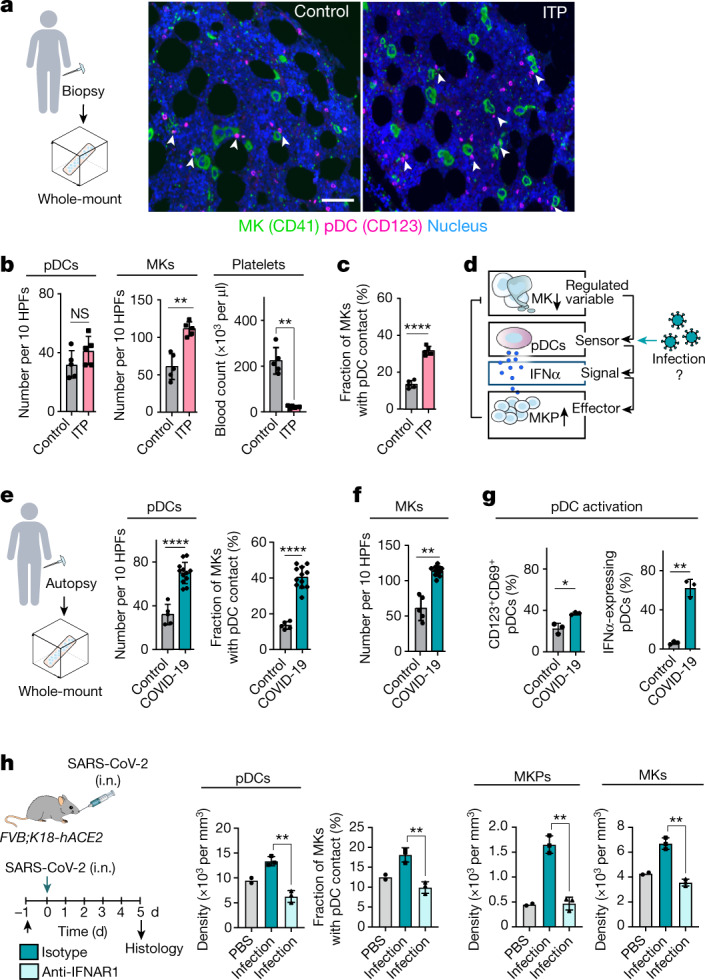
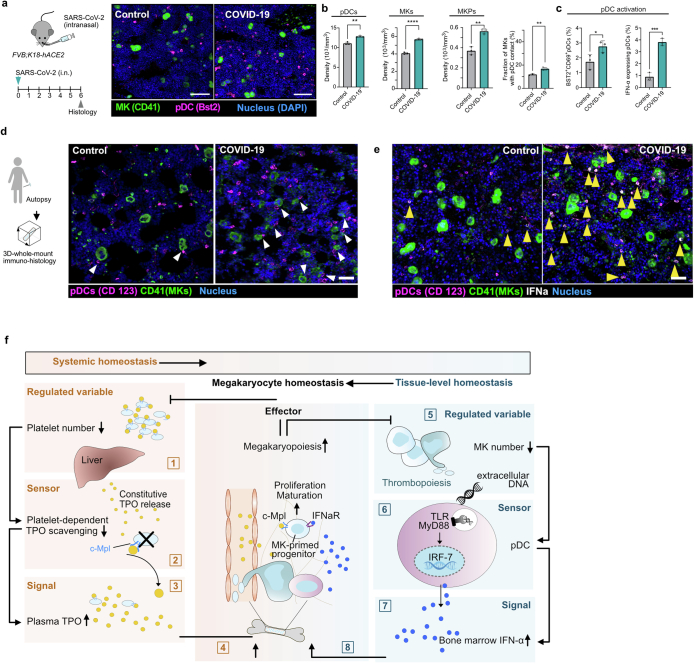
Platelet homeostasis is essential for vascular integrity and immune defence1,2. Although the process of platelet formation by fragmenting megakaryocytes (MKs; thrombopoiesis) has been extensively studied, the cellular and molecular mechanisms required to constantly replenish the pool of MKs by their progenitor cells (megakaryopoiesis) remains unclear3,4. Here we use intravital imaging to track the cellular dynamics of megakaryopoiesis over days. We identify plasmacytoid dendritic cells (pDCs) as homeostatic sensors that monitor the bone marrow for apoptotic MKs and deliver IFNα to the MK niche triggering local on-demand proliferation and maturation of MK progenitors. This pDC-dependent feedback loop is crucial for MK and platelet homeostasis at steady state and under stress. pDCs are best known for their ability to function as vigilant detectors of viral infection5. We show that virus-induced activation of pDCs interferes with their function as homeostatic sensors of megakaryopoiesis. Consequently, activation of pDCs by SARS-CoV-2 leads to excessive megakaryopoiesis. Together, we identify a pDC-dependent homeostatic circuit that involves innate immune sensing and demand-adapted release of inflammatory mediators to maintain homeostasis of the megakaryocytic lineage.


Conflict of interest statement

The authors declare no competing interests.

Figures

Fig. 1
Fig. 1. Spatiotemporal coordination of thrombopoiesis and megakaryopoiesis.
a, 3D-rendered z stack of mouse BM (sternum). n = 3. MKPs (green): CD41+CD42; MKs (yellow): CD41+CD42+; sinusoids (grey): CD144+; bone (blue): second harmonic generation. b, The distribution of MKs and MKPs relative to their distance to sinusoids. n = 3. Data are mean ± s.d. Statistical analysis was performed using multiple unpaired t-tests; NS, not significant. c, Chronic 2P-IVM analysis of the calvaria. n = 7 mice. Top, images of VwfeGFP/+ cells (green); TRITC–dextran (sinusoids; magenta). The arrow indicates an MKP migrating at the perivascular niche before growth. The arrowhead indicates MKP growth in the proximity of thrombopoiesis (which is indicated by an asterisk). Bottom, 3D-rendering. d, The speed of MKs (n = 52), arrested MKPs (n = 33) and motile MKPs (n = 31). Cells were pooled from 7 mice. Statistical analysis was performed using one-way ANOVA with Tukey’s test; NS, P = 0.2029; ****P = 0.0000000005. Data are mean ± s.d. e, The diameters of arrested and motile MKPs tracked over time (2P-IVM). n = 28 cells from 5 mice (arrested MKPs) and n = 6 cells from 3 mice (motile MKPs). f, The change in cell volume per hour during MKP maturation (growth; yellow) (n = 14 cells pooled from 4 mice) and platelet release (reduction; cyan) (n = 11 cells pooled from 4 mice). Data are mean ± s.d. g, VwfeGFP/+ cells per field of view (FOV) tracked over time. n = 12 FOVs from 5 mice. h, The homeostatic circuit of MKs in BM. i, Chronic 2P-IVM after PD. The histogram shows an increased frequency of MKPs at the perivascular niche. n = 4 mice per group. Statistical analysis was performed using multiple Mann–Whitney U-tests; *P = 0.0286. Data are mean ± s.d. Arrowheads, new MK progenitors. j, The fold change in platelet counts (haemocytometer). n = 9 (baseline), n = 6 (0.5 days), n = 8 (1 day), n = 9 (2 days), n = 9 (4 days), n = 4 (8 days) mice. MK/MKP density (counts per mm3) (BM whole-mount immunostainings) (n = 3 mice) were measured at the indicated timepoints after PD. k, The percentage of MKPs attached to MKs (BM whole-mount immunostainings). n = 4 mice. Statistical analysis was performed using an unpaired t-test; **P = 0.009. Data are mean ± s.d. l, The frequency of apoptotic MKs (live/dead-stain-405CD41-PE+CD42-APC+CD11bCD8aApotracker green+) increases after PD (light pink, 6 h; pink, 24 h), as determined using FACS. Left, the fluorescence intensity (Apotracker). The frequency of apotracker+ MKs. n = 4 (control and PD (6 h)) and n = 6 (PD (12 h)) mice. Statistical analysis was performed using one-way ANOVA with Tukey’s test; ***P = 0.00041; ****P = 0.0000059. Data are mean ± s.d. For a, c and i, scale bars, 50 μm. Source data
Fig. 2
Fig. 2. pDCs are BM niche cells that regulate megakaryopoiesis.
a, 2P-IVM analysis of pDC migration in close proximity to the megakaryocytic lineage. MK/MKPs: VWF–eGFP+ (green); pDCs: anti-SIGLECH–PE (2 µg per 25 g intravenously (i.v.) 15 min before imaging) (magenta). b, The distribution of pDCs relative to their distance from MKs compared with calculated random spots. n = 3 mice. Data are mean ± s.d. Statistical analysis was performed using multiple unpaired t-tests with Holm–Šidák test; **P = 0.0068 (0 μm), **P = 0.0093 (10 μm). c,d, Impaired megakaryopoiesis at steady state and under stress after pDC depletion in BDCA2-DTR mice. c, Cell numbers were quantified using histology or FACS (see also Extended Data Fig. 5b). n = 6 mice. DT, diphtheria toxin. d, Platelet counts (haemocytometry) (n = 8 mice) and the fraction of reticulated (ret.) platelets (FACS; thiazole orange). n = 6 mice. Data are mean ± s.d. Statistical analysis was performed using one-way ANOVA with Tukey’s test; pDCs: ****P = 0.00000000002 (control and BDCA-DTR), ****P = 0.000000000003 (PD and BDCA-DTR + PD), NS, P = 0.89; MKPs: ****P = 0.0000000002 (control and BDCA-DTR), ****P = 0.00000000000002 (control and PD), ****P = 0.00000000000002 (PD and BDCA-DTR + PD), **P = 0.0068; MKs: ***P = 0.00012, ****P = 0.000014, NS, P = 0.98; platelets: ****P = 0.000000000000001 (control and BDCA-DTR), NS, P = 0.997; reticulated platelets: *P = 0.0102 (control and BDCA-DTR), *P = 0.0105 (PD and BDCA-DTR + PD) and ****P = 0.000005. e, Mice with constitutively reduced pDC numbers show altered megakaryopoiesis. n = 6 (control A (RS26WT/WT;Tcf4fl/fl BM chimera)), n = 5 (control B (RS26creERT2/WT;Tcf4WT/WT BM chimera)) and n = 8 (Tcf4−/−(RS26creERT2/WT;Tcf4fl/fl BM chimera)) mice. Data are mean ± s.d. Statistical analysis was performed using one-way ANOVA with Holm–Šidák test; pDCs: ***P = 0.00024; MKPs: *P = 0.033 (RS26creERT2/WT;Tcf4fl/fl and control A), *P = 0.025 (RS26creERT2/WT;Tcf4fl/fl and control B); MKs: *P = 0.0124; platelets: *P = 0.0228; reticulated platelets: ****P = 0.00000068 (RS26creERT2/WT;Tcf4fl/fl and control A), ****P = 0.00000045 (RS26creERT2/WT;Tcf4fl/fl and control B). TAM, tamoxifen. f, Delayed recovery after PD in Tcf4−/− BM chimeras. n = 6 mice. Data are mean ± s.d. Statistical analysis was performed using two-way ANOVA with Tukey’s test, showing a significant delay in recovery: day 0 versus day 8: P = 0.084 (control A), P = 0.22 (control B), P = 0.0000398 (RS26creERT2/WT;Tcf4fl/fl). Scale bar, 50 µm (a). Source data
Fig. 3
Fig. 3. Innate immune sensing drives pDC activation in response to MK-derived extracellular DNA.
a,b, IFNα levels in the BM are pDC dependent at steady state and under stress. a, The experimental schematic. b, IFNα levels in the BM are pDC dependent, as determined using ELISA. BDCA2-DTR-neg (C57BL/6J): n = 12 (control) and n = 10 (PD (6 h) and PD (24 h)) mice; BDCA2-DTR-pos: n = 6 (control, PD (6 h) and PD (24 h)) mice. Data are mean ± s.d. Statistical analysis was performed using unpaired t-tests with Welch’s correction; **P = 0.0029 (control (BDCA-DTR-neg versus BDCA-DTR-pos)), ****P = 0.00002 (PD 6 h (BDCA-DTR-neg versus BDCA-DTR-pos)), ****P = 0.00001 (PD 24 h (BDCA2-DTR-neg versus BDCA2-DTR-pos)), ****P = 0.00004 (BDCA2-DTR-neg (control versus PD 6 h)), NS, P = 0.0812 (BDCA2-DTR-neg (PD 6 h versus PD 24 h)). c, Elevated p-IRF7 in pDCs after PD as determined using FACS. n = 4 (control and PD (6 h)) and n = 6 (PD (24 h)) mice. Data are mean ± s.d. Statistical analysis was performed using Brown–Forsythe ANOVA with Dunnett’s test; *P = 0.036, **P = 0.004. d, Co-culture of BM-derived pDCs (WT and Myd88−/−) and MKs. MK cell death was induced by DT injection in PF4-cre;RS26-iDTR mice. n = 6; PBS-injected mice were used as controls (n = 4). After 18 h of co-culture, IFNα was measured in the supernatants using ELISA. Data are mean ± s.d. Statistical analysis was performed using two-way ANOVA with Tukey’s test; ****P = 0.00000001 (WT pDCs (vital MKs versus dead MKs)), NS, P = 0.406 (Myd88−/− pDCs (vital MKs versus dead MKs)), P = 0.559 (vital MKs (WT pDCs versus Myd88−/− pDCs)), ****P = 0.0000002 (dead MKs (WT pDCs versus Myd88−/− pDCs)). e, MK-derived cell-free DNA activates pDCs. IFNα was measured using ELISA 30 min after incubation with MK supernatants. n = 3. Data are mean ± s.d. Statistical analysis was performed using one-way ANOVA with Tukey’s test; NS, P = 0.708 (no MKs versus vital MKs), P = 0.995 (vital MKs versus vital MKs + DNase), ****P = 0.00003 (vital MKs versus dead MKs), ****P = 0.00001 (dead MKs versus dead MKs + DNase). f, Myd88−/− mice show impaired megakaryopoiesis. n = 6 (MKPs/MKs), n = 11 (platelets) and n = 8 (reticulated platelets) mice. Data are mean ± s.d. Statistical analysis was performed using unpaired t-tests with Welch’s correction; **P = 0.0038 (MKPs), *P = 0.033 (MKs), *P = 0.016 (platelets), **P = 0.0068 (reticulated platelets). Source data
Fig. 4
Fig. 4. pDC-dependent IFNα drives megakaryopoiesis.
a, MK colony-forming unit (CFU) assay after TPO (50 ng ml−1) and IFNα (as indicated) treatment. Conditional deletion in MKPs (Vwf-cre;Ifnarfl/fl; n = 6 mice) and global deletion (Ifnar−/−; n = 5 mice) confirmed a direct and IFNAR-dependent role of IFNα. Data are mean ± s.d. Statistical analysis was performed using two-way ANOVA with Šidák’s test; P values are shown. b, Increased megakaryopoiesis after IFNα treatment. MKs: n = 6 (control), n = 4 (2 h and 4 h), n = 3 (24 h); MKPs: n = 4 (control, 2 h and 4 h), n = 3 (24 h); and platelets: n = 4 (control, 2 h, 4 h and 24 h) mice. Data are mean ± s.d. Statistical analysis was performed using Brown–Forsythe ANOVA with Dunnett’s test; *P = 0.0198 (MKPs); *P = 0.029 (MKs), ****P = 0.00003 (MKs); *P = 0.031 (platelets), **P = 0.0088 (platelets). c, The experimental design of the RNA-seq experiments. d, Metabolic activation of MKPs in bulk RNA-seq (CD41+CD42CD9+KIT+). The scatter plot shows deregulated genes (log2[FC]) in PD versus control and PD + pDC depletion (pDC-D) versus PD, plotted against each other. GO analysis revealed upregulated genes (false-discovery rate (FDR) < 0.05) associated with terms for transcription and translation (top five terms). e, UMAP plot of scRNA-seq data (sorted CD41+CD42CD9+KIT+ progenitors). GMP, granulocyte–monocyte progenitor. f, The frequency of each cell type and condition. g, Annotation by canonical gene expression markers. h, Trajectory analysis of MKP clusters. Top left, pseudotemporal ordering (Monocle3) of MKPs superimposed onto UMAP clusters (colour coded on the basis of progression in pseudotime). Top right, the proportion of MKP subsets for each condition along pseudotime. Bottom, heat map of genes associated with pseudotime (q < 0.01) clustered by pseudotemporal expression pattern. Selected genes are shown for each cluster (1–6) (the full list is provided in Supplementary Table 1). i, Genes upregulated after PD and downregulated after PD + pDC depletion defined from bulk RNA-seq analysis were summarized into a gene score (average expression across the gene set) and visualized by MKP clusters (scRNA-seq). j,k, Differentially expressed genes (Wilcoxon test). The horizontal dashed line indicates P = 0.05. The vertical dashed line indicates log2[FC] = 0.25; red, P < 0.05 and log2[FC] > 0.25; blue, P ≧ 0.05 and log2[FC] > 0.25. l, Decreased megakaryopoiesis in Ifnar−/− mice. pDC depletion in BDCA2-DTR;Ifnar−/− mice had no additive effect. MKs, MKPs and pDCs: n = 10 (control and Ifnar−/−) and n = 6 (BDCA2-DTR;Ifnar−/−) mice; platelets: n = 16 (control), n = 11 (Ifnar−/−) and n = 6 (BDCA2-DTR;Ifnar−/−) mice. Data are mean ± s.d. Statistical analysis was performed using Brown–Forsythe ANOVA with Dunnett’s test; P values are shown. m, Graphical summary. Source data
Fig. 5
Fig. 5. Infection alters pDC-regulated MK homeostasis in humans and mice.
a, Immunohistology of human BM biopsies from healthy controls and patients with secondary ITP with non-Hodgkin lymphoma (without BM involvement). MKs (CD41+, >15 μm; green), pDCs (CD123+; magenta), nuclei (DAPI; blue). Scale bar, 50 µm. b,c, Quantification of the number of pDCs, MKs per high power field (HPF) size of 0.9 mm × 0.7 mm and platelets (b) and the fraction of MKs with pDC contact (c) from the experiment in a. n = 5 patients. Data are mean ± s.d. Statistical analysis was performed using unpaired t-tests with Welch’s correction; NS, P = 0.158 (pDCs), **P = 0.0011 (MKs), **P = 0.0014 (platelets), ****P = 0.000002 (MKs/pDCs). d, Infection may alter the role of pDCs as homeostatic sensors. e,f, Immunohistology of human BM biopsies from healthy control patients (the same patients as shown in a and b) and from autopsies of patients with COVID-19 (see also Extended Data Fig. 9d). Quantification of the number of pDCs and the fraction of MKs in contact with pDCs (e) and the number of MKs (f) is shown. n = 5 (control) and n = 12 (COVID-19) individuals. Data are mean ± s.d. Statistical analysis was performed using unpaired t-tests with Welch’s correction; ****P = 0.00007 (pDCs), ****P = 0.0000000007 (MKs/pDCs), **P = 0.0018 (MKs). g, Increased activation of pDCs in the BM of patients with COVID-19. Quantification of activation marker CD69 (left) and IFNα expression (right) (Immunohistology; see also Extended Data Fig. 9e). n = 3 patients. Data are mean ± s.d. Statistical analysis was performed using unpaired t-tests with Welch’s correction; *P = 0.0304, **P = 0.0069. h, BM from FVB;K18-hACE2 mice infected with SARS CoV-2 (105 median tissue culture infectious dose (TCID50) SARS-CoV-2 per mouse in 25 μl intranasally (i.n.)) were analysed in the presence (n = 3) or absence (n = 3) of IFNAR1 blocking antibody and compared to untreated control mice (PBS, n = 2) (immunohistology). Data are mean ± s.d. Statistical analysis was performed using unpaired t-tests with Welch’s correction; **P = 0.0015 (pDCs), **P = 0.0041 (percentage of MK–pDC-contacts), **P = 0.0011 (MKPs), **P = 0.0014 (MKs). Source data
Extended Data Fig. 1
Extended Data Fig. 1. MK and MKP distribution in the bone marrow niche.
a, Representative whole-mount immunostaining of megakaryocyte progenitors and mature megakaryocytes in murine sternum bone (n = 3 mice). MKPs (green): CD41+/CD42; MKs (yellow): CD41+/CD42+; blood vessels (grey): CD144+; bone (blue): second harmonic generation. Scale bars = 200 μm (upper). Also see Fig. 1a. b, Histogram showing BM distribution of MKs and MKPs relative to their distance to endosteum. n = 3 mice; Mean ± SD. c, d, Cell diameter and sphericitity; for cell diameter MK n = 68 cells and MKP n = 55 cells; for sphericity MK n = 53 cells and MKP n = 17 cells; pooled from 7 mice; ****(Sphericity): p = 0.0000002, ****(Cell diameter): p = 0.000000000000001; unpaired t-test/Welch’s correction; Mean ± SD. e, Representative whole-mount immunostaining of MKs/MKPs in VwfeGFP/+ mice. MKs/MKPs of VwfeGFP/+ mice show no significant difference in cell number (p = 0.69/p = 0.84) and size (p = 0.38/p = 0.10) compared to C57Bl/6 J mice (stained with anti-CD41). n = 3 mice; unpaired t-test/Welch’s correction; Mean ± SD. Scale bar = 30 μm. f, VWF-eGFP does not co-localize with erythrocytes (Ter-119), granulocytes (CD11b, Ly-6G) and lymphocytes (CD3e, CD45R) in BM (n = 1). Scale bar = 100 µm. g, Platelet counts of VwfeGFP/+ compared to C57Bl/6 J; WT group n = 14 mice, VwfeGFP/+ group n = 7 mice. unpaired t-test/Welch’s correction; Mean ± SD; ns: p = 0.14. Source data
Extended Data Fig. 2
Extended Data Fig. 2. Megakaryocytic lineage tracing by chronic time-lapse 2P-IVM.
a, Schematic showing experimental setup of chronic 2-photon intravital microscopy (2P-IVM) of mouse calvarian bone marrow. Lower: Time series of BM in VwfeGFP/+ mice. MK lineage (VWF-eGFP; green); Bone (second harmonic generation). Arrow: Fragmentation of MK results in the release of platelet-like particles. Note that after fragmentation, platelet-like particles exit the BM and new MKs grow in size before undergoing fragmentation. b, VwfeGFP/+ mice were i.v. injected with TRITC-dextran to track the megakaryocytic lineage (green) and blood vessels (red) respectively (left time series). Max. intensity projections of raw data and 3D rendering of z-stacks from the same 2P-IVM time series are shown. Scale bars = 50 μm. c, Representative raw data and 3D-rendering corresponding to 3D-rendered images shown in Fig. 1c (n = 7). Scale bars = 50 µm. d-h: Spatiotemporal dynamics of the megakaryocytic lineage in response to immune-mediated thrombocytopenia. d, Schematic showing experimental setup of PD. Peripheral blood platelet counts monitored at indicated time points after a single injection (i.p.) of R300 or isotype control; R300: before (n = 9), 30 min (n = 3), 0.5d (n = 6), 1d (n = 8), 2d (n = 9), 4d (n = 9), 8d (n = 4) mice; isotype: before (n = 7), 30 min (n = 3), 0.5d (n = 4), 1d (n = 5), 2d (n = 7), 4d (n = 4), 8d (n = 3) Mean ± SD. e, Morphometric analysis of MKs shows decreased sphericity in response to PD corresponding to an increase of cellular protrusions; Control n = 63 cells and PD 12 h n = 51 cells, pooled from 4 mice; unpaired t-test/Welch’ correction, ***: p = 0.0002; Mean ± SD. Scale bars = 50 μm. f, Representative 2P-IVM time series of proplatelet formation and MK fragmentation. Single cell tracking of MK volumes over time reveals a significant faster decrease of volume following PD. Control n = 14 and PD n = 11 cells, pooled from 3 mice; unpaired t-test; ns: p = 0.0206; Mean ± SD. g, Upper: Small ( < 15 μm) VWF-eGFP+ cells (arrows) appear 12 h after PD (2P-IVM). Also see Fig. 1i. Scale bar = 50 µm. Middle: PD triggers an instantaneous proliferation of MKPs peaking 1d following platelet depletion; MKPs (CD41+/CD42) were counted in whole-mount BMs. n = 3 mice; one-way ANOVA/Dunnett, **: p = 0.0023, ****: p = 0.000009, ***: p = 0.0008, ns: p = 0.063 and p = 0.072; Mean ± SD. Lower: Proliferation of MKPs (VWF-eGFP+/CD41+/CD42) was measured after in vivo labelling of BM cells with 5-ethynyl-2′-deoxyuridine (EdU) using FACS. Mean fluorescent intensity of EdU and Frequency of EdU-pve cells significantly increases after PD (12 h); n = 3 mice; paired t-test; **: p = 0.0046; *: p = 0.0115; error bar=SD; Mean ± SD. h, Left: MKPs lodged within the perivascular niche of the BM grow in volume. Volume increase of single cells was tracked over time. Arrested MKP n = 27 cells and mobile MKP n = 6 cells. Notably, the speed of cell growth after PD did not significantly differ from steady state control; Control n = 54 cells and PD = 18 cells, pooled from 3 mice, unpaired t-test Welch’s correction ns: p = 0.7503; Mean ± SD. Source data
Extended Data Fig. 3
Extended Data Fig. 3. TPO triggers global megakaryopoiesis without preferential localization to the perivascular niche.
a, Left: Scheme of platelet homeostasis regulated by TPO. TPO released from liver is scavenged by circulating platelets that express the TPO-receptor (Mpl). Thrombocytopenia leads to an increase of unbound plasma TPO which drives megakaryopoiesis in the BM. Right: Plasma TPO levels increase in response to PD, reaching the highest levels 12 h after platelet depletion (ELISA); n = 4 mice per group, one-way ANOVA/Dunnett; *: p = 0.018, **: p = 0.008, ****: p = 0.00000005; Mean ± SD. b, Left: Plasma TPO levels increase after i.p. injection (8 ng/g body weight on 3 consecutive days, i.p.) (ELISA after 30 min) (n = 6 mice); Mean ± SD; unpaired t-test/Welch’s correction; *: p = 0.014. Right: Thrombopoiesis is not affected by TPO treatment as indicated by unaffected platelet counts (hemocytometer); n = 5 mice, unpaired t-test Welch’s correction ns: p = 0.267; Mean ± SD. c, 3D-rendered micrographs of BM wholemount staining show increased numbers of MKPs (green: CD41 + / < 20 μm) and MKs (yellow: CD41+/ > 20 μm) after TPO treatment, vessels (grey: CD144); scale bar = 50 µm. d, TPO-treatment increased megakaryopoiesis (MKP and MK numbers) to an extent similar to platelet depletion (PD). Of note, TPO-treatment leads to an accumulation of mature MKs in the BM while MK numbers in the BM remained unaffected after PD due to increased MK consumption (BM whole-mount immunostainings); control n = 3 mice, PD n = 4 mice and TPO n = 3 mice, one-way ANOVA/Dunnett; MKPs, **(PD): p = 0.0064, **(TPO): p = 0.0032; MK, ns(PD) = 0.44, **(TPO): p = 0.0023; Mean ± SD. e, Increased megakaryopoiesis in response to TPO followed a different spatial pattern compared to PD. During PD, the local increase in megakaryopoiesis is restricted to the perisinusoidal compartment (see Fig. 1g). In contrast, TPO treatment increased megakaryopoiesis throughout the BM compartment. Consequently, the distribution of MKPs relative to the perivascular niche was unaffected by TPO treatment as analysed in BM whole-mount immunostaining. The distances were binned into 5 μm intervals; n = 4 mice per group; Unpaired t-test; ns: p = 0.99; Mean ± SD. Source data
Extended Data Fig. 4
Extended Data Fig. 4. MK-immune cell interaction in the bone marrow.
a-d: Macrophages, monocytes and neutrophils are dispensable for megakaryopoiesis a, Left: MK-Macrophage contacts were quantified by whole-mount BM immunohistology; MK: CD41+; Macrophages: CD68+. Scale bar = 10 µm. Right: PD did not increase MK-Macrophage contacts; n = 4 mice; unpaired t-test Welch’s correction ns: p = 0.9299 and ns: p = 0.6882; Mean ± SD. b, Macrophage depletion with Csf1R-Inhibitor (PLX5622) did not impair megakaryopoiesis (n = 4 mice). Mean ± SD; Welch’s t test; ****: p = 0.000018. c, Macrophage / monocyte depletion in CD11b-DTR mice did not impair megakaryopoiesis (n = 3 mice). Mean ± SD; Welch’s t test; *: p = 0.02. d, Neutrophil-depletion in LysM-Cre; Mcl-1fl/fl mice has no impact on megakaryopoiesis (n = 3 mice). Mean ± SD; Welch’s t test; **: p = 0.009. e-i: pDCs reside in close proximity to bone marrow MKs. e, Whole mount histology of BM. MKs: CD41 (grey); pDCs: BST2 (red) and SiglecH (green). The vast majority of bright SiglecH-positive cells also show bright BST2 signal, indicative of pDCs. f, Experimental setup of 2P-IVM and platelet depletion (PD) and MK cell death (MKD). g, 2P-IVM of calvaria bone. MKs: VWF-eGFP (green); pDCs: SiglecH-PE (magenta). Also see Fig. 2a. pDCs migrate with mean speeds of 3-6 μm/min, without significant alteration by platelet depletion of MK cell death. Left: Mean of 3 experiments is plotted (each data-point represents one mouse). Right: Mean of all pooled frames (each data point represents speed at a single frame pooled from 3 experiments). Mean ± SD; one-way ANOVA/Tukey; ns: p = 0.07; ****: p = 0.0000000000000001. Scale bar: 100 μm. h, Histogram showing the distribution of pDCs relative to their distance from MKs (n = 3 mice per group); Mean ± SD; multiple unpaired t-tests; ns: no statistical significance. i, Whole mount histology of control and PD. MKs (green, CD41); pDCs (magenta, BST2+); nuclei (blue, Hoechst). Bar plot: frequencies of pDC-MK- and pDC-MKP contacts; n≥5 mice; unpaired Welch’s t-test; ****(%MK with pDC-contacts): p = 0.000002, ****(%MKP with pDC-contacts): p = 00003; Mean ± SD. PD did not increase the number of bone marrow pDCs (n = 6 mice). Mean ± SD; unpaired t-test Welch’s correction; ns: no statistical significance. Scale bars = 50 µm. Source data
Extended Data Fig. 5
Extended Data Fig. 5. pDCs control megakaryopoiesis.
a-d, Impaired megakaryopoiesis following pDC-depletion in BDCA2-DTR mice. a, DT treatment does not affect megakaryopoiesis. C57BL/6J mice treated with DT (Control A) were compared to untreated BDCA2-DTR mice (Control B). Cell numbers were quantified by FACS; n = 6 mice; Mean ± SD; unpaired t-test Welch’s correction; ns: no statistical significance. b, Cell numbers were quantified by FACS; n = 12 mice; Mean ± SD; unpaired t-test Welch’s correction, ****(MKs and MKPs): p = 0.000000001, ****(pDCs): p = 0.000000000001. c, Cell numbers were quantified by FACS; n = 6 mice; Mean ± SD; unpaired t-test Welch’s correction, ***: p = 0.0002, **: p = 0.0083, *: p = 0.048, ns: no statistical significance. d, Representative confocal micrograph of BM; MKs (green, CD41); pDCs (magenta, BST2+); nuclei (blue, Hoechst). Scale bars = 100 µm. e, pDC-depletion disrupts the megakaryocytic niche and alters the distribution of MKPs and MKs within the BM. BM whole-mounts were stained for MKs (CD41+CD42+) and MKP (CD41+CD42) and positioning was quantified in relation to blood vessels (CD144+). Frequency of MKs and MKPs in close contact to blood vessels significantly decreased following pDC-depletion; n = 12 mice; multiple unpaired t-test/Holm-Sidak, ****(MK(0-5): p = 0.00000000001, **(MK(10-15): p = 0.003, ****(MK( > 20): p = 0.000000001, ****(MKP(0-5): p = 0.000005, *(MKP(5-10): p = 0.01, ****(MK( > 0): p = 0.00000000005; Mean ± SD. Notably, the percentage of high ploidy and therefore large MKs increased after pDC depletion, suggesting that misguided positioning rather reduced MK size underlie the increased distance to the vasculature; n = 3 mice; multiple unpaired t-tests/Holm-Sidak; **(2):p = 0.003, ***(4): p = 0.0003, **(8): p = 0.002, *(16): p = 0.017, ***(32): p = 0.0003, ***(64): p = 0.0007; Mean ± SD. f, Transient pDC depletion and recovery after anti-BST2 treatment (n = 6 mice); Mean ± SD; one-way ANOVA/Tukey; pDCs: ***: p = 0.0001, ****: p = 0.00003, MKPs: ****: p = 0.00000000008 and p = 0.000000003, MKs: ****: p = 0.0000003 and p = 0.0000008. g, Thrombocytopenia and recovery after transient pDC-depletion (n = 6); Mean ± SD; multiple unpaired t-tests/Holm-Sidak; ****: p = 0.000000004 and p = 0.000000001. h, Neutrophil, macrophage and monocyte counts in mice with constitutively reduced pDC-numbers (RS26Cre-ERT2/wt;Tcf4fl/fl BM chimera) (n = 5-7). Mean ± SD; BM: one-way ANOVA/Holm-Sidak; **: p = 0.016; Blood: 2way ANOVA/Holm-Sidak, ****: p = 0.00001 and p = 0.000002. Source data
Extended Data Fig. 6
Extended Data Fig. 6. Innate immune sensing drives pDC activation in response to MK-derived extracellular DNA.
a, FACS analysis of activation markers of BM pDCs following PD (pink: 6 h; red: 24 h). Ctrl/PD6h: n = 4 mice, PD24h: n = 7; one-way ANOVA/Dunnnett; CD69-postive: **: p = 0.0072 and *: p = 0.015, CD86-positive ***: p = 0.0001, ns=0.124; Mean ± SD. b, FACS analysis of activation markers of BM pDCs co-cultured with vital or apoptotic MKs or supernatants and in the presence or absence of DNAseI (n = 3 experiments). Mean ± SD; 2way ANOVA/Tukey; CD86: ****(vital MK vs. dead MK): p = 0.0000003, ****(dead MK vs. dead MK + DNAse): p = 0.000008, ****(vital supernatant vs. dead supernatant): p = 0.000001, ****(dead supernatant vs. dead supernatant + DNAse): p = 0.0000006; CD69: ****(vital MK vs. dead MK): p = 0.00009, ***(dead MK vs. dead MK + DNAse): p = 0.0003, ****(vital supernatant vs. dead supernatant): p = 0.00002, ****(dead supernatant vs. dead supernatant + DNAse): p = 0.0000001. c, MK supernatants contain cell-free DNA (n = 4 experiments). Mean ± SD; one-way ANOVA/Tukey; ****(vital vs. dead): p = 0.00000005, ****(dead vs. dead+DNAse): p = 0.0000003. d, MyD88−/− mice have normal pDC counts in BM (n = 6 mice; FACS) and normal plasma TPO levels (n = 5 mice; ELISA). Mean ± SD; unpaired t test; ns: no statistical significance. Source data
Extended Data Fig. 7
Extended Data Fig. 7. Bulk RNA-seq of MK-primed progenitors.
a, Expression (mRNA) of IFNaR was analysed in sorted MKs and MKPs by RT-PCR. MKPs and MKs from IFNaR−/− mice served as negative control; ß-actin (housekeeping gene); n = 2. b, Representative immunofluorescence staining confirmed expression of IFNaR in isolated MKPs and MKs. IFNaR−/− (negative control) (n = 3). Scale bar=10 µm. c, Left: Schematic of experimental design. MKPs were sorted from BM of mice treated with isotype antibody (grey; n = 2), R300 (PD, purple; n = 3) or R300 plus DT (PD plus pDC depletion, green; n = 2). Right: Expression heatmap of MKP RNA-Seq data. Heatmap shows MKP genes de-regulated (log2FC < 1 or >1 with FDR < 0.05) in either PD versus control or PD vs. platelet depletion with additional pDC depletion. Heatmap was generated using non-hierarchical clustering on rows and columns using ClustVis R package. d, Principal component analysis (PCA) of MKP RNA-Seq data. MKPs exhibit a strong variance shift following PD (grey to magenta). This variance is abrogated when animals were additionally depleted for pDCs (magenta to blue). e, Gene set enrichment analysis was performed on RNA-seq data (Reactom). “Response to type I interferon” is shown. PD compared to control (left) and PD with additional pDC depletion (right). f, Left: intersection analysis (Venn diagram) confirms a high overlap of type I interferon response genes to be inversely regulated between conditions (21 genes of Top 30). Heatmap show unsupervised clustering of differentially regulated genes (unique genes of both Top30 lists). Source data
Extended Data Fig. 8
Extended Data Fig. 8. scRNAseq of MK-primed progenitors.
a, UMAP plot of Control, platelet depletion (PD) and PD+pDC-depletion. Colours indicate the cluster assignment. b, Dot plot of cluster defining genes; Top 10 differentially expressed genes are shown. Identity and colours indicate the clusters shown in panel a. c, Heat map shows cell cycle genes. The colour bar on the top x-axis indicates the clusters shown in panel a. d, Integration of bulk RNAseq data and scRNAseq data. Genes upregulated in response to PD both in bulk and cycling MK-MEPs are shown. Right: Enrichment analysis of identified process associated with increased metabolic activity. e, Integration of bulk RNAseq data and scRNAseq data. Response to type I interferon genes upregulated in response to PD either in bulk and cycling MK-MEPs are shown. f, Decreased MKP and MK numbers in BM chimeric IFNaR−/− mice. Irradiated WT mice received BM from IFNaR−/− or IFNaR +/+ (Control) donors, respectively. Mice were subjected to analysis 8 weeks after transplantation; Mean ± SD; unpaired t-test/Welch’s correction; ****: p = 0.00000000361, ***: p = 0.0010, **: p = 0.0035, *: p = 0.0170. Source data
Extended Data Fig. 9
Extended Data Fig. 9. pDC-driven megakaryopoiesis is altered in infection.
a, Augmented megakaryopoiesis in a humanized mouse model of SARS-CoV-2 infection. BM from FVB;K18hACE2 mice infected with SARS CoV-2 (105 TCID50 SARS-CoV-2/mouse in 25μl intranasally or untreated control mice were analysed by immunohistology (n = 3). MKs (green; CD41; >15 μm); MKPs (green; CD41; <15 μm); pDCs (magenta; BST2). Scale bar = 100 µm. b, n = 3 mice; Mean ± SD; unpaired t-test with Welch’s correction; MK/pDC contact**: p = 0.0081, pDC number: **: p = 0.0037, MK number: ****: p = 0.000049, MKP **: p = 0.0039. c, Frequency of CD69+ and IFN-α expressing pDCs in BM increases after SARS-CoV-2 infection (immunohistology). Mean ± SD; Unpaired t-test with Welch’s correction; *: p = 0.0481, ***: p = 0.0004. d, e, Representative confocal micrographs of human BM (see quantification in Fig. 5e–g). d, white arrows indicate pDCs in contact with MKs (control: n = 5, covid-19: n = 12). e, yellow arrows indicate pDCs expressing large amounts of IFN-α (n = 3). Scale bar = 50 µm. f, pDCs act as BM niche cells that control tissue homeostasis of MKs, complementing systemic regulation by TPO (Graphical summary). Left: TPO is the most studied regulator of platelet homeostasis. TPO is constitutively released from the liver and is scavenged by c-Mpl, the TPO receptor expressed on platelets (see 1). Consequently, a decrease in the number of circulating platelets (see 2) is inherently associated with an increase in plasma TPO levels (see 3), which activates HSCs and MK-primed progenitors in the BM via c-Mpl to drive megakaryopoiesis to meet platelet demand (see 4). Thus, the TPO-dependent homeostatic circuit regulating megakaryopoiesis involves circulating platelets as sensors operating at the systemic level. Right: Mature MKs release extracellular DNA (see 5), which is sensed by pDCs via TLRs (see 6) and leads to the release of IFN-α (see 7). IFN-α drives the proliferation and maturation of HSCs and MK-primed progenitors to replenish megakaryocytes in their BM niche (see 8), preventing MK exhaustion and ensuring continuous platelet production. The pDC-dependent homeostatic circuit thus involves innate immune sensing of apoptotic MKs and operates at the tissue level. Loss of pDC-dependent MK homeostasis at the tissue level cannot be compensated for by TPO-dependent MK homeostasis at the systemic level, indicating a non-redundant role of both pathways in regulating megakaryopoiesis. Source data

References

    1. van der Meijden PEJ, Heemskerk JWM. Platelet biology and functions: new concepts and clinical perspectives. Nat. Rev. Cardiol. 2019;16:166–179. doi: 10.1038/s41569-018-0110-0. - DOI - PubMed
    1. Gaertner F, Massberg S. Patrolling the vascular borders: platelets in immunity to infection and cancer. Nat. Rev. Immunol. 2019;19:747–760. doi: 10.1038/s41577-019-0202-z. - DOI - PubMed
    1. Machlus KR, Italiano JE., Jr. The incredible journey: from megakaryocyte development to platelet formation. J. Cell Biol. 2013;201:785–796. doi: 10.1083/jcb.201304054. - DOI - PMC - PubMed
    1. Noetzli LJ, French SL, Machlus KR. New insights into the differentiation of megakaryocytes from hematopoietic progenitors. Arterioscler. Thromb. Vasc. Biol. 2019;39:1288–1300. doi: 10.1161/ATVBAHA.119.312129. - DOI - PMC - PubMed
    1. Reizis B. Plasmacytoid dendritic cells: development, regulation, and function. Immunity. 2019;50:37–50. doi: 10.1016/j.immuni.2018.12.027. - DOI - PMC - PubMed

MeSH terms