. 2024 Jul;631(8022):826-834.
doi: 10.1038/s41586-024-07684-7. Epub 2024 Jul 10.

Glutamate acts on acid-sensing ion channels to worsen ischaemic brain injury

Affiliations

Glutamate acts on acid-sensing ion channels to worsen ischaemic brain injury

Ke Lai et al. Nature. 2024 Jul.

Abstract

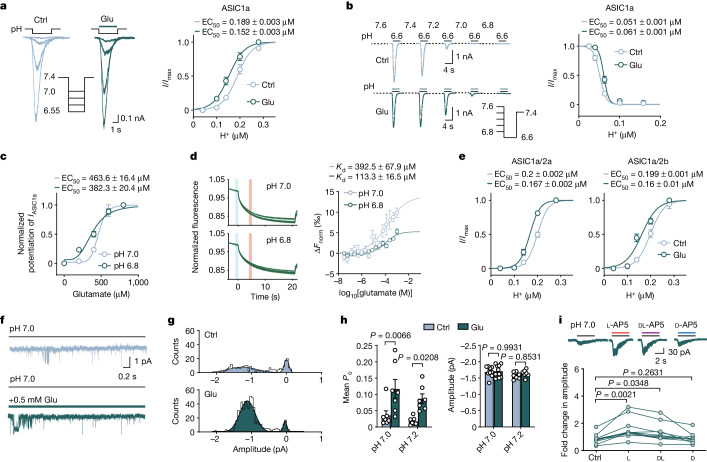
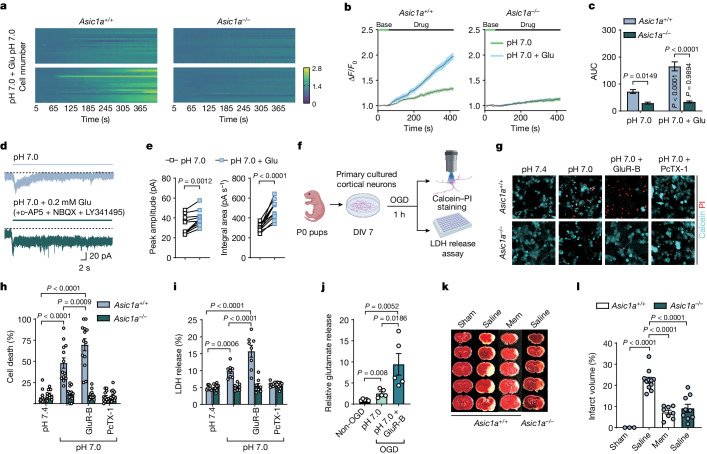
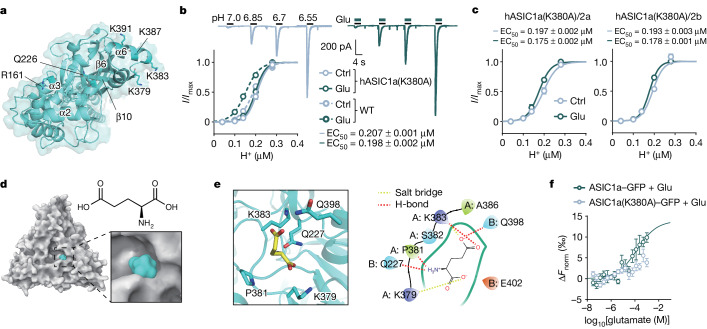
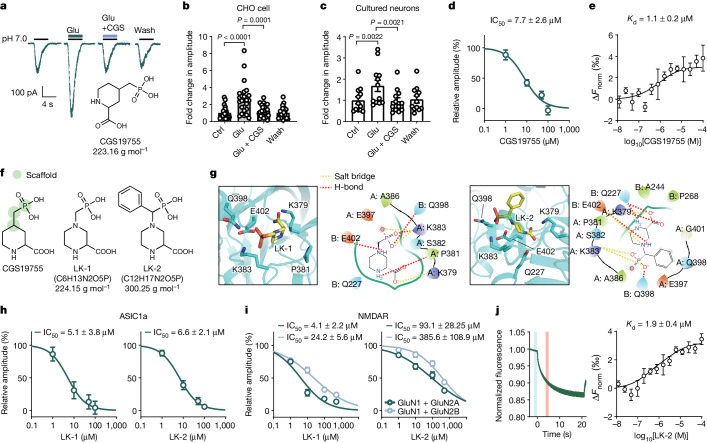
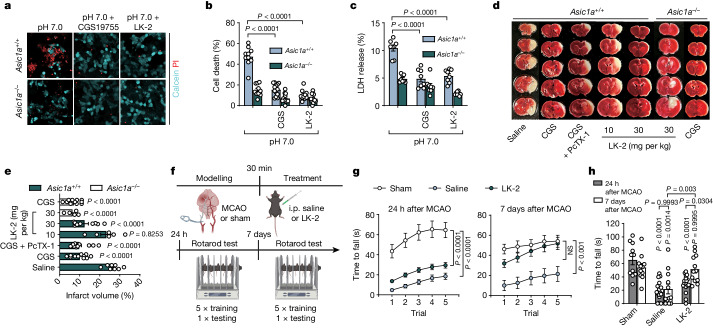
Glutamate is traditionally viewed as the first messenger to activate NMDAR (N-methyl-D-aspartate receptor)-dependent cell death pathways in stroke1,2, but unsuccessful clinical trials with NMDAR antagonists implicate the engagement of other mechanisms3-7. Here we show that glutamate and its structural analogues, including NMDAR antagonist L-AP5 (also known as APV), robustly potentiate currents mediated by acid-sensing ion channels (ASICs) associated with acidosis-induced neurotoxicity in stroke4. Glutamate increases the affinity of ASICs for protons and their open probability, aggravating ischaemic neurotoxicity in both in vitro and in vivo models. Site-directed mutagenesis, structure-based modelling and functional assays reveal a bona fide glutamate-binding cavity in the extracellular domain of ASIC1a. Computational drug screening identified a small molecule, LK-2, that binds to this cavity and abolishes glutamate-dependent potentiation of ASIC currents but spares NMDARs. LK-2 reduces the infarct volume and improves sensorimotor recovery in a mouse model of ischaemic stroke, reminiscent of that seen in mice with Asic1a knockout or knockout of other cation channels4-7. We conclude that glutamate functions as a positive allosteric modulator for ASICs to exacerbate neurotoxicity, and preferential targeting of the glutamate-binding site on ASICs over that on NMDARs may be strategized for developing stroke therapeutics lacking the psychotic side effects of NMDAR antagonists.


Conflict of interest statement

The authors declare no competing interests.

Figures

Fig. 1
Fig. 1. Glutamate and its structural analogues robustly potentiate ASIC currents.
a, Examples of IASICs evoked in an hASIC1a-transfected CHO cell in the absence and presence of 500 μM glutamate for pooled dose–response curves. n = 14. b, An example recording showing steady-state desensitization of ASIC1a currents with and without coapplied glutamate for pooled dose–response curves (n = 11) for each group. c, Dose–response curves for glutamate to potentiate IASICs at pH 7.0 (n = 14) and 6.8 (n = 8). d, MST imaging traces and dose–response curves showing direct binding between glutamate and GFP-tagged ASIC1a at pH 7.0 (n = 5) and 6.8 (n = 6). The vertical bars show the cold fluorescence detected at −1–0 s (blue); hot fluorescence detected at 4–5 s (red). e, Dose–response curves for ASIC1a/2a and ASIC1a/2b currents. n = 13 and 14 cells, respectively. f, Outside-out patch recordings of ASIC single-channel currents evoked by pH 7.0. g, All-points amplitude histogram of ASIC single-channel currents from f; curves were fitted by double Gaussian components. Bin = 0.05 pA. h, The Po and amplitude of ASIC1a unitary currents evoked at pH 7.0 and 7.2. n = 7–9 patches. i, The effects of l-, dl- and d-isomers of AP5 (400 μM) on ASIC1a at pH 7.0. n = 11 cells. Three to six replicated cultures for patch recordings were tested. Data are mean ± s.e.m. Statistical analysis was performed using two-way analysis of variance (ANOVA) (h) and one-way ANOVA (i) with Tukey post hoc correction for multiple comparisons. Source Data
Fig. 2
Fig. 2. Glutamate aggravates neurotoxicity in vitro and in vivo.
ac, Examples and summary of changes in [Ca2+]i levels and time-course imaging in primary cultured cortical neurons from Asic1a+/+ (n = 18 and 18 cells from 3 cultures per group) and Asic1a−/− (n = 16 and 18 cells from 3 cultures per group) mice with and without addition of 200 μM glutamate to the pH 7.0 solution. AUC, area under the curve. d, IASICs evoked at pH 7.0 from cultured cortical neurons for 30 s with and without glutamate. e, The peak amplitude and integral area of IASICs from d were pooled from n = 10 cells from 3 replicated cultures. 50 μM d-AP5, 10 μM NBQX and 10 μM LY341495 were applied. f, Schematic of the cell death experiment. DIV, days in vitro; P0, postnatal day 0. The diagram was created using BioRender (https://biorender.com). g, Calcein–propidium iodide (PI) staining of cultured neurons from Asic1a+/+ and Asic1a−/− mice under different conditions: pH 7.4 or 7.0 with or without 100 ng ml−1 PcTX-1 or GluR-B; glutamate receptor blockers consisted of 50 μM d-AP5, 10 μM NBQX and 10 μM LY341495. h, Summary of the percentage of cell death calculated by calcein (live cells) and propidium iodide (dead cells) counting. n = 10–13 images from 3 replicated cultures for each group. i, LDH release from cultured neurons. n = 8 cultures for each group. j, The relative glutamate release with or without 1 h OGD. n = 5 cultures per group. k, Histology images of brain slices from mice subjected to MCAO. l, Quantification of the infarct volume after MCAO mice were injected with physiological saline and memantine (mem; 1 mg per kg). n = 3, 11, 8 and 9 mice for each group. Data are mean ± s.e.m. Statistical analysis was performed using two-tailed paired t-tests (e), and two-way (c,h,i) and one-way ANOVA (j,l) with Tukey post hoc correction. Source Data
Fig. 3
Fig. 3. Structure-based determination of the glutamate-binding pocket in the extracellular domain of ASIC1a.
a, A top view of cASIC1a (PBD: 5WKU). Top six scoring binding residues of glutamate by initial docking calculation are shown. For clarity, only chain A is shown here. b, IASICs activated in a human ASIC1a(K380A)-transfected CHO cell in the presence and absence of 500 μM glutamate. Dose–response curves (solid lines) were contrasted to those from wild-type ASIC1a channels as in Fig. 1a (dashed lines). n = 12 cells for ASIC1a(K380A). c, Dose–response curves for hASIC1a(K380A)/hASIC2a and hASIC1a(K380A)/hASIC2b currents. n = 10 cells for each group. d, Top view of glutamate-bound cASIC1a. A magnified view of the glutamate-binding pocket is shown at the bottom right. The chemical structure of glutamate is shown at the top right. The surface of cASIC1a and glutamate are coloured white and cyan, respectively. e, The putative glutamate-binding pocket near the outer vestibule of the channel pore. f, MST assay showing the dose–response curve for glutamate binding with wild-type ASIC1a (data from Fig. 1d) or K380A mutant at pH 7.0. n = 5 replicated tests per group. Three to six replicated cultures for patch recordings were tested. Data are mean ± s.e.m. Source Data
Fig. 4
Fig. 4. Identification of selective compounds for the glutamate-binding site on ASIC1a.
a, Representative traces showing the effects of glutamate and CGS19755 on IASICs from an ASIC1a-transfected CHO cell. Inset: the chemical structure of CGS19755. b,c, Summary plots of CGS19755 on glutamate-induced potentiation of IASICs from ASIC1a-transfected CHO cells (b; n = 24 cells) and cultured neurons (c; n = 12 cells). d, Dose–response curve showing that CGS19755 blocked the potentiation of ASIC1a currents by glutamate. n = 15 cells. e, MST assay showing the dose–response curve for binding between CGS19755 and ASIC1a at pH 7.0. n = 5 replicates. f, The chemical structures of CGS19755, LK-1 and LK-2. Green coded circles represent the scaffold for virtual screening. g, LK-1- and LK-2-bound pockets. h, Dose–response curves showing that glutamate-induced potentiation of IASICs was inhibited by LK-1 (n = 14 cells) and LK-2 (n = 12 cells) at pH 7.0. i, Dose–response curves showing that LK-1 (n = 9 and 17 cells for GluN2A and GluN2B) and LK-2 (n = 15 and 21 cells for GluN2A and GluN2B) inhibited NMDAR currents evoked by 100 μM NMDA and 10 μM glycine. NR1 (GluN1) plus NR2A (GluN2A) or NR2B (GluN2B) subunits were co-expressed in CHO cells. j, Representative MST traces and dose–response curve showing direct binding between LK-2 and GFP-tagged ASIC1a at pH 7.0. The vertical bars show cold fluorescence detected at around −1 to 0 s (blue) and hot fluorescence detected at 4–5 s (red). n = 6 replicated tests. Three to six replicated cultures for patch recordings were tested. Data are mean ± s.e.m. Statistical analysis was performed using one-way ANOVA with Tukey post hoc correction (b,c). Source Data
Fig. 5
Fig. 5. Targeting the glutamate-binding site on ASICs with compound LK-2 is neuroprotective.
a, Calcein–propidium iodide staining of cultured neurons with different treatments at pH 7.0 after 1 h OGD with 10 μM CGS19755 or 10 μM LK-2. b, The percentage of cell death from the experiment in a was calculated by counting the number of calcein-stained (live cells) and propidium iodide-stained (dead cells) stained cells. n = 10–13 images from three replicated cultures for each group. c, LDH release of cultured neurons with different treatments after 1 h OGD. n = 8 cultures for each group. d,e, Images of brain slices (d) and quantification of the infarct volume (e) after MCAO in mice administrated with CGS19755 (1 mg per kg, intraperitoneally (i.p.)), PcTX-1 (100 ng per kg, i.n.) and LK-2 (10 mg per kg and 30 mg per kg, i.p.). n = 8, 12, 14, 6, 10, 5 and 11 mice for each group. f, The experimental timeline of the MCAO mouse modelling and behaviour tests. One dose of 30 mg per kg LK-2 was applied. The diagram was created using BioRender. g, Motor learning performance was assessed by plotting the time for mice to fall off a rotarod over 5 trials 24 h and 7 days after MCAO in the sham-, saline- and LK-2-treated groups. h, Summary of the time for mice to fall off the rotarod was assessed by 1 test trial 24 h and 7 days after MCAO. For the behaviour tests, n = 11, 18 and 19 (each group 24 h after MCAO), and n = 11, 12 and 12 (each group 7 days after MCAO) mice. Statistical analysis was performed using one-way ANOVA (e) and two-way ANOVA (b,c,g,h) with Tukey post hoc correction. NS, not significant. Source Data
Extended Data Fig. 1
Extended Data Fig. 1. Glutamate-dependent potentiation of IASICs is independent of Ca2+, Zn2+ binding sites and does not change ion selectivity.
a, Glutamate (500 μM) could not activate currents in blank CHO cells even at pH 6.5. n = 8 cells. b, Glutamate (500 μM) could not activate currents in ASIC1a transfected CHO cells at pH 7.4. n = 6 cells. c, d, Inhibition of IASICs by amiloride at a dose-response manner was not affected by 1 mM glutamate. n = 6 cells. e, MST assay showing no direct binding between glutamate and GFP at pH 7.0 (n = 4 tests). Vertical bars: blue, cold fluorescence detected at −1 ~ 0 s; red, hot fluorescence detected at 4 ~ 5 s. f, g, Representative traces and dose-response curves showing glutamate potentiated IASICs mediated by mutant hASIC1aE427G/D434C devoid of the Ca2+ binding sites. n = 7 cells. h, Dose-response curves showing glutamate potentiated IASICs in ECF containing 0.1 mM Ca2+. n = 9 cells. i, Representative traces and dose-response curves showing glutamate potentiated IASICs in ECF containing 10 μM TPEN. n = 8 cells. j, Representative traces and summary data showing perfusion of 10 μM TPEN for 2 min did not potentiate IASICs at pH 6.5. n = 9 cells. k, l, Representative traces and summary data showing perfusion of 10 μM or 30 μM TPEN for 2 min did not potentiate IASICs at pH 7.0. n = 7 and 6 cells, respectively. m, Representative traces and summary data showing perfusion of 10 μM TPEN for 2 min potentiated IASICs at pH 7.0 in the presence of 50 nM Zn2+ in ECF. n = 10 cells. n, Representative MST traces and dose-response curve showing direct binding between glutamate and GFP-tagged hASIC1aE427G/D434C. Vertical bars: blue, cold fluorescence detected at −1 ~ 0 s; red, hot fluorescence detected at 4 ~ 5 s. n = 3 replicated tests. o, p, Representative traces and current-voltage relationship showing ASIC1a unitary currents recorded at holding potential from −100 mV to −20 mV (20 mV increment) in the presence and absence of 500 μM glutamate at pH 7.0. n = 7 cells. q, Chemical structure of glutamate analogs. r, IASICs recorded before and after 500 μM NMDA, AMPA, aspartic acid (Asp) and kainic acid (KA) treatment at pH 7.0. s, IASICs recorded from cultured neurons from Asic1a+/+ (n = 14 cells) and Asic1a−/− mice (n = 8 cells) at pH 7.0. 500 μM glutamate and 200 μM DL-AP5 were used. Three to six replicated cultures for patch recordings were tested. Data are mean±s.e.m.; two-tailed paired Student’s t-test (a,b,j,k,l,m); two-way ANOVA with Tukey post hoc correction for multiple comparisons (r,s); P values are indicated. Source Data
Extended Data Fig. 2
Extended Data Fig. 2. NMDAR antagonist AP5 directly binds the ASIC1a channel to enhance its open probability.
a, Typical traces showing the effects of glutamate and DL-AP5 on IASICs. b, Summary data showing DL-, L- and D- isomers of AP5 (200 μM) did not block glutamate-enhanced IASICs. n = 9, 11 and 7 cells. c, Outside-out patch recordings of ASIC unitary currents in an ASIC1a transfected CHO cell in the presence and absence of 100 μM DL-AP5 at pH 7.0. Currents were recorded at −60 mV. d, All points amplitude histogram of of ASIC unitary currents was constructed from (c), curves were fitted by two Gaussian components. Bin=0.05 pA. e,f, Quantification of amplitude and mean open probability (Po) of ASIC1a unitary currents evoked in the presence and absence of 500 μM glutamate at pH 7.0 and 7.2. n = 12 and 8 cells for amplitude; n = 9 and 8 cells for Po. g, h, Representative MST traces and dose-response curve showing direct binding between ASIC1a and L-AP5 (n = 4 replicated tests) rather than D-AP5 (n = 4 replicated tests) at pH 7.0. Vertical bars: blue, cold fluorescence detected at −1 ~ 0 s; red, hot fluorescence detected at 4 ~ 5 s. Three to six replicated cultures for patch recordings were tested. Data are mean±s.e.m.; one-way ANOVA with Tukey post hoc correction for multiple comparisons (b); two-tailed paired Student’s t-test (e,f); P values are indicated. Source Data
Extended Data Fig. 3
Extended Data Fig. 3. The effect of L-MSG, monopotassium glutamate (K-Glu) and D-glutamate on ASIC1a.
a, L-MSG potentiated the peak amplitude and integral area of IASIC1a at pH 7.0. n = 9 cells. b, K-Glu potentiate the peak amplitude and integral area of IASIC1a at pH 7.0. n = 11 cells. c, Representative traces showing the effect of D-glutamate (500 μM) on IASIC1a at different pH. d, Dose-response curve for ASIC1a activation with or without D-glutamate. n = 6 cells. Three replicated cultures for patch recordings were tested. Data are mean±s.e.m.; two-tailed paired t-test (a, b). P values are indicated. Source Data
Extended Data Fig. 4
Extended Data Fig. 4. Assessment of cultured neuron and brain injury from Asic1a+/+ and Asic1a−/− mice.
a, Schematic of the experimental protocol of Ca2+ imaging. Cultured cortical neurons were loaded with Fluo 3-AM for 20 min followed by a 15 min washing step in ECF. After 1 min baseline recording, neurons were imaged for 6 min following pH 7.0 solution with or without glutamate in the presence of 10 μM NBQX, 1 μM MK801 and 100 μM CdCl2 to block AMPA receptors, NMDA receptors and voltage-gated calcium channels, respectively. b, c, [Ca2+]i changes of primary cultured cortical neurons imaged from Asic1a+/+ mice (n = 20–26 cells from 3 cultures per group). 200 μM glutamate, 10 μM LY341495 (mGluRs blockers), 10 μM CGP37157 (inhibitor of Na+/Ca2+ exchanger in mitochondria), 10 μM RO2959 (selective Ca2+ release-activated Ca2+ channel inhibitor) and 100 ng/ml PcTX-1 were applied. d, Schematic flow of the experimental protocol of mitochondrial potential assay. Cultured cortical neurons were loaded with JC-1 for 20 min followed by a 5 min washout. After 1 min baseline imaging, neurons were recording for 5 min following pH 7.0 solution with or without glutamate. e, Representative images showing the mitochondrial potential changes with different treatment from wildtype and Asic1a−/− mice. With mitochondrial potential depolarization, fluorescence intensity of JC-1 monomer (green) enhanced, while JC-1 aggregate (red) faded. First frame at 5 s and last frame at 360 s are shown here for comparisons. f, Fluorescence changes in response to different treatments imaged from Asic1a+/+ (n = 12 and 10 cells from 3 cultures per group) and Asic1a−/− (n = 16 and 15 cells from 3 cultures per group) cultured cortical neurons. The ratio of red and green fluorescence density was normalized to their initial value. Grey lines represented responses of individual cells while black line was the mean of all cells. g, Summary data for the AUC (left panel) and peak response amplitude (right panel) of mitochondrial membrane potential (Ψm) changes during treatment. h, Representative images showing the calcein-PI staining of cultured neurons from Asic1a+/+ and Asic1a−/− mice with different treatments. GluR-B: glutamate receptor blockers consisted of 50 μM D-AP5, 10 μM NBQX and 10 μM LY341495. i, Summary data showing the percentage of cell death calculated by calcein (live cells) and PI (dead cells) counting with different treatments. n = 10–13 images from 3 replicated cultures for each group. j, Summary data showing LDH release of cultured neurons from Asic1a+/+ and Asic1a−/− mice with different treatments. n = 8 cultures for each group. k, Representative traces showing IASICs evoked by pH 7.0, 6.5 and 6.0 solution from primary cultured cortical neurons were recorded for 30 s with and without glutamate. 50 μM D-AP5, 10 μM NBQX and 10 μM LY341495 were applied to block NMDARs, AMPARs and mGluRs, respectively. Dashed lines: baselines. Tonic current was indicated. l, Summary data showing amplitude of tonic current. n = 10, 7 and 10 cells from 3 replicated cultures per group. m, GluR-B (200 μM D-AP5, 10 μM NBQX and 10 μM LY341495) did not affect IASIC1a at pH 7.0. n = 8, 7, 8 cells, respectively. n, PI staining in ASIC1a-GFP transfected CHO cells after 1 h different treatments. 500 μM glutamate and 100 ng/ml PcTX-1 were applied. o, The percentage of cell death calculated by PI, GFP+ and GFP counting. n = 10–13 images from 3 replicated cultures for each group. p, Schematic illustration of the timeline of MCAO treatment. q, Laser speckle imaging at 5 min pre-MCAO, 15 min post-occlusion (MCAO) and 15 min post-reperfusion (post-MCAO) in Asic1a+/+ and Asic1a−/− mice. r, Summary data showing the relative cerebral blood flow (rCBF) changes during MCAO in Asic1a+/+ and Asic1a−/− mice. n = 5 mice per group. s, Representative images and summary data showing infarct volume after MCAO from wildtype mice injected with NMDAR blocker, memantine (i.p.). n = 10, 8 mice. Three replicated cultures for patch recordings were tested. Data are mean±s.e.m.; one-way (l) and two-way (g,i,j,m,o,r) ANOVA with Tukey post hoc correction for multiple comparisons; two-tailed unpaired t-test (s). P values are indicated. Source Data
Extended Data Fig. 5
Extended Data Fig. 5. Alignment of ASIC1a among different species shows highly conserved sequences in Aves and Mammalia.
a, Sequence alignment of the mASIC1a (mouse), rASIC1a (rat), hASIC1a (human) and cASIC1a (chicken). Homologous regions are coloured red background. b, Table showing percentage of ASIC1a amino acid sequence identity among different species.
Extended Data Fig. 6
Extended Data Fig. 6. Screening glutamate-binding sites by site-directed mutagenesis.
a, Dose-response curves showing the effects of 500 μM glutamate on mASIC1a (n = 5 cells) and mASIC1aK378A (n = 6 cells) currents in CHO cells. b, Dose-response curves showing the effects of 500 μM glutamate on IASICs in R160A (n = 5 cells), K384A (n = 7 cells), Q225L (n = 3 cells), K388A (n = 9 cells) and K392A (n = 15 cells) mutants of hASIC1a transfected CHO cells. Glutamate enhances IASICs in K384A, Q225L and K388A mutants transfected CHO cells but not in R160A and K392A mutants. However, IASICs in R160A mutant significantly decreased in amplitude when compared to that by mASIC1a, making it unlikely to be a glutamate-binding site. c, Table showing EC50 for each mutant in (b). Three replicated cultures for patch recordings were tested. Data are mean±s.e.m. Source Data
Extended Data Fig. 7
Extended Data Fig. 7. In silico and MST analyses validate the glutamate binding pocket on ASIC1a.
a, Plots of docking scores and MM/GBSA values of glutamate binding to cASIC1a. Mutant indicates K379A. n = 5 and 10 poses, respectively. b, Overall structure of glutamate-NMDAR complex (PDB: 5IOU) and a close-up view of glutamate-binding pocket. The interactions between glutamate and surrounding residues are shown as yellow (salt bridge) and red (hydrogen-bond) dash lines. c, Summary data by computational calculation showing docking scores and MM/GBSA of glutamate binding to NMDAR and cASIC1a. n = 5 and 5 poses, respectively. d, A snapshot of the simulation box of the glutamate-cASIC1a complex in 150 mM NaCl solution. Glutamate is shown as yellow spheres, cASIC1a is shown as cyan cartoon, water is shown as transparent surface. For clarity, ions are omitted. e, Structural stability of ligand in wildtype and mutant conformations was measured as the RMSD (unit: nm) over a 50-ns time course. f, Binding energy for glutamate-cASIC1a complex was calculated by the MM-PBSA method. g, Binding energy of glutamate-cASIC1a complex for amino acid residues from 370 to 400 over a 50-ns time course. Several residues with high binding energy were labelled. h, Conformations of wildtype and mutant cASIC1a before (white) and after (cyan) 50 ns MD simulation. Structures were aligned. For clarity, only chain A is shown here. Blue arrows indicated the direction of conformational change. i, RMSD (unit: nm) of glutamate-cASIC1a complex in wildtype and mutant conformations over a 50-ns time course. j, RMSF (unit: nm) of glutamate-cASIC1a complex in wildtype and mutant conformations throughout chain A residues. Zoom-in view of RMSF from residues 370 to 400 is shown in the right panel. k, l, Representative MST traces and dose-response curve showing direct binding between glutamate and GFP-tagged ASIC1a in the presence of 100 μM amiloride, a pore blocker of ASIC1a. Vertical bars: blue, cold fluorescence detected at −1 ~ 0 s; red, hot fluorescence detected at 4 ~ 5 s. n = 3 replicated tests. m, Representative MST traces and dose-response curve showing no direct binding between ASIC1a and glutamate at pH 7.4 (n = 3 replicated tests). Vertical bars: blue detected at −1 ~ 0 s, cold fluorescence; red, hot fluorescence detected at 4 ~ 5 s. Data are mean±s.e.m.; two-tailed unpaired t-test (a,c). P values are indicated. Source Data
Extended Data Fig. 8
Extended Data Fig. 8. Pharmacological effects of glutamate receptor antagonists and agonist on IASICs in CHO cells.
a, d, g, Chemical structure of CGP39551, CPP and L-Aminoadipic acid (L-AA). b, c, e, f, 100 μM CGP39551 and CPP, competitive antagonists of NMDA receptors, had no effect on IASICs and could not block glutamate-induced potentiation of IASICs. n = 9 cells (b), 9 cells (c), 13 cells (e) and 14 cells (f). h, i, 100 μM L-AA, an agonist for NMDAR and metabotropic glutamate receptors (mGluRs), had no effect on IASICs, however, could eliminate glutamate-induced potentiation of IASICs. n = 13 cells (h) and 13 cells (i). Three to six replicated cultures for patch recordings were tested. Data are mean±s.e.m.; two-tailed paired t-test (b, e, h); one-way ANOVA with Tukey post hoc correction (c, f, i). P values are indicated. Source Data
Extended Data Fig. 9
Extended Data Fig. 9. CGS19755 acts as a promising neuroprotectant against cell injury in vitro.
a, CGS19755 (100 μM), a competitive antagonists of NMDA receptors, had no effect on IASICs at pH 7.0. n = 6 cells. b, Three-dimensional and two-dimensional images showing the glutamate binding pocket shared by CGS19755. The interactions between CGS19755 and surrounding residues are shown as yellow (salt bridge) and red (hydrogen-bond) dash lines. c, Determination of CGS19755 for basal cell death (1 h of exposure to CGS19755) in primary cortical neurons by LDH release assay. n = 5 wells for each concentration. N.A., not applicable. d, e, Calcium imaging of cultured cortical neurons recorded from wildtype mice with treatment of 500 μM glutamate alone or in combination with 100 μM CGS19755 in pH 7.0 solution. f, Quantification of AUC from Ca2+ imaging under two treatment conditions. n = 18 and 20 cells for each group. g, h, Representative images and traces showing changes of the mitochondrial potential of individual cells (grey) and their means (black) with different treatments of neurons from wildtype mice. When mitochondrial potential (absolute value) decreasing, fluorescence intensity of JC-1 monomer (green) enhanced, while JC-1 aggregate (red) faded. First frame at 5 s and last frame at 360 s are shown here (g). i, Quantifications of AUC of drug treatment (left panel) and peak amplitude (right panel) showing changes in mitochondrial membrane potential (Ψm) in pH 7.0 solution with glutamate alone or in combination with CGS19755. n = 9 and 13 cells for each group. Three replicated cultures for patch recordings were tested. Data are mean±s.e.m.; two-tailed paired t-test (a); two-tailed unpaired t-test (f, i). P values are indicated. Source Data
Extended Data Fig. 10
Extended Data Fig. 10. In silico screening identifies LK-2 over LK-1 with more favourable pharmacological and pharmacokinetics profiles as a candidate for stroke therapy.
a, Flow chart showing strategy for computational virtual screening of LK-1 and LK-2 based on the backbone structure of CGS19755. b, Glutamate-dependent enhancement of IASICs was inhibited by 100 μM LK-1 (n = 7 cells) or 100 μM LK-2 (n = 12 cells) in ASIC1a transfected CHO cells. c, d, 10 μM LK-1 and 10 μM LK-2 did not affect activation (n = 7 and 7 cells) and desensitization (n = 6 and 7 cells) of IASICs in ASIC1a transfected CHO cells. e, 100 μM LK-1 (n = 9 cells) or 100 μM LK-2 (n = 8 cells) inhibited NMDAR currents in acute isolated cortical neurons. 100 μM NMDA and 1 μM glycine were applied. f, PI staining in ASIC1a-GFP transfected CHO cells after 1 h glutamate (500 μM) treatment with or without 10 μM LK-2. g, The percentage of cell death calculated by PI, GFP+ and GFP- counting. n = 10–14 images from 3 replicated cultures for each group. h, Pharmacokinetic test in vivo showing the concentration of LK-2 in plasma and brain detected by LC-MS/MS. n = 4 samples for each time point. i, Quantification of time to fall from rod in rotarod tests in LK-2 injected male and female mice (24 h post-MCAO, n = 11 and 8 mice for male and female mice; 7 days post-MCAO, n = 6, and 6 mice for male and female mice). Three to six replicated cultures for patch recordings were tested. Data are mean±s.e.m.; two-tailed paired t-test (c); one-way (b,e) and two-way (g,i) ANOVA with Tukey post hoc correction. P values are indicated. Source Data

References

    1. Dirnagl, U., Iadecola, C. & Moskowitz, M. A. Pathobiology of ischaemic stroke: an integrated view. Trends Neurosci.22, 391–397 (1999). - PubMed
    1. Lee, J. M., Zipfel, G. J. & Choi, D. W. The changing landscape of ischaemic brain injury mechanisms. Nature399, A7–A14 (1999). - PubMed
    1. O’Collins, V. E. et al. 1,026 experimental treatments in acute stroke. Ann. Neurol.59, 467–477 (2006). - PubMed
    1. Xiong, Z. G. et al. Neuroprotection in ischemia: blocking calcium-permeable acid-sensing ion channels. Cell118, 687–698 (2004). - PubMed
    1. Gao, J. et al. Coupling between NMDA receptor and acid-sensing ion channel contributes to ischemic neuronal death. Neuron48, 635–646 (2005). - PubMed

MeSH terms

LinkOut - more resources