. 2024 Jul;631(8022):913-919.
doi: 10.1038/s41586-024-07680-x. Epub 2024 Jul 10.

CryoET of β-amyloid and tau within postmortem Alzheimer's disease brain

Affiliations

CryoET of β-amyloid and tau within postmortem Alzheimer's disease brain

Madeleine A G Gilbert et al. Nature. 2024 Jul.

Abstract

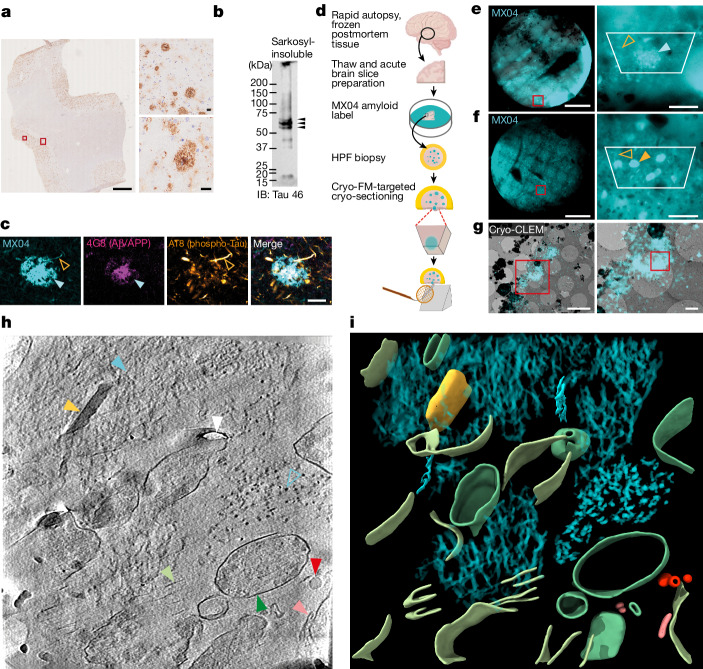
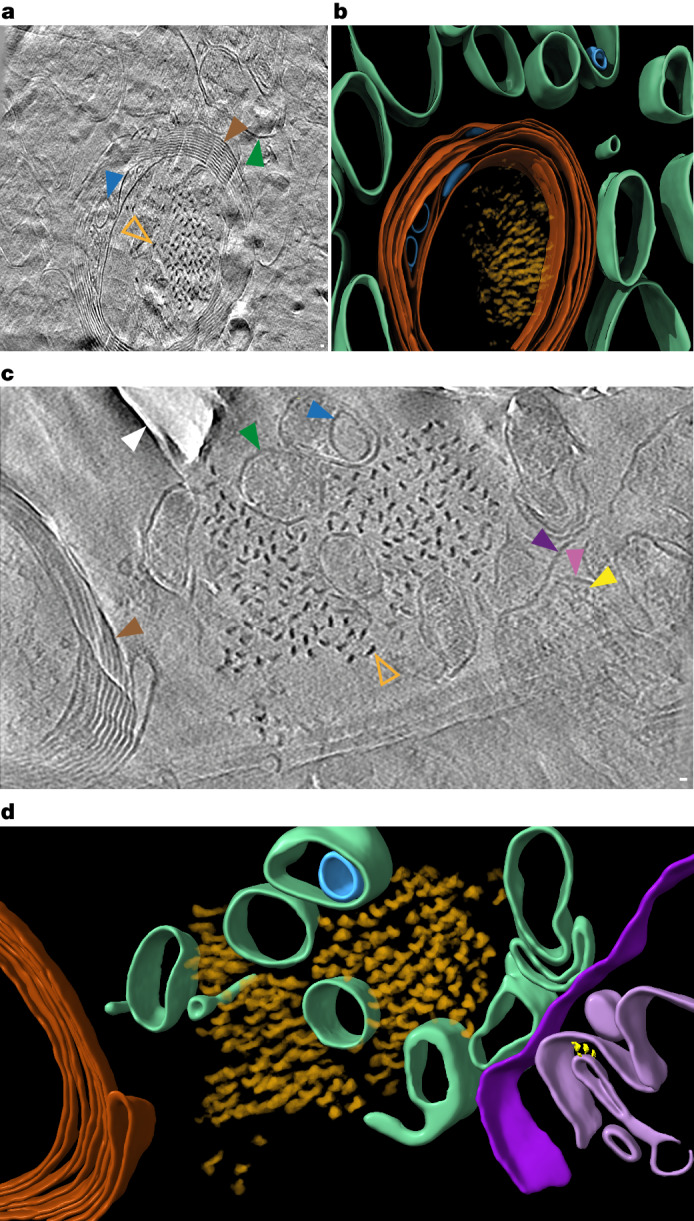
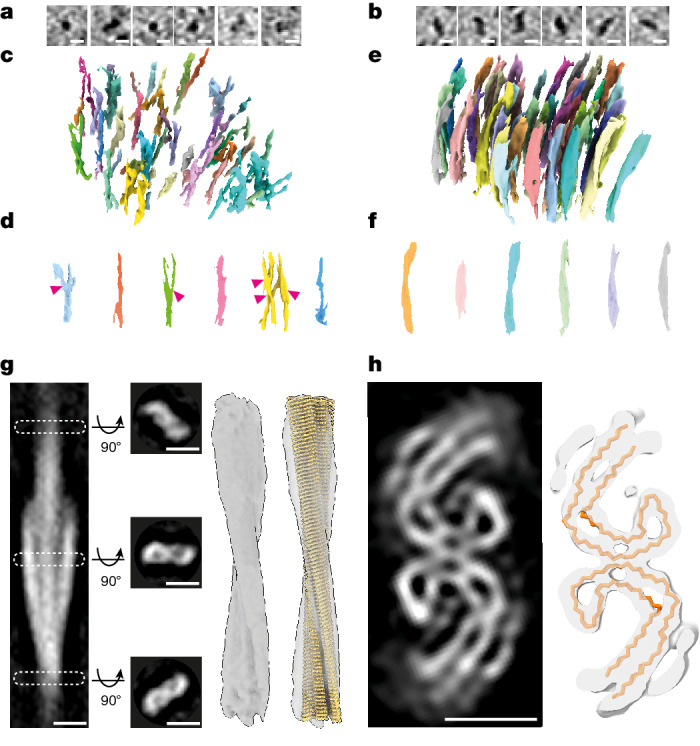
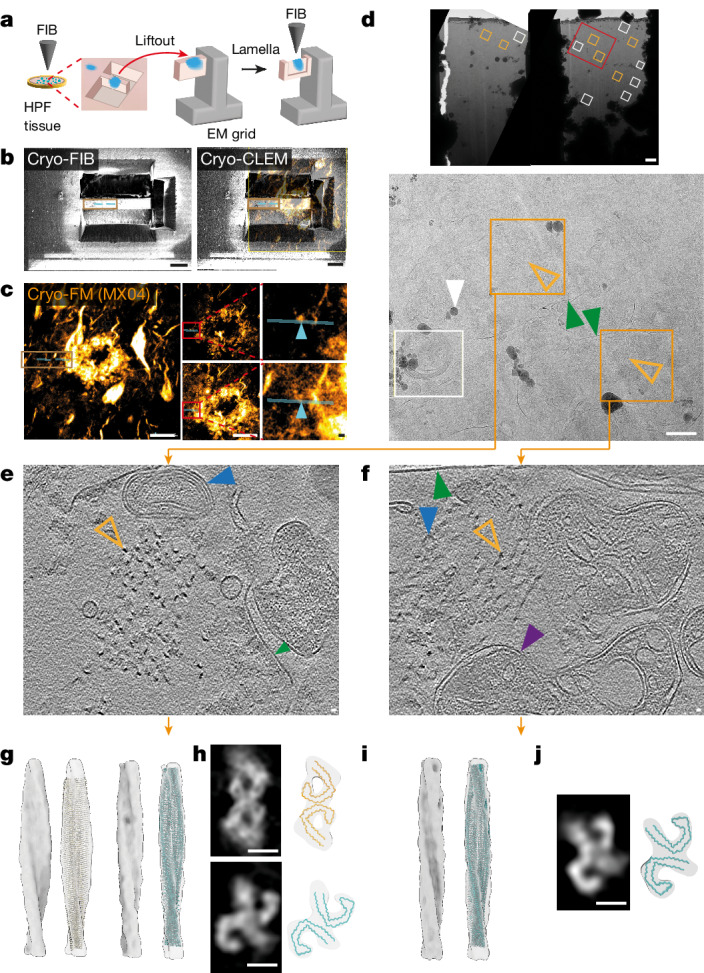
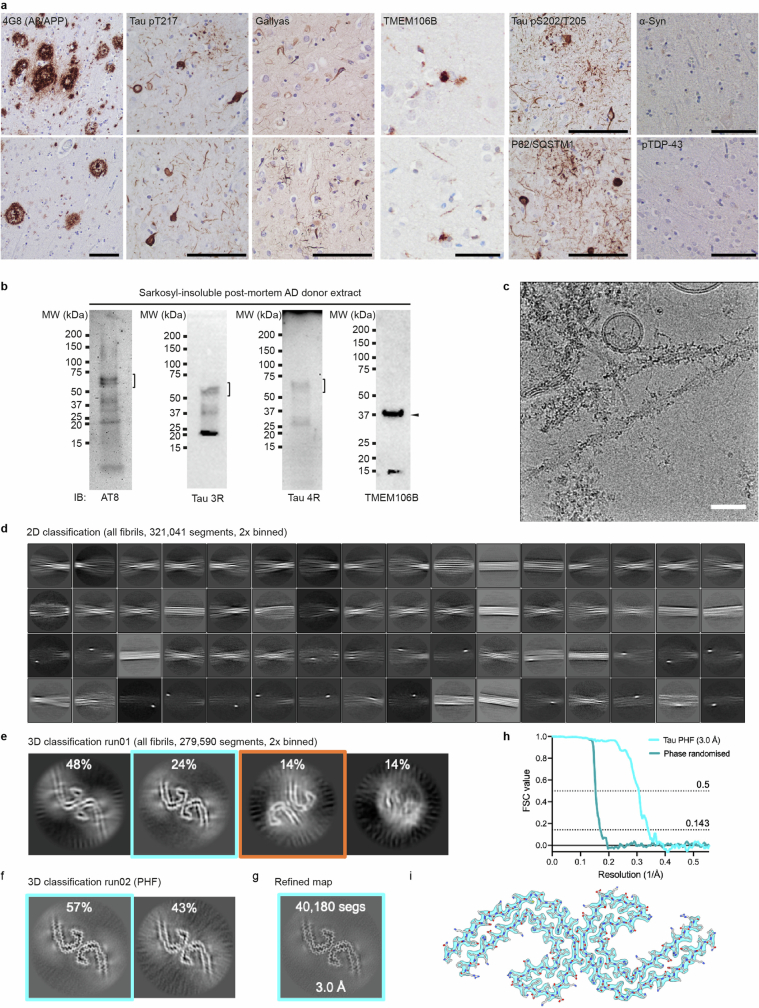
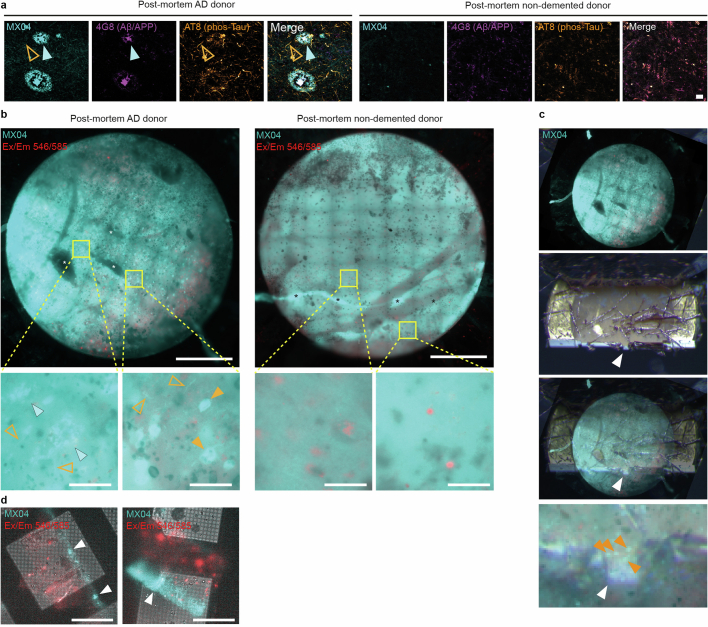
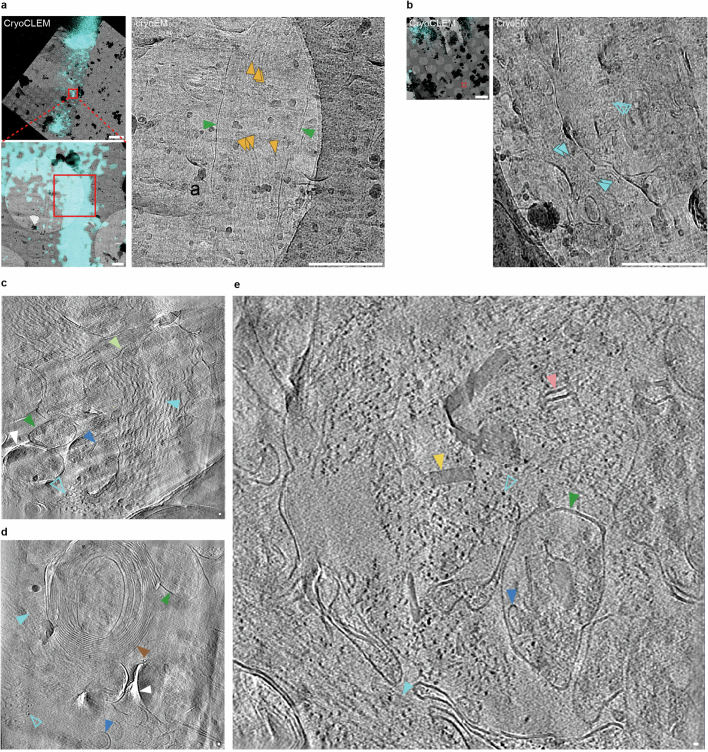
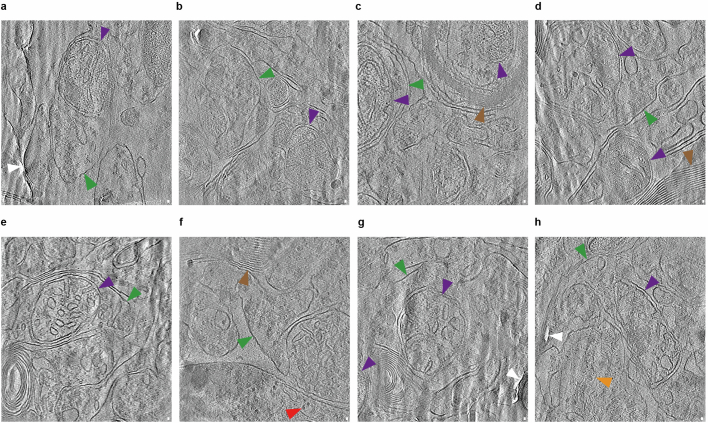
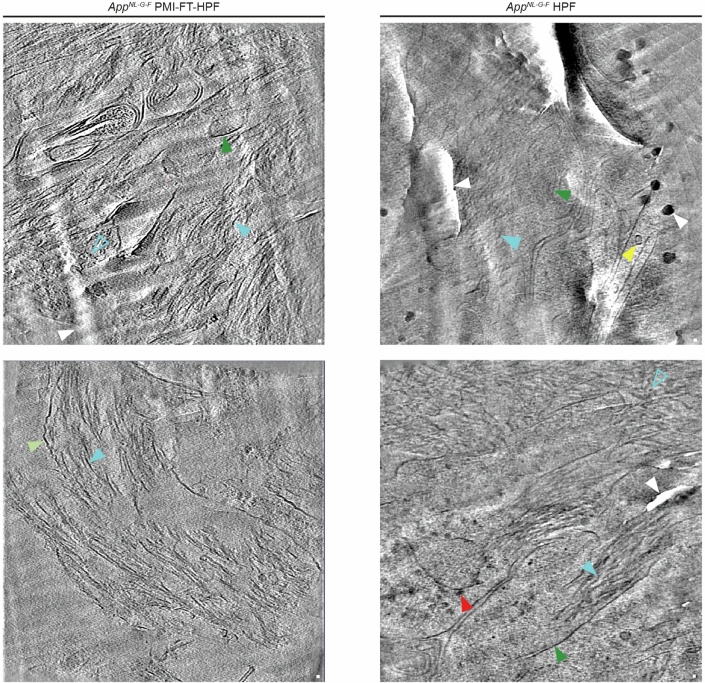
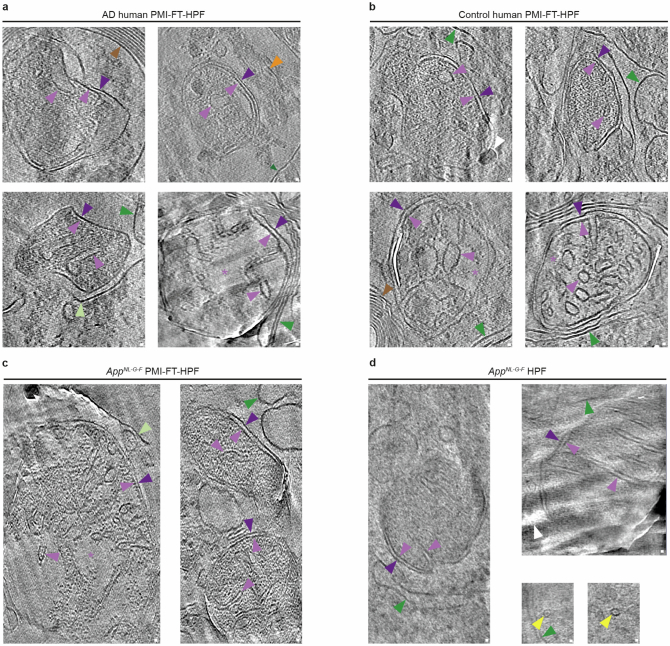
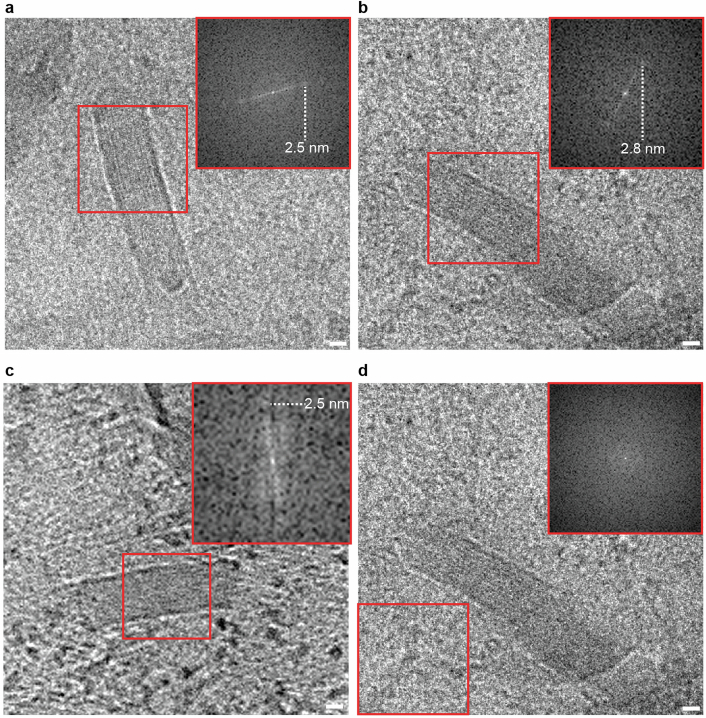
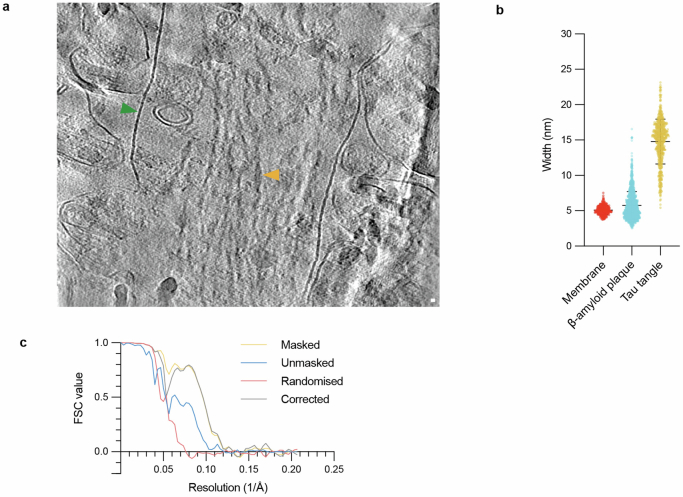
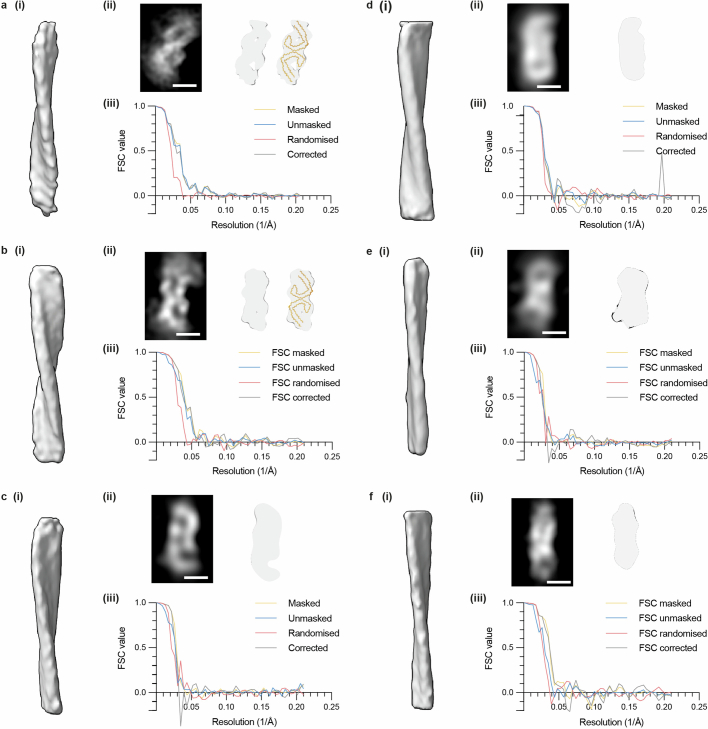
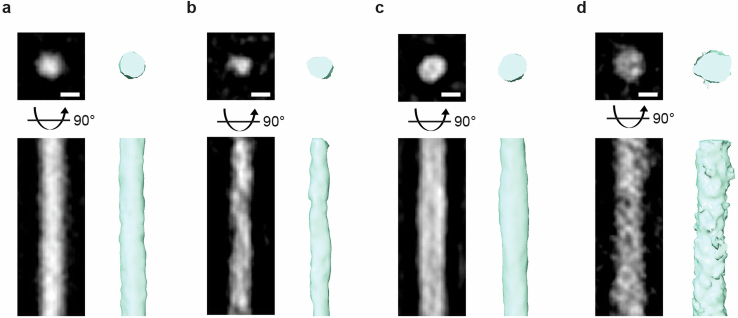
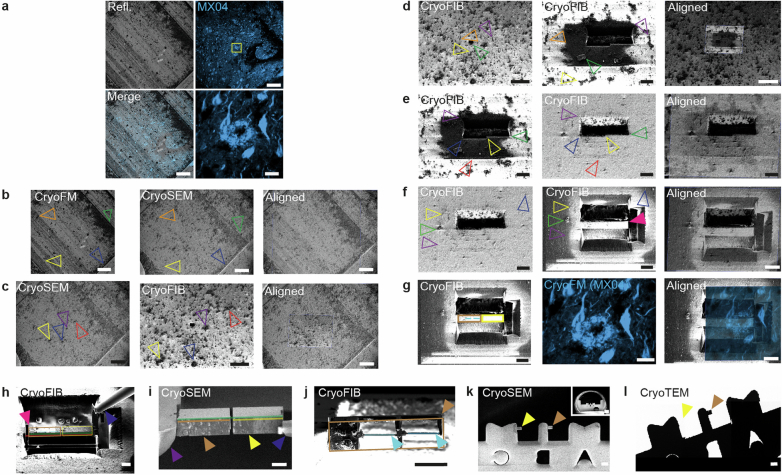
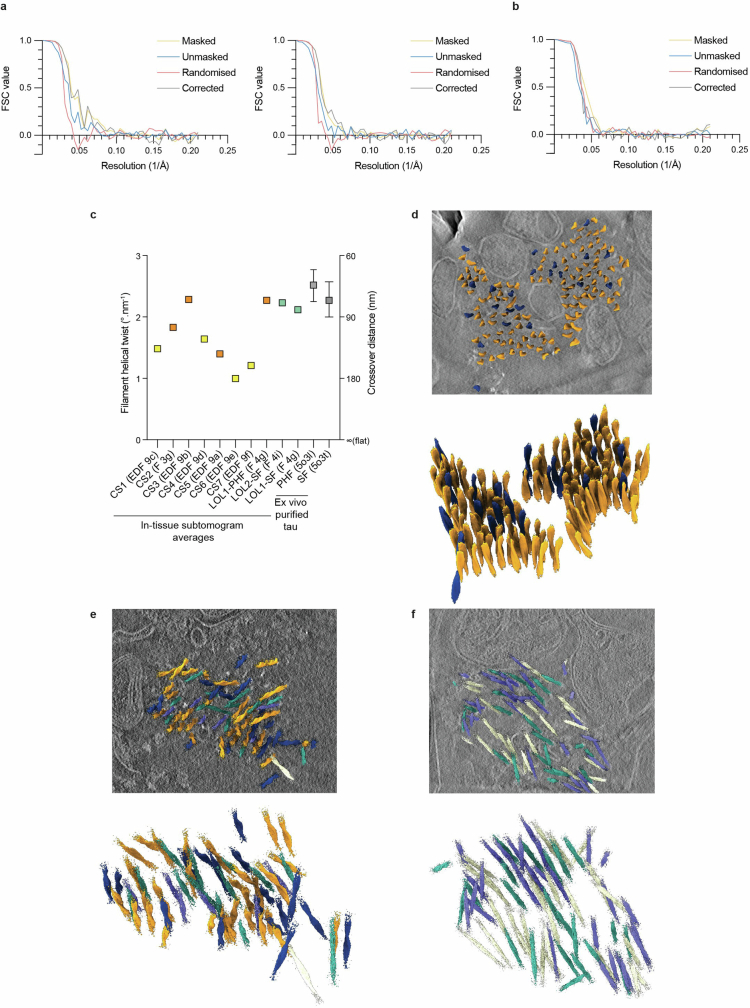
A defining pathological feature of most neurodegenerative diseases is the assembly of proteins into amyloid that form disease-specific structures1. In Alzheimer's disease, this is characterized by the deposition of β-amyloid and tau with disease-specific conformations. The in situ structure of amyloid in the human brain is unknown. Here, using cryo-fluorescence microscopy-targeted cryo-sectioning, cryo-focused ion beam-scanning electron microscopy lift-out and cryo-electron tomography, we determined in-tissue architectures of β-amyloid and tau pathology in a postmortem Alzheimer's disease donor brain. β-amyloid plaques contained a mixture of fibrils, some of which were branched, and protofilaments, arranged in parallel arrays and lattice-like structures. Extracellular vesicles and cuboidal particles defined the non-amyloid constituents of β-amyloid plaques. By contrast, tau inclusions formed parallel clusters of unbranched filaments. Subtomogram averaging a cluster of 136 tau filaments in a single tomogram revealed the polypeptide backbone conformation and filament polarity orientation of paired helical filaments within tissue. Filaments within most clusters were similar to each other, but were different between clusters, showing amyloid heterogeneity that is spatially organized by subcellular location. The in situ structural approaches outlined here for human donor tissues have applications to a broad range of neurodegenerative diseases.


Conflict of interest statement

The authors declare no competing interests.

Figures

Fig. 1
Fig. 1. In situ cryoET of vitrified postmortem AD brain.
a, Immunohistochemical detection of Aβ/APP pathology in postmortem AD donor. Scale bar, 2 mm. Large and small red rectangles, indicate close-up images shown in upper- and lower-right panels, respectively. Scale bar, 20 μm. b, Immunoblot detection of sarkosyl-insoluble tau (tau 46). Arrowheads, indicate full-length phospho-tau bands. c, Fluorescence confocal microscopic detection (left to right) of amyloid (MX04), Aβ/APP (4G8), phospho-Tau (AT8) and merged in an AD postmortem donor brain. Cyan arrowhead, β-amyloid plaque; open orange arrowhead, tau thread. Scale bar, 20 μm. d, Schematic showing the preparation of AD postmortem brain for in situ structure determination by cryo-CLEM and cryoET. Schematic adapted from ref. , Springer Nature Limited). e, Left, cryo-FM of HPF AD postmortem brain biopsy. Cyan, MX04 fluorescence; red box, region shown in close up. Scale bar, 0.5 mm. Right, close up. Cyan arrowhead, putative β-amyloid plaque; open orange arrowhead, putative tau thread; white trapezium, area encompassing tissue from which tissue cryo-sections were collected. Scale bar, 50 µm. f, Same as e but showing tau tangle and threads indicated by closed and open orange arrowheads, respectively. g, Left, cryo-CLEM targeting of MX04-labelled β-amyloid plaque in tissue cryo-section. Red rectangle, region shown in close up. Scale bar, 1 µm. Right, close up. Red rectangle, location from which cryoET data were collected (Supplementary Video. 2). Scale bars, 5 µm (left) and 1 µm (right). h, Tomographic slice of β-amyloid pathology in postmortem AD brain cryo-section. Filled and open cyan arrowhead, fibril in the xy plane and axially (z axis) of the tomogram, respectively; yellow arrowhead, extracellular cuboidal particle; red arrowhead, extracellular droplet; pink arrowhead, extracellular vesicle; dark green arrowhead, subcellular compartment; light green arrowhead, burst plasma membrane compartment; white arrowhead, knife damage. Scale bar, 10 nm. i, Segmentation of tomogram coloured as in h.
Fig. 2
Fig. 2. In situ cryoET of tau deposits in vitrified postmortem AD brain.
a, Tomographic slice of intracellular tau pathology in postmortem AD brain cryo-section (Supplementary Video 4). Open orange arrowhead, filament oriented axially (z axis) within the tomogram; brown arrowhead, myelinated axon; green arrowhead, subcellular compartment; blue arrowhead, intracellular membrane-bound organelle. Scale bar, 10 nm. b, Segmentation of tomogram coloured as in a. c, Tomographic slice of extracellular tau pathology in AD postmortem brain cryo-section (Supplementary Video 5). Open orange arrowhead, tau filament oriented axially (z axis) within the tomogram; brown arrowhead, myelinated axon; dark and light purple arrowheads, outer and inner membranes of damaged mitochondrion, respectively; yellow arrowhead, putative Fo-F1 ATPase; dark green arrowhead, subcellular compartment; blue arrowhead, intracellular membrane-bound organelle; white arrowhead, knife damage. Scale bar, 10 nm. d, Segmentation of tomogram coloured as in c.
Fig. 3
Fig. 3. In-tissue architecture of β-amyloid fibrils and tau filaments, and subtomogram averaging of tau filaments within postmortem AD brain.
a, Tomographic slices showing a panel of β-amyloid fibrils oriented axially (z axis) within the tomogram. Scale bar, 10 nm. b, Tomographic slices showing a panel of tau filaments oriented axially (z axis) within the tomogram. Scale bar, 10 nm. c,d, Side views of raw tomographic density containing a lattice of β-amyloid (c) and individual fibrils (d). Each individual amyloid fibril is coloured differently: 33% (17 out of 51) of β-amyloid fibrils had branch points. Magenta arrowhead, branch point. e,f, As in c (e) and d (f), but for tau. g, Subtomogram average of 136 tau filaments (stalkInit, Methods) located extracellularly from one tomogram (Fig. 2c,d and Supplementary Video 5). The left panel shows a side view of tomographic slice through averaged volume showing helical twist. White dashed rectangles, position of middle left panels along filament axis of three top view tomographic slices (23.75 nm apart) showing a pair of C-shaped protofilaments consistent with the substructure of ex vivo purified tau PHF. The middle right and right panels show a subtomogram average map of tau filament with and without atomic model of ex vivo purified tau PHF (yellow, PDB 5o3l) fitted into the map, respectively. Scale bar, 10 nm. h, Helical averaging of tau filament subvolumes from one AD cryo-section tomogram (Fig. 2c,d and Supplementary Video 5) (8.7 Å resolution at FSC 0.143, Extended Data Fig. 8c). Left, slice through averaged subvolume. Right shows a Cα trace of ex vivo purified tau PHF atomic model PHF (yellow, PDB 5o3l) fitted using EM placement, into averaged map. Scale bar, 5 nm.
Fig. 4
Fig. 4. cryo-CLEM-targeted cryo-FIB-SEM lift-out lamellae of tau thread in AD brain.
a, Schematic summarizing cryo-CLEM-targeted cryo-FIB-SEM lift-out lamellae preparation of MX04-labelled amyloid (blue) from HPF brain. b, Left, cryo-FIB image of HPF brain showing tissue chunk before lift-out. Right, cryo-FIB image aligned with confocal cryo-FM of MX04-labelled amyloid. Brown rectangle, tissue chunk; cyan line, locations of tissue lamella. Scale bar, 20 μm. c,e,f, The left shows MX04 confocal cryo-FM of HPF tissue targeted for preparation of lift-out lamellae. The middle shows cryo-FM optical z slices 1.9 μm apart. Scale bar, 20 μm. Red rectangles, regions in close-ups. The right shows close-ups. Cyan line, location of tissue lamella; cyan arrowhead, microscopic regions of MX04-labelled amyloid corresponding to locations above and below the first (e) and second (f) tomograms. Scale bar, 1 μm. d, Top, cryo-EM of two lift-out lamellae. Red rectangle, region enlarged below. Scale bar, 1 μm. Bottom, close up. Orange rectangle, tomograms of tissue lamella containing tau filaments; orange arrowhead, tau filament cluster; green arrowhead, plasma membrane-bound subcellular compartment; white arrowhead, ice contamination; white rectangle, location of tomogram lacking tau filaments. Scale bar, 500 nm. e,f, Tomographic slices of tau thread in tissue lamella. Orange arrowhead, tau filament; purple arrowhead, mitochondrion; green arrowhead, membrane enclosing subcellular compartment; blue arrowhead, intracellular membrane-bound organelle. Scale bar, 10 nm. g, Subtomogram averaging of 52 PHF and 19 SF. Left and middle left, averaged maps without and with tau PHF atomic model (yellow, PDB 5o3l) fitted into the subtomogram average map, respectively. Middle right and right, same as left and middle left but for SF without and with atomic model of ex vivo purified SF (cyan, PDB 5o3t). h, Helical averaging of tau filament subvolumes. Top and bottom panels, PHF and SF maps, respectively. Top left, slice through averaged subvolume. Top right, tau PHF Cα trace (yellow, PDB 5o3l) fitted using EM placement, into an averaged map. Bottom left and right, same as top but for SF (cyan, PDB 5o3t). Scale bar, 5 nm. i,j, As in g (i) and h (j) but for the neighbouring SF only cluster.
Extended Data Fig. 1
Extended Data Fig. 1. Neuropathological, biochemical, and cryoEM characterisation of post-mortem AD donor.
a, Formalin-fixed paraffin embedded tissue from the mid-temporal gyrus of the AD case assessed for amyloid pathology. Representative pairs of images showing from left to right, β-amyloid deposits detected with 4G8, tau pathology assessed with Tau phospho-S217 antibody, Gallyas silver staining to detect amyloid deposits, TMEM106B (C-terminal domain) inclusions, tau phosphoS202/T205 (AT8), and P62/SQSTM1 (a marker of aggregated protein) and the absence of α-synuclein and phospho-TDP-34 inclusions. Scale bar, 50 μm. b, Immunoblot detection of sarkosyl-insoluble fraction of AD post-mortem brain, from left to right, of phospho-Tau (AT8), three-repeat (3 R) tau, four-repeat (4 R) tau, and TMEM106B (C-terminal domain). Brackets, full-length tau bands. Arrowhead, proteolysed TMEM106B. c, Example micrograph from the cryoEM dataset of sarkosyl-insoluble amyloid purified from post-mortem AD donor. Scale bar, 50 nm. d, The most populated 2D class averages following classification of all fibril segments. Most of the resolvable classes resembled PHF and SF. e-f, Central slices of output maps from 3D classifications, annotated with segment distributions as a percentage within each run. Selected classes taken for further processing are highlighted in coloured boxes. Classification yielded 40,180 PHF segments (cyan) that produced a 3.0 Å resolution map. SF segments (orange) were less abundant and could not be resolved to high resolution. g, 2D projection of refined, sharpened tau PHF cryoEM map shown. h, Fourier shell correlation resolution estimation of final map resolution. i, Atomic model in map was indistinguishable from several deposited tau PHF cryoEM models, including the template selected for model building (PDB: 5o3l). See Supplementary Data Table 8.
Extended Data Fig. 2
Extended Data Fig. 2. Immunofluorescence profile and cryoFM targeting of MX04-labelled amyloid pathology of post-mortem AD donor tissue.
a, Related to Fig. 1c. Confocal fluorescence microscopy of AD post-mortem donor brain and non-demented control brain. Images from left to right, amyloid (MX04), Aβ/APP (4G8), phospho-Tau (AT8), and merged. Cyan arrowhead, β-amyloid plaque. Open orange arrowhead, tau thread. Scale bar, 20 μm. b, CryoFM image of high-pressure frozen post-mortem brain biopsy from AD (left) and non-demented control (right) donor. Scale bar, 0.5 mm. Cyan, MX04 fluorescence. Red, autofluorescence detected with excitation and emission of 546 nm and 585 nm, respectively. Yellow rectangle, regions shown as close-ups below (lower left and right, respectively). Lower left and right panels, putative β-amyloid plaque and tau tangles, respectively. Closed cyan arrowhead, putative β-amyloid plaque. Closed orange arrowhead, putative tau tangle. Open orange arrowhead, putative tau thread. Scale bar, 50 μm. c, CryoFM targeting of cryo-ultramicrotomy, related to Fig. 1f. Top to bottom, cryoFM image of planchette containing MX04-labelled high-pressure-frozen tissue, stereomicroscope image of the planchette during trimming with a cryo-ultramicrotome, alignment of cryoFM and stereomicroscope images, and close-up image of trimmed planchette with cryoFM image. White arrowhead, trapezoid stub of tissue targeted for the collection of cryo-sections. Orange arrowhead, MX04-labelled amyloid within tissue stub. d, Left and right, MX04 cryoFM image of tissue cryo-section containing β-amyloid plaque and tau tangles, respectively. White arrowhead, MX04-labelled amyloid pathology. Scale bar, 50 μm. Red and cyan, same as in b.
Extended Data Fig. 3
Extended Data Fig. 3. Cryo-CLEM and cryoET of MX04-labelled post-mortem AD brain.
a, CryoCLEM of MX04-labelled tau inclusion within AD post-mortem brain cryo-section. Top left, aligned cryoFM image (cyan, MX04) with cryoEM image. Red rectangle, area shown in close-up. Scale bar, 5 μm. Bottom left, close-up. Red rectangle, region shown, area shown in close-up. Right, close-up. Orange arrowheads, putative tau filaments. Green arrowhead, putative plasma membrane of neurite. Scale bar, 500 nm. See also cryoET data in Extended Data Fig. 8 and Supplementary Video 6). b, CryoCLEM of AD post-mortem brain cryo-section showing unlabelled amyloid deep in the tissue below the depth of MX04 penetration. Left, MX04 (cyan) cryoFM image aligned with cryoEM image showing MX04 only labels top ~15 μm of 100 μm thick tissue biopsy. Red rectangle, region in cryo-section corresponding to 27 μm deep within the tissue biopsy. Scale bar, 5 μm. Right, close-up of left medium magnification cryoEM image showing region from which cryoET data were collected (see e). Cyan arrowhead, putative Aβ fibrils. Scale bar, 500 nm. c-e, Tomographic slices of β-amyloid plaque pathology in post-mortem AD brain. Filled and open cyan arrowheads, fibril in the x-y plane and axially (z-axis) of the tomogram, respectively. Brown arrowhead, myelinated axon. Dark green arrowhead, subcellular compartment. Blue arrowhead, intracellular membrane bound organelle. Yellow arrowhead, extracellular cuboidal particle. Pink arrowhead, extracellular vesicle. White arrowhead, knife damage. Scale bar, 10 nm. c, β-amyloid plaque pathology. Related to Fig. 1g, see also Supplementary Video 2. d, Same as c but with amyloid pathology adjacent to myelinated axon. e, Same as c, but related to b (also see Supplementary Video 3).
Extended Data Fig. 4
Extended Data Fig. 4. In-tissue cryoET of cryo-sections from non-demented control post-mortem brain donor.
Panels a-h show tomographic slices from 8 out of 64 tomograms in the dataset. No amyloid was observed in non-demented control post-mortem donor cryo-sections (see Supplementary Data Table 3). Green arrowhead, plasma membrane enclosing subcellular compartment. Purple arrowhead, mitochondrion. Brown arrowhead, myelin. Red arrowhead, ribosomes. Orange arrowhead, actin. White arrowhead, knife damage. Criteria for identifying constituents are described in Methods. Scale bar, 10 nm. See Supplementary Videos 7–9.
Extended Data Fig. 5
Extended Data Fig. 5. CryoET comparison of in-tissue MX04-labelled β-amyloid plaque in AppNL-G-F-PMI-FT-HPF and previously published AppNL-G-F-HPF.
Left panels, tomographic slices from an AppNL-G-F mouse brain that underwent a 6 h post-mortem interval and freeze-thaw step (AppNL-G-F-PMI-FT-HPF) before vitrification by high pressure freezing and cryo-section preparation. Right panels, tomographic slices from AppNL-G-F cortex that was immediately vitrified by high pressure freezing, with no post-mortem interval or freeze-thaw step (AppNL-G-F-HPF, from Leistner et al.). Filled and open cyan arrowheads, fibril in the x-y plane and axially (z-axis) of the tomogram, respectively. Dark green arrowhead, plasma membrane enclosing subcellular compartment. Light green arrowhead, burst plasma membrane. Yellow arrowhead, microtubule. Red arrowhead, ribosome. White arrowhead, knife-damage and surface ice contamination. Scale bar, 10 nm.
Extended Data Fig. 6
Extended Data Fig. 6. Tomographic slices showing damaged mitochondria in brain tissues that have undergone post-mortem interval and freeze-thaw step.
a, Post-mortem AD brain with PMI and freeze-thaw step that preceded high pressure freezing (PMI-FT-HPF). b, Post-mortem non-demented control brain (Control human PMI-FT-HPF). c, Mouse model of β-amyloidosis brain (AppNL-G-F) prepared with PMI-FT-HPF. d, Mouse model of β-amyloidosis (AppNL-G-F). Sample prepared without post-mortem interval and freeze-thaw step (AppNL-G-F-HPF) (see Leistner et al. for details). Dark purple arrowhead, outer mitochondrial membrane. Light purple arrowhead, inner mitochondrial membrane. Light purple asterisk, diluted mitochondrial matrix. Dark green arrowhead, sub-cellular membrane compartment. Light green arrowhead, burst membrane. Orange arrowhead, actin filament. Yellow arrowhead, microtubule. Brown arrowhead, myelin sheath. White arrowhead, knife damage or surface ice contamination. Scale bar, 10 nm.
Extended Data Fig. 7
Extended Data Fig. 7. Extracellular cuboidal particles have ordered striations.
a and b, cryoEM images (single tomographic tilt, 2.4 Å pixel size) of an extracellular cuboidal particle in an Aβ plaque (see Extended Data Fig. 3e). Red square, subregion analysed by fast Fourier transform shown in insets with 2.5 nm or 2.8 nm peak, respectively. c, Tomographic slice (9.6 Å voxel size) showing extracellular cuboidal particle. d, Same as b but with no peak in control subregion. Scale bar, 10 nm.
Extended Data Fig. 8
Extended Data Fig. 8. In-tissue cryoET of MX04-labelled tau inclusion cryo-section from AD post-mortem brain donor, amyloid width measurements, and FSC plot (related to Fig. 3h).
a, Tomographic slice through dystrophic neurite. Orange arrowhead, tau filament. Green arrowhead, plasma membrane of neurite. Scale bar, 10 nm. Related to Extended Data Fig. 3a and see Supplementary Video 6. b, Scatterplot showing the width distribution of lipid membrane (used as an internal control for width measurements, n = 296) and fibrils from in-tissue cryo-sections of β-amyloid plaques (n = 1360) and tau tangles (n = 561), respectively. Middle and top/bottom black bars indicate mean and one standard deviation. c, Resolution estimation of subtomogram averaging of tau subvolumes from a single tissue cryo-section by gold-standard Fourier shell correlation (FSC).
Extended Data Fig. 9
Extended Data Fig. 9. Lower-resolution subtomogram averages of tau filament clusters within tissue cryo-sections situated in six distinct locations.
a-b, Subtomogram averaged tau clusters composed of PHFs. (i) Surface rendering of subtomogram averaging of tau filaments (stalkInit, see Methods). (ii) Helical averaging of tau filament subvolumes from one AD cryo-section tomogram. Left, slice (2.38 Å thick) through averaged subvolume. Scale bar, 5 nm. Middle and right, subtomogram average shown without and with ex vivo purified tau PHF atomic model (yellow, PDB 5o3l) fitted in map with EM placement (LLG > 60),, respectively. Each protofilament in the PHF shown as yellow Cα trace. (iii) Graph showing resolution estimation of subtomogram averaging of tau subvolumes from a single tissue cryo-section by gold-standard Fourier shell correlation (FSC). See Supplementary Data Table 5 for EM placement, LLG and CC of PHF and SF. c-f, Same as a-b but for subtomogram averaged tau clusters in which the tau filament ultrastructural polymorph was not resolved (EM placement LLG < 60),.
Extended Data Fig. 10
Extended Data Fig. 10. Subtomogram averaging of Aβ fibrils from MX04-labelled β-amyloid plaque cryo-sections.
Pairs of panels showing, top and side view of fibril. Left, slice (9.52 Å thick) through averaged subvolume. Right, surface rendering of subtomogram average (stalkInit, see Methods). Scale bar, 5 nm. a, Subtomogram averaging of 100 fibrils (of all widths) from one tomogram. b, Subtomogram averaging of 20 protofilament-like rods (3–5 nm diameter) from one tomogram. c, Subtomogram averaging of 42 fibrils (4–9 nm diameter) from one tomogram. d, Subtomogram averaging of 42 thick fibrils (6–12 nm diameter) from a different tomogram.
Extended Data Fig. 11
Extended Data Fig. 11. Correlated cryo-FM-FIB-SEM lift-out targeting of MX04-labelled tau pathology in high-pressure frozen post-mortem AD brain.
a, CryoFM of MX04-labelled amyloid pathology targeted for cryoFIB-SEM lift-out showing in top left, top right, and lower left, reflection, MXO4 fluorescence and merged overview, respectively. Scale bar, 200 μm. Yellow rectangle in top right, closeup in bottom right. Scale bar, 20 μm. b-c, Alignment of cryoFM, FIB and SEM images to target lift-out in ZEN Connect. Images on left were aligned with middle image using fiducials indicated by open arrowheads. b, Alignment between cryoSEM normal overview and cryoSEM normal high-magnification image of MX04-labelled lift-out target. Scale bar, 200 μm. c, Alignment between cryoSEM normal high-magnification and cryoFIB normal image. Scale bar, 200 μm. Left and right, scale bar, 200 μm. Middle, scale bar, 100 μm. d, Alignment between cryoFIB normal image and cryoFIB high-magnification after cryoFIB milling trench. Left and right, scale bar, 100 μm. Middle, scale bar, 20 μm. e, Alignment between cryoFIB images before and after surface cleaning, sputter coating and cold deposition of platinum precursor. Scale bar, 20 μm. f, Alignment of cryoFIB images before and after trenches were milled in front, behind and to the right side to prepare tissue chunk for targeted lift-out. Scale bar, 20 μm. g, Images showing the result of alignments (from a to h) to target MX04-labelled tau for cryoFIB-SEM lift-out. Left, cryoFIB image of tissue chunk prepared for lift-out. Middle, confocal cryoFM of MX04-labelled amyloid plaque and tau tangles. Brown and yellow rectangles, left and right regions of serial chunk lift-out, respectively. Cyan line, location of lamella. Scale bar, 20 μm. h-l, CryoFIB-SEM lift-out of MX04-labelled post-mortem AD brain. Lines and rectangles tracing the tissue chunk during cryoFIB cuts and thinning were used for cryoCLEM. Red semi-transparent line, length of tissue chunk before lift-out. Green semi-transparent line, length of tissue chunk during lift-out. Brown rectangle, left tissue chunk. Yellow rectangle, right tissue chunk (lost during sample transfer from cryoFIB-SEM to cryoEM). Cyan line, region targeted for cryoFIB milling lamellae within tissue chunk. h, CryoFIB image of tissue chunk after final left side cut to detach tissue chunk. Magenta closed arrowhead, tissue chunk. Blue closed arrowhead, lift-out tool (copper block linking micromanipulator needle) attached to right side of tissue chunk. Scale bar, 10 μm. i, CryoSEM images showing attachment of the left tissue chunk to EM grid and cryoFIB cut between the left and right tissue chunks. Purple closed arrowhead, EM grid. Brown closed arrowhead, left tissue chunk. Yellow closed arrowhead, right tissue chunk. Blue closed arrowhead, lift-out tool. Scale bar, 10 μm. j, CryoFIB normal view image (56° stage tilt) of the tissue chunk after cryoFIB thinning to produce two 130–200 nm thick, ~8 μm wide, ~15 μm deep lamellae windows. Cyan closed arrowhead, lamella. Brown closed arrowhead, tissue chunk. Scale bar, 10 μm. k, CryoSEM showing serial attachment of the left and right tissue chunks. Yellow and brown closed arrowheads, left and right tissue chunks, respectively. Scale bar, 50 μm. Inset, overview image showing clipped half-moon Omniprobe EM grid. Scale bar, 0.5 mm. l, CryoEM overview showing left and right cryoFIB-milled tissue chunk attachment positions, left was lost and right remained during transfer cryoFIB to Krios TEM, respectively. Arrowheads, same as k. Scale bar, 50 μm.
Extended Data Fig. 12
Extended Data Fig. 12. Related to Fig. 4h–j and spatially restricted variation in helical twist and polarity orientation of in-tissue tau filament clusters.
a, Left and right, resolution estimation of subtomogram averaging of 52 PHF and 19 SF in a single tissue cryoFIB-SEM lift-out lamella tomogram by gold-standard Fourier shell correlation (FSC), respectively. b, Resolution estimation of subtomogram averaging of 64 tau SF in a single tissue cryoFIB-SEM lift-out lamella tomogram by Fourier shell correlation (FSC). c, Filament helical twist (left y-axis) and cross-over distance (right y-axis) of in-tissue tau filament clusters in different locations of AD post-mortem brain from seven cryo-section (CS1-7) and two lift-out lamella tomograms, one of which (LOL1) was composed of two ultrastructural polymorphs, related to maps shown in Fig. 3g, Fig. 4g & i and Extended Data Fig. 9a–f. Orange and cyan data points, tau cluster subtomogram averages that fitted the atomic models of PHF or SF using EM placement (see Supplementary Data Table 5), respectively. Yellow data points, tau cluster subtomogram averages in which the ultrastructural polymorph was unresolved. For reference, the helical twist/crossover distances calculated for AD PHF and SF are shown in grey (data point and whiskers, cryoEM and range of twists observed by negative stain EM from Fitzpatrick et al., respectively). See also Supplementary Data Table 5. d, Filament subtomogram average map (see Fig. 3h) mapped back into the raw tomographic volume with PHF filaments coloured by polarity orientation. Orange and indigo filaments with upwards and downwards polarity orientation, respectively. Top and bottom, volume viewed from top and rotated ~45°, with and without tomographic slice, respectively. Scale bar, 10 nm. e, Same as b, but related to Fig. 4h. Cyan and purple, SF filaments with upwards and downwards polarity orientation, respectively. f, Same as b and c, but related to Fig. 4j.
Extended Data Fig. 13
Extended Data Fig. 13. CryoEM atomic model versus subtomogram map Fourier shell correlation.
a, For reference, Fourier shell correlation of previously reported single-particle cryoEM structure of ex vivo sarkosyl-extracted PHF (PDB: 5o3l) and map (EMDB-3741). b, Fourier shell correlation of PHF (PDB 5o3l) and cryoEM map of ex vivo sarkosyl-extracted PHF from donor (Extended Data Fig. 1i). c-l, Fourier shell correlation of PHF (PDB 5o3l) or SF (PDB 5o3t) atomic model versus subtomogram average maps corresponding to Fig. 3h PHF, Fig. 4h PHF, Fig. 4h SF, Fig. 4j SF and Extended Data Fig. 9a–f, respectively. Resolution estimates based on Fourier shell correlation of half-maps annotated in parenthesis. See also Supplementary Data Table 5.

References

    1. Scheres, S. H. W., Ryskeldi-Falcon, B. & Goedert, M. Molecular pathology of neurodegenerative diseases by cryo-EM of amyloids. Nature621, 701–710 (2023). 10.1038/s41586-023-06437-2 - DOI - PubMed
    1. Serrano-Pozo, A., Frosch, M. P., Masliah, E. & Hyman, B. T. Neuropathological alterations in Alzheimer disease. Cold Spring Harb. Perspect. Med.1, a006189 (2011). 10.1101/cshperspect.a006189 - DOI - PMC - PubMed
    1. Hardy, J. A. & Higgins, G. A. Alzheimer’s disease: the amyloid cascade hypothesis. Science256, 184–185 (1992). 10.1126/science.1566067 - DOI - PubMed
    1. Haass, C., Kaether, C., Thinakaran, G. & Sisodia, S. Trafficking and proteolytic processing of APP. Cold Spring Harb. Perspect. Med.2, a006270 (2012). 10.1101/cshperspect.a006270 - DOI - PMC - PubMed
    1. Iwatsubo, T. et al. Visualization of Aβ42(43) and Aβ40 in senile plaques with end-specific Aβ monoclonals: evidence that an initially deposited species is Aβ42(43). Neuron13, 45–53 (1994). 10.1016/0896-6273(94)90458-8 - DOI - PubMed

MeSH terms