. 2024 Aug;632(8025):603-613.
doi: 10.1038/s41586-024-07493-y. Epub 2024 Jul 10.

Single-cell atlas of the human brain vasculature across development, adulthood and disease

Affiliations

Single-cell atlas of the human brain vasculature across development, adulthood and disease

Thomas Wälchli et al. Nature. 2024 Aug.

Abstract

A broad range of brain pathologies critically relies on the vasculature, and cerebrovascular disease is a leading cause of death worldwide. However, the cellular and molecular architecture of the human brain vasculature remains incompletely understood1. Here we performed single-cell RNA sequencing analysis of 606,380 freshly isolated endothelial cells, perivascular cells and other tissue-derived cells from 117 samples, from 68 human fetuses and adult patients to construct a molecular atlas of the developing fetal, adult control and diseased human brain vasculature. We identify extensive molecular heterogeneity of the vasculature of healthy fetal and adult human brains and across five vascular-dependent central nervous system (CNS) pathologies, including brain tumours and brain vascular malformations. We identify alteration of arteriovenous differentiation and reactivated fetal as well as conserved dysregulated genes and pathways in the diseased vasculature. Pathological endothelial cells display a loss of CNS-specific properties and reveal an upregulation of MHC class II molecules, indicating atypical features of CNS endothelial cells. Cell-cell interaction analyses predict substantial endothelial-to-perivascular cell ligand-receptor cross-talk, including immune-related and angiogenic pathways, thereby revealing a central role for the endothelium within brain neurovascular unit signalling networks. Our single-cell brain atlas provides insights into the molecular architecture and heterogeneity of the developing, adult/control and diseased human brain vasculature and serves as a powerful reference for future studies.


Conflict of interest statement

The authors declare no competing interests.

Figures

Fig. 1
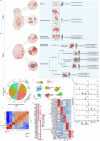
Fig. 1. Construction of a molecular sc-atlas of the human brain vasculature and reactivation of fetal programmes in pathological brain vascular ECs.
a, Schematic of the experimental workflow including scRNA-seq, computational analysis summary and validation experiments. b, Expression heat map of the top ranking marker genes in the indicated tissues. For the colour scale, red shows high expression, white shows intermediate expression and blue shows low expression. cf, Dotplot heatmap of the fetal versus adult/control brain endothelium (c); pathological (path.) versus adult/control brain endothelium (d); brain vascular malformations (brain vasc. mal.) versus adult/control brain endothelium (e); and brain tumours versus adult/control brain endothelium (f) signatures based on differential gene expression analyses. gn, IF imaging of tissue sections from the indicated entities, stained for PLVAP (red; gj), ESM1 (red; kn) and CD31 (green). Nuclei are stained with DAPI (blue). The arrowheads indicate expression of PLVAP or ESM1 in blood-vessel ECs in the different tissues, and the arrows indicate the absence of expression in blood-vessel ECs in the different tissues. For gn, scale bars, 50 μm. o, The overlap between the 2,313 significant pathways enriched in fetal brain ECs as compared to adult/control brain ECs and the 1,409 significant gene sets enriched in pathological brain ECs as compared to adult/control brain ECs. ECM, extracellular matrix; NVL, neurovascular link; periph., periphery; RPCA, reciprocal principal component analysis; UMAP, uniform manifold approximation and projection.
Fig. 2
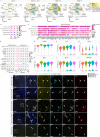
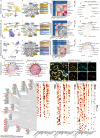
Fig. 2. Inter-tissue heterogeneity and AV zonation of brain vascular ECs.
a, UMAP plot of the 243,521 integrated/batch corrected fetal, adult/control and pathological brain ECs across 5 (fetal), 9 (adult/control) and 29 (pathological) individuals (Supplementary Table 3), colour coded by EC AV specification, and UMAP plots split by tissue of origin: fetal brain (5 individuals), adult/control brain (9 individuals) and brain pathologies (29 individuals). bd, The relative abundance of EC subtypes (AV specification cluster) from the indicated tissue of origin. bd are coloured according to the colour code in a (Supplementary Table 10). The number of individuals analysed was as follows: n = 43 (all entities), n = 5 (fetal brain), n = 9 (adult/control brain (TL)), n = 29 (all pathological brains), n = 5 (brain vascular malformations), n = 24 (brain tumours), n = 5 (AVM), n = 6 (LGG), n = 8 (GBM), n = 5 (MET) and n = 5 (MEN). e, The top ranking marker gene expression levels in different EC subtypes. For the colour scale, red shows high expression, white shows intermediate expression and blue shows low expression. Angio., angiogenic; prolif., proliferating. f, The overlap between human and mouse AV specification markers (of large artery, artery, arteriole, capillary, venule and large vein) and endothelial (EC) markers (top). Bottom, the percentage of common, human-specific and mouse-specific cell/AV specification markers. Astro, astrocytes; micro/macro, microglia/macrophages; neuro, neurons; PC, pericytes. g, Scatter plot showing the differential incoming and outgoing interaction strength of pathways in angiogenic capillaries, identifying signalling changes in those cells in pathological as compared to the control conditions. h, The number of statistically significant ligand–receptor interactions between EC subtypes in fetal versus adult/control brains (left) and pathological (path.) versus adult/control brains (right). The circle plots show a differential analysis of the intercellular signalling interactions; red indicates upregulation and blue indicates downregulation. i,j,k, The overall signalling patterns of different EC subtypes in fetal (i), adult/control (j) and pathological (k) brains. Grey bars indicate signalling strength.
Fig. 3
Fig. 3. Alteration of AV specification in pathological brain vascular ECs.
a,e,i, UMAP plots of human brain ECs isolated from fetal brains (21,512 ECs from 5 individuals; a), adult/control brains (76,125 ECs from 9 individuals; e) and pathological brains (145,884 ECs from 29 individuals; i), coloured by AV specification. RNA velocity streamlines and partition-based graph abstraction (PAGA) vectors extended by velocity-inferred directionality are superimposed onto the UMAPs. b,f,j, UMAP plots of human brain ECs isolated from fetal brains (b), adult/control brains (f) and pathological brains (j), coloured by pseudotime. The red line, which was drawn manually, indicates the major trajectory flow. c,g,k, Pseudotime order of ECs, colour coded according to AV specification from fetal brains (c), control adult/control brains (g) and pathological brains (k). d,h,l, Heat map of adult/control brain EC AV specification signature gene expression in human brain ECs isolated from fetal brains (d), adult/control brains (h) and pathological brains (l). A, arterial; C, capillary; V, venous. m,n,o, Common and tissue-specific markers in ECs from large arteries (m), capillaries (n) and large veins (o) in different tissue types (fetal brain, adult/control brain, brain vascular malformations and brain tumours). The red boxes highlight conserved markers between ECs from different tissues; the blue boxes highlight tissue-specific markers. Dots are coloured as defined in the legend. p, Three-dimensional principal component analysis visualization of pairwise Jaccard similarity coefficients between the indicated ECs from the different tissues.
Fig. 4
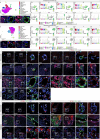
Fig. 4. Alteration of CNS specificity in pathological brain vascular ECs.
ac, UMAP plots of the ECs from fetal brains (21,512 ECs from 5 individuals; a), adult/control brains (76,125 ECs from 9 individuals; b) and pathological brains (145,884 ECs from 29 individuals; c). Plots are colour coded for CNS signature (green) and peripheral signature (yellow). d, CNS signature genes expression in fetal brain, adult/control brains (temporal lobes) and pathological brain ECs. e,f, CNS and peripheral signature expression in fetal brain, adult/control brain and pathological brain ECs (e) and in each individual entity (f). g, The CNS signature at the level of AV specification for the indicated entities. For the colour scale, red shows high expression and blue shows low expression. The dot size represents the percentage expression within the indicated entity. h, The expression of representative CNS-specific and BBB marker genes for fetal brain versus adult/control brain versus pathological brain ECs. it, IF images for the protein expression of BSG (in) and CD320 (ot) in fetal brain (i and o), adult/control brain (TL; j and p), brain AVMs (k and q), GBM/high-grade glioma (l and r), metastasis (m and s) and meningioma (n and t). For it, scale bars, 80 μm (fetal brain) and 50 μm (adult control and pathological brains). ux, IMC imaging of fetal brain (u), adult/control brain (TL; v), GBM/high-grade glioma (w) and metastasis (x) tissue samples visualizing five metal-conjugated antibodies (Supplementary Table 24). Representative pseudocolour images of CLDN5, GLUT1, BSG and CD31 combined, and individual GLUT1 and BSG channels are shown; white, overlap; yellow, CLDN5; cyan, GLUT1; grey, BSG; red, CD31; blue, DNA intercalator. For ux, scale bars, 50 μm. The arrowheads indicate blood-vessel ECs expressing the indicated markers in the different tissues. The arrows indicate blood-vessel ECs not expressing the indicated markers in the different tissue.
Fig. 5
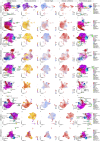
Fig. 5. Upregulation of MHC class II receptors in pathological brain vascular ECs.
ac, UMAP plots of ECs from fetal (21,512 ECs from 5 individuals; a), adult/control (76,125 ECs from 9 individuals; b) and pathological brains (145,884 ECs from 29 individuals;c). Plots are colour coded for MHC class II (violet) and CNS (green) signatures. d, MHC class II signature gene expression in fetal, adult/control (temporal lobes) and pathological brain ECs. e,f, MHC class II, CNS and peripheral signature expression in fetal, adult/control and pathological brain ECs (e), and MHC class II signature expression in each individual entity (f). g, The MHC class II signature at the level of AV specification for the indicated entities. For the colour scale, red shows high expression and blue shows low expression. The dot size represents the percentage expression within the indicated entity. hs, IF images for the protein expression of CD74 and HLA-DRB5 in the fetal brain (h and n) and the adult/control brain (TL; i and o), in brain AVMs (j and p), in GBM/high-grade glioma (k and q), in metastasis (l and r) and in meningioma (m and s). For hs, scale bars, 80 μm (fetal brain) and 50 μm (adult control and pathological brains). tw, IMC imaging of fetal brain (t), adult/control brain (u), meningioma (v) and metastasis (w) tissue samples visualizing metal-conjugated CD74, pan-HLA-DR, oligo-HLA-D and CD31 primary antibodies. An overlay of pseudocolour images as well as individual channels for CD74 and pan-HLA-DR are shown; white, overlap; orange, CD74; cyan, pan-HLA-DR; green, oligo-HLA-D; red, CD31; blue, DNA intercalator. For tw, scale bars, 50 μm. x,y, The strength of MHC class II signalling interactions between the different EC subtypes of the adult/control brain (x) and pathological brain (y) ECs at the AV specification level. z, Differential analysis of MHC class II ligand–receptor pairs. Chord/circos plots showing upregulated MHC class II signalling in angiogenic capillaries as the source and all other cell clusters as targets (left), and large veins as receivers (right). The edge thickness represents its weight. The edge colour indicates the sender cell type. The arrowheads indicate ECs expressing the indicated markers. The arrows indicate ECs not expressing the indicated markers.
Extended Data Fig. 1
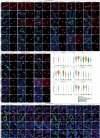
Extended Data Fig. 1. Construction of a molecular single-cell atlas of the human brain vasculature across development, adulthood and disease and of the fetal peripheral vasculature - studied entities and inter-tissue heterogeneity.
Figure shows studied entities and inter-tissue heterogeneity of sorted vascular endothelial cells. a,b, Scheme of the different tissue types present in the study with respective sample/patient numbers of fetal (a) and adult (b) origins. c, Piechart showing relative abundance and percentage of ECs from each tissue collected. d, Composite UMAP plots of sorted and in silico-quality checked (ECs, coloured by tissue of origin. e, Violin plots of the expression of the top marker genes of each tissue type, percentage of cells expressing the marker gene is indicated on the right. f, Endothelial cells transcriptome correlation heatmap and hierarchical clustering of all tissues analysed. g, Dotplot heatmap of the fetal brain vs fetal periphery endothelial signature. h, Expression heatmap of top ranking marker genes in the indicated tissues. Colour scale: red, high expression; white, intermediate expression; blue, low expression.
Extended Data Fig. 2
Extended Data Fig. 2. Validation of angiogenic and EndoMT markers in vascular ECs of the fetal, adult and pathological brain vasculature using RNAscope, IF and IMC.
a-g, Volcano plots showing the differential expression analysis comparing endothelial cells from adult/control brains (left) and the indicated entity (right) (Wald test, Benjamini Hochberg correction; P-value < 0.05 and log2FC ≥ 0.25 coloured significant in red, PLVAP dot is coloured blue). Number of individuals analysed is as follows: Fetal brain=5, Adult/control brain (TL) = 9, AV malformations=5, AVM = 5, LGG = 6, GBM = 8, MET = 5, MEN = 5. h, Expression heatmap of the top 25 differentially expressed genes in adult/control ECs (TL) vs. pathological brain ECs (PATH). i-di, Immunofluorescence (IF) and RNAscope imaging of tissue sections from the indicated entities, stained for PLVAP (red), (RNAscope: i-t; IF: u-di) and CD31 (green). Nuclei are stained with DAPI (blue). Arrowheads indicate ECs expressing PLVAP and dotted lines (RNAscope) delineate vascular structures in the different tissues. Scale bars: 50 μm in overviews (RNAscope); 50 μm in (IF) and 12.5 μm in zooms (RNAscope). ai-di, IF of fetal brain tissue sections from the indicated gestational ages, stained for PLVAP (red) and CD31 (green). Nuclei are stained with DAPI (blue). Arrowheads indicate ECs expressing PLVAP. Arrows indicate absence of expression in ECs. Scale bars: 20 μm. ei-bii, RNAscope imaging of tissue sections from the indicated entities, stained for ESM1 (red; ei-pi), ACTA2 (red; qi-bii) and CD31 (green). Nuclei are stained with DAPI (blue). Boxed area is magnified on the right; arrowheads indicate ECs expressing ESM1 or ACTA2 and dotted lines delineate vascular structures in the different tissues. Scale bars: 50 μm in overviews and 12.5 μm in zooms. cii-jii, IF of tissue sections from the indicated entities, stained for ESM1 (red; cii-fii), ACTA2 (red; gii-jii) and CD31 (green). Nuclei are stained with DAPI (blue). Boxed area is magnified on the right; arrowheads indicate ECs expressing ESM1 or ACTA2. Arrows indicate absence of expression in ECs. Scale bars: 80 μm in overviews and 20 μm in zooms. kii-q‘4, Mass cytometry (IMC) imaging of the indicated fetal, adult/control and pathological brain tissue samples visualizing metal-conjugated ACTA2, PDGFRB, CD31 and CLDN5 primary antibodies out of all 39 stained panel (Supplementary Table 24). Overlay of pseudocolor images as well as individual channels of the different markers (white, overlap; cyan, ACTA2; green, PDGFRB; red, CD31; yellow, CLDN5; blue, DNA intercalator), Scale bars: 250 μm in overviews, 50 μm in zooms. Arrowheads identify blood vessels ECs expressing the indicated markers in the different tissues. Arrows identify blood vessel ECs not expressing the indicated markers in the different tissues. rii-tii, Violin plots showing the expression of PLVAP (rii), ESM1 (sii) and ACTA2 (tii) in the indicated fetal brain (CNS), adult/control and pathological brain tissues.
Extended Data Fig. 3
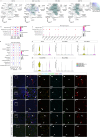
Extended Data Fig. 3. Validation of stem-to-endothelial transdifferentiation in vascular ECs of glioblastoma and of lung cancer brain metastasis using IF.
a,n, UMAP plot of glioblastoma (49,999 ECs from 8 individuals) (GBM) and lung cancer brain metastasis (23,962 ECs from 5 individuals) (MET) endothelial cells, coloured by AV specification. b-i, o-v, Violin plots showing the expression of the indicated endothelial- and stem cell specific markers in the different EC subtypes (AV clusters). j-m, ai-zi, Immunofluorescence staining of SOX2 (j,k, ai-hi), PTPRZ1 (l,m, ii-ni), EPCAM (w,x, oi-ti), SFTPB (y,z, ui-zi) (red) and CD31 (green) in the indicated tissue samples. Arrowheads identify blood vessels ECs expressing the indicated markers in the different tissues. Arrows identify blood vessel ECs not expressing the indicated markers in the different tissues. Boxed area is magnified on the right. Scale bars: 80 µm in overviews except for ci-ci,ki-ki, qi-qi, wi-wi (200 µm), 20 µm in zooms except for di-di, li-li, ri-ri, xi-xi (50 µm).
Extended Data Fig. 4
Extended Data Fig. 4. Alteration of AV-specification in pathological brain vascular ECs.
UMAP plots of human brain ECs isolated from the brain arteriovenous malformations (20,305 ECs from 5 individuals) (a,b), all brain tumours (125,579 ECs from 24 individuals) (e,f), lower-grade glioma (17,373 ECs from 6 individuals) (i,j) glioblastoma (49,999 ECs from 8 individuals) (m,n), brain metastasis (23,962 ECs from 5 individuals) (q,r), and meningioma (34,245 ECs from 5 individuals) (u,v) coloured by AV specification (a,e,i,m,q,u) and by pseudotime (b,f,j,n,r,v), the red line drawn manually indicates the major trajectory flow. c,g,k,o,s,w, Pseudotime order of ECs colour-coded according to AV specification from all theindicated entities. d,h,l,p,t,x, Heatmap of adult/control brain ECs AV specification signature gene expression in human brain ECs isolated from the indicated entities. y-ziv, Sankey plot showing the predicted annotation of the ECs of the indicated entities as mapped to adult/control brain (TL) ECs. Unassigned cells are indicated in grey. zv, Sankey plot of pathological brain ECs, showing the predicted annotation (right nodes) – as mapped to adult/control brain (TL) ECs – of the AV clusters assigned based on top cluster marker analysis (left nodes). Unassigned cells are indicated in grey. zvii, Sankey plot of fetal brain ECs, showing the predicted annotation (right nodes) – as mapped to adult/control brain (TL) ECs – of the AV clusters assigned based on top cluster marker analysis (left nodes). Unassigned cells are indicated in grey. zvi,zviii, Barplots showing the composition of unassigned cells – based on mapping to adult/control brain (TL) ECs – in pathological brain ECs (zv) and fetal brain ECs (zvii).
Extended Data Fig. 5
Extended Data Fig. 5. Trajectory analysis of fetal, adult and pathological human brain vascular ECs via RNA velocity along the AV-zonation/specification axis.
a,f,k,p,u,z,a‘,f‘,k‘, UMAP plots of human brain ECs isolated from the indicated entities (fetal brains (21,512 ECs from 5 individuals) (a), adult/control brains (76,125 ECs from 9 individuals) (f), pathological brains (145,884 ECs from 29 individuals) (k), brain arteriovenous malformations (20,305 ECs from 5 individuals) (p), all brain tumours (125,579 ECs from 24 individuals) (u), lower-grade glioma (17,373 ECs from 6 individuals) (z) glioblastoma (49,999 ECs from 8 individuals) (a‘), brain metastasis (23,962 ECs from 5 individuals) (f‘), and meningioma (34,245 ECs from 5 individuals) (k‘)) coloured by AV specification, onto the UMAPs are superimposed RNA velocity streamlines extended by velocity-inferred directionality. b,g,l,q,v,zi,b‘,g‘,l‘, UMAP plots of the indicated entities, coloured by RNA velocity pseudotime. c,h,m,r,w,zii,c‘,h‘,m‘, UMAP plots of the indicated entities, coloured by RNA velocity length. d,i,n,s,x,ziii,d‘,i‘,n‘, UMAP plots of the indicated entities, coloured by RNA velocity confidence. e,j,o,t,y,ziv,e‘,j‘,o‘, UMAP plots of the indicated entities, coloured by AV specification, onto the UMAPs are superimposed RNA velocity PAGA vectors extended by velocity-inferred directionality.
Extended Data Fig. 6
Extended Data Fig. 6. Establishment of CNS, peripheral and BBB signatures in vascular ECs from the developing fetal to the adult brain vasculature.
a, UMAP plots of the ECs from fetal brains in ascending fetal age ranging from gestational week 9 (444 ECs), gestational week 14.4 and 16.4 (3762 ECs), gestational week 15.5 (18,314 ECs) to gestational week 18 (3601 ECs); plots are colour-coded for fetal CNS signature (green) and fetal peripheral signature (yellow). b, Dotplot heatmap of fetal CNS, fetal peripheral, and BBB signatures’ expression in fetal brains of indicated fetal age and adult/control brains (temporal lobes). c, Dotplot heatmap of fetal CNS signature genes’ expression in fetal brains of indicated fetal age and adult/control brains (temporal lobes). d, Dotplot heatmaps of fetal CNS and BBB signatures expression at the level of AV specification for the indicated entities. Colour scale: red, high expression; blue, low expression, whereas the dot size represents the percentage expression within the indicated entity. e-j, Violin plots showing the expression of selected CNS specific and BBB marker genes in fetal brains of indicated fetal age and adult/control brains (TL). Markers shown were further validated by IF and/or IMC. k-t’4 Mass cytometry (IMC) imaging of fetal brains of fetal age GW9 (k-l’4), GW14 (m-n’4), GW18 (o-p’4), GW21 (q-r’4) and adult/control brains (temporal lobe) (s-t’4) tissue samples using metal-conjugated antibodies. Representative pseudocolor images of combined and individual channels of the different markers (white, overlap; yellow, CLDN5; cyan, GLUT1; grey, BSG; red, CD31; blue, DNA intercalator), Scale bars: 250 μm in overviews, 50 μm in zooms. Shown are 5 antibodies stained for (Supplementary Table 24). Arrowheads identify blood vessels ECs expressing the indicated markers in the different tissues. Arrows identify blood vessel ECs not expressing the indicated markers in the different tissues.
Extended Data Fig. 7
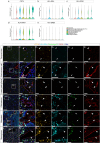
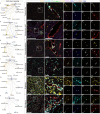
Extended Data Fig. 7. Validation of CNS signature markers in vascular ECs of the developing fetal, adult and pathological brain vasculature using IF.
a-zii, Immunofluorescence (IF) imaging of tissue sections from the indicated entities, stained for SPOCK3 (red; a-f‘), BSG (red; g-l‘, cii-fii), CD320 (red; m-r‘, gii-jii), GPCPD1 (red; s-x‘), PPP1R141 (red; y-di), SLC38A5 (red; ei-ji, kii-nii), GLUT1 (red; ki‘-pi, oii-rii), OCLN (red; qi‘-vi, sii-vii), ZO-1 (red; wi-bii, wii-zii) and CD31 (green). Nuclei are stained with DAPI (blue). Arrowheads identify blood vessel ECs expressing the indicated markers in the different tissues. Arrows identify blood vessel ECs not expressing the indicated markers in the different tissues. Scale bars: 200 μm in overviews, 50 μm in zooms. aiii-fiii, Violin plots showing the expression of CNS-specific genes in the indicated adult control and pathological brain tissues.
Extended Data Fig. 8
Extended Data Fig. 8. Validation of CNS signature markers in vascular ECs of the developing fetal, adult and pathological brain vasculature using IMC.
a-f, Violin plots showing the expression of CNS-specific and BBB marker genes in the indicated adult control and pathological brain tissues. Markers were further validated by IF and/or IMC. g-r‘4 Mass cytometry (IMC) imaging of the indicated adult control and pathological brain tissue samples using metal-conjugated antibodies. Representative pseudocolour images of combined and individual channels of the different markers (white, overlap; yellow, CLDN5; cyan, GLUT1; grey, BSG; red, CD31; blue, DNA intercalator), Scale bars: 250 μm in overviews, 50 μm in zooms. Shown are 5 antibodies stained for (Supplementary Table 24). Arrowheads identify blood vessels ECs expressing the indicated markers in the different tissues. Arrows identify blood vessel ECs not expressing the indicated markers in the different tissues.
Extended Data Fig. 9
Extended Data Fig. 9. Establishment of MHC class II and CNS signatures in vascular ECs from the developing fetal to the adult brain vasculature.
a, UMAP plots of the ECs from fetal brains in ascending fetal age ranging from gestational week 9 (444 ECs), gestational week 14.4 and 16.4 (3762 ECs), gestational week 15.5 (18,314 ECs) to gestational week 18 (3601 ECs); plots are colour-coded for fetal CNS signature (green) and MHC class II signature (blue). b, Dotplot heatmap of MHC class II, fetal CNS and peripheral signatures expression in fetal brains of indicated fetal age and adult/control brains (temporal lobes). c, Dotplot heatmap of MHC class II signature genes’ expression in fetal brains of indicated fetal age and adult/control brains (temporal lobes). d, Dotplot heatmaps of MHC class II signature expression at the level of AV specification for the indicated entities. Colour scale: red, high expression; blue, low expression, whereas the dot size represents the percentage expression within the indicated entity. e-i, Violin plots showing the expression of MHC class II marker genes in fetal brains of indicated fetal age and adult/control brains. Markers shown were further validated by IF and/or IMC. j-s’4 Mass cytometry (IMC) imaging of fetal brains of fetal age GW9 (j-k’4), GW14 (l-m’4), GW18 (n-o’4), GW21 (p-q’4) and adult/control brain (r-s’4) tissue samples using metal-conjugated primary and secondary antibodies. Representative pseudocolour images of combined and individual channels of the different markers (white, overlap; orange, CD74; cyan, pan-HLA-DR; green, oligo-HLA-D; red, CD31; blue, DNA intercalator), Scale bars: 250 μm in overviews, 50 μm in zooms. Shown are 5 antibodies stained for (Supplementary Table 24). Arrowheads identify blood vessels ECs expressing the indicated markers in the different tissues. Arrows identify blood vessel ECs not expressing the indicated markers in the different tissues.
Extended Data Fig. 10
Extended Data Fig. 10. Validation of MHC class II signature markers in vascular ECs of the developing fetal brain and periphery vasculature, and of the adult and pathological brain vasculature using RNAscope and IF.
Immunofluorescence (IF) and RNAscope imaging of tissue sections from the indicated entities, stained for HLA-DPA1 (red; a-j‘, IF; oi-tii, RNAscope), HLA-DRA (red; k-t‘, IF), CD74 (red; u-di, IF; ui-zii, RNAscope), HLA-DRB5 (red; ei-ni, IF) and CD31 (green). Nuclei are stained with DAPI (blue). Arrowheads identify blood vessel ECs expressing the indicated markers, arrows identify blood vessel ECs not expressing the indicated markers in the different tissues and dotted lines (RNAscope) indicate vascular structures in the different tissues. Scale bars: 50 μm in (IF), 50 μm in overviews (RNAscope) and 12.5 μm in zooms (RNAscope).
Extended Data Fig. 11
Extended Data Fig. 11. Validation of MHC class II signature markers in vascular ECs of the adult and pathological brain vasculature using IMC.
a-e, Violin plots showing the expression of MHC class II marker genes in the indicated fetal brain (CNS), adult/control and pathological brain tissues. Markers shown were further validated by IF and/or IMC. f-q‘4 Mass cytometry (IMC) imaging of the indicated adult control and pathological brain tissue samples using metal-conjugated primary and secondary antibodies. Representative pseudocolor images of combined and individual channels of the different markers (white, overlap; orange, CD74; cyan, pan-HLA-DR; green, oligo-HLA-D; yellow, red, CD31), Scale bars: 250 μm in overviews, 50 μm in zooms. Shown are 5 antibodies stained for (Supplementary Table 24). Arrowheads identify blood vessels ECs in close contact with immune cell expressing the indicated markers in the different tissues. Arrows identify blood vessel ECs not in close contact with immune cell expressing the indicated markers.
Extended Data Fig. 12
Extended Data Fig. 12. A key role for vascular ECs in the human brain neurovascular unit across development, adulthood and disease, highlighting MHC class II mediated interactions.
a,d,g, UMAP plots of endothelial and perivascular cells derived from fetal brains (40,557 cells from 7 individuals) (a), adult/control brains (80,515 cells from 6 individuals) (d) and pathological brains (Arteriovenous malformations: 12,013 cells from 3 individuals; Lower-grade glioma: 20,712 cells from 4 individuals; Glioblastoma: 22,297 cells from 5 individuals; Metastasis: 9,204 cells from 3 individuals; Meningioma: 26,916 cells from 3 individuals) (g). b,e,h, Ligand and receptor analysis of fetal brain (b), adult control brain (e), and brain pathology (h) cells using CellphoneDB. Line thickness indicates the number of interactions between cell types. Tables summarize the number of interactions for each cell type. c,f,i, Heatmaps showing the number of ligand-receptor interactions between the different cells of fetal brains (c), adult/control brains (f), and pathological brains (i) computed using CellphoneDB. j,k, Circle plot showing differential analysis of strength of ligand receptor interactions in fetal over adult/control brains (j) and pathology over adult/control brains (k), red indicating upregulation, while blue indicating downregulation. l-n, Heatmap showing overall signalling patterns of different cell types in adult control (o) and pathological (p) brains. o,p,q, Circle plots showing the strength of MHC class II signalling interactions between the different cell types of fetal brain (o), adult/control brain (p), and pathological brain (q). r-r’6 Mass cytometry (IMC) imaging of metastasis tissue sample visualizing metal-conjugated CD74, pan-HLA-DR, oligo-HLA-D, CD68, CD11b, CD4, CD8 and CD31 primary antibodies and metal-conjugated secondary stains, a subset of the antibody set (Supplementary Table 24) stains present in all images. Overlay of pseudocolor images as well as individual channels for CD74, pan-HLA-DR, oligo-HLA-D, CD68, CD11b and CD4, (white, overlap; orange, CD74; cyan, pan-HLA-DR; green, oligo-HLA-D; yellow, CD68; purple, CD11b; blue, CD4; grey, CD8; red, CD31), Scale bars = 50 μm. Shown are 8 antibodies stained for. Arrowheads identify blood vessel ECs in close contact with immune cell expressing the indicated markers in the different tissues. Arrows identify blood vessel ECs not in close contact with immune cell expressing the indicated markers.
Extended Data Fig. 13
Extended Data Fig. 13. Validation of MHC class II mediated endothelial-immune cell interactions in the adult and pathological brain vasculature using IMC.
a,d,g,j,m,p, Circle plots showing the strength of MHC class II signalling interactions between the different cell types of adult/control brain (a) arteriovenous malformation (d), lower-grade glioma (g), glioblastoma (j), metastasis (m) and meningioma (p) cells. b-c’8, e-f’8, h-i’8, k-l’8, n-o’8, q-r’8, Mass cytometry (IMC) imaging of the indicated adult control and pathological brain tissue samples using metal-conjugated CD74, pan-HLA-DR, oligo-HLA-D, CD68, CD11b, CD4, CD8 and CD31 primary antibodies and metal-conjugated secondary stains. Overlay of pseudocolor images as well as individual channels of the different markers (white, overlap; orange, CD74; cyan, pan-HLA-DR; green, oligo-HLA-D; yellow, CD68; purple, CD11b; blue, CD4; grey, CD8; red, CD31), Scale bars: 250 μm in overviews, 50 μm in zooms. Shown are 5 antibodies stained for (Supplementary Table 24). Arrowheads identify blood vessels ECs in close contact with immune cell expressing the indicated markers in the different tissues. Arrows identify blood vessel ECs not in close contact with immune cells expressing the indicated markers.

Comment in

References

    1. Wälchli, T. et al. Shaping the brain vasculature in development and disease in the single-cell era. Nat. Rev. Neurosci.24, 271–298 (2023). - PMC - PubMed
    1. Cho, C., Smallwood, P. M. & Nathans, J. Reck and Gpr124 are essential receptor cofactors for Wnt7a/Wnt7b-Specific signaling in mammalian CNS angiogenesis and blood-brain barrier regulation. Neuron95, 1221–1225 (2017). - PubMed
    1. Wälchli, T. et al. Wiring the vascular network with neural cues: a CNS perspective. Neuron87, 271–296 (2015). - PubMed
    1. Sweeney, M. D., Kisler, K., Montagne, A., Toga, A. W. & Zlokovic, B. V. The role of brain vasculature in neurodegenerative disorders. Nat. Neurosci.21, 1318–1331 (2018). - PMC - PubMed
    1. Zlokovic, B. V. The blood-brain barrier in health and chronic neurodegenerative disorders. Neuron57, 178–201 (2008). - PubMed

MeSH terms