. 2024 Jul;4(7):939-948.
doi: 10.1038/s43587-024-00655-7. Epub 2024 Jul 10.

Blood protein assessment of leading incident diseases and mortality in the UK Biobank

Collaborators, Affiliations

Blood protein assessment of leading incident diseases and mortality in the UK Biobank

Danni A Gadd et al. Nat Aging. 2024 Jul.

Abstract

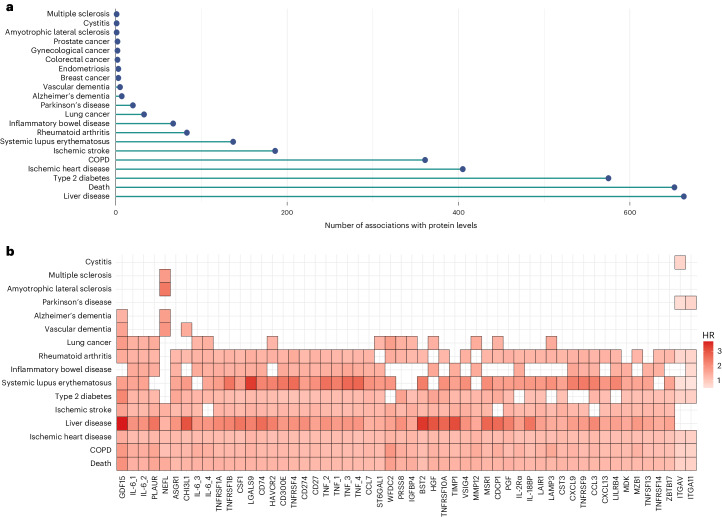
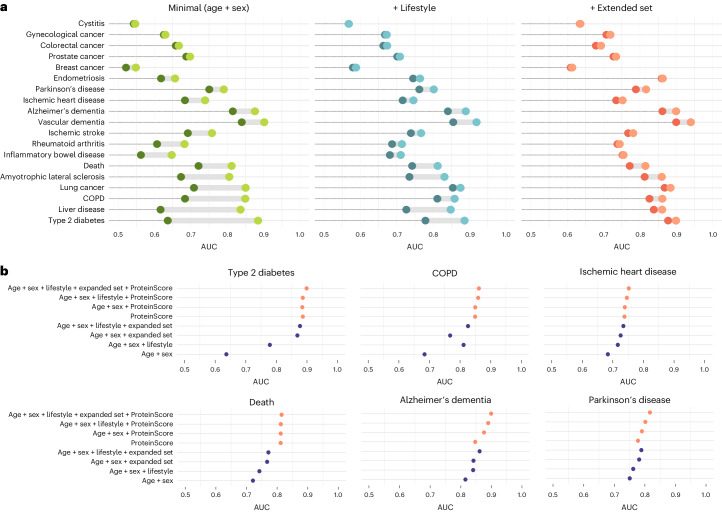
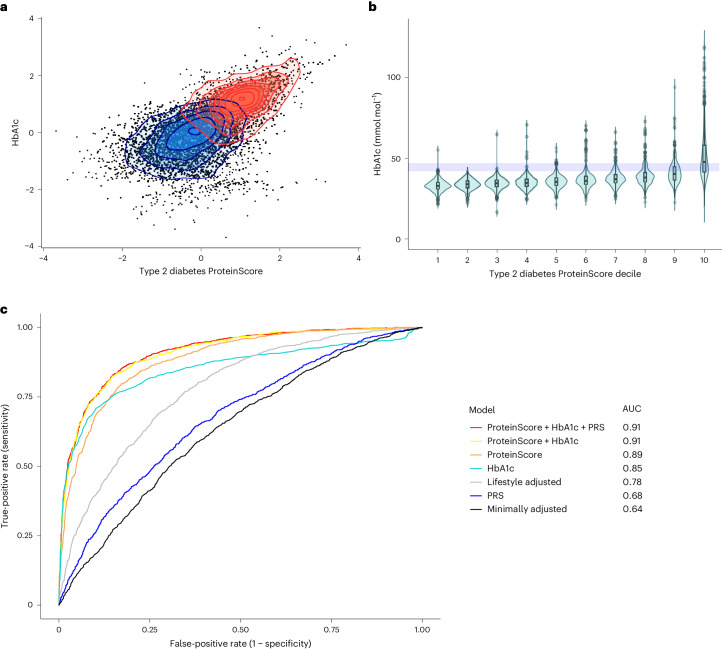
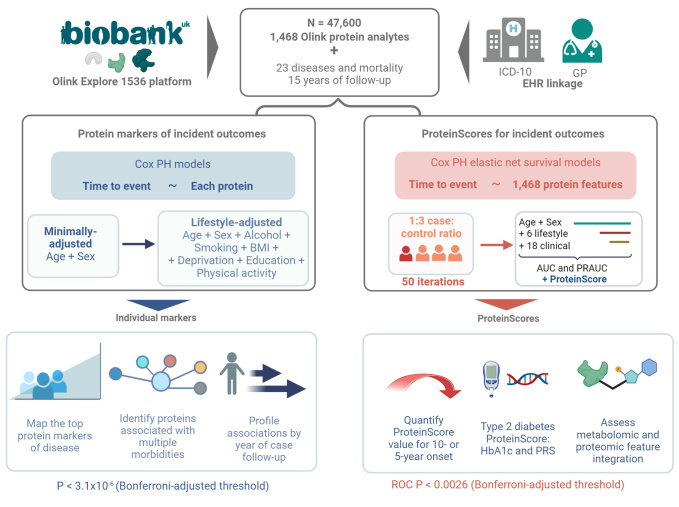
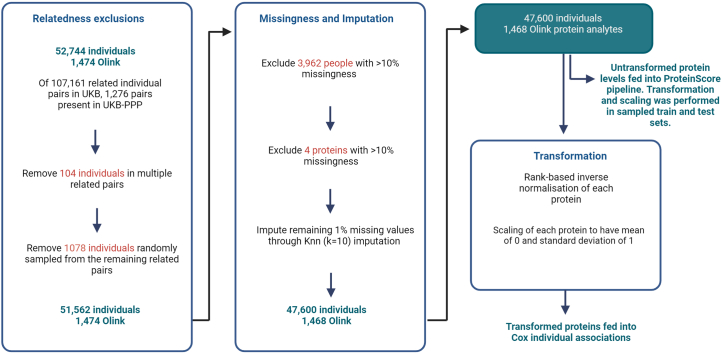
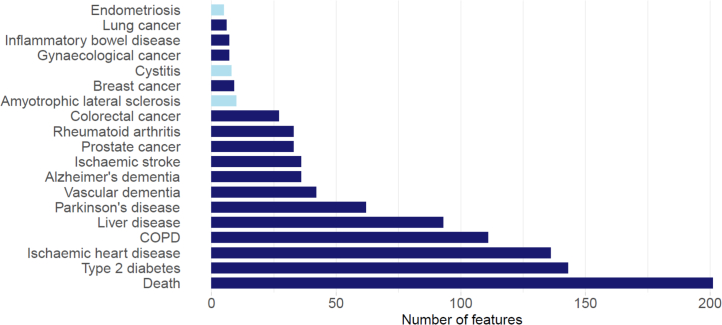
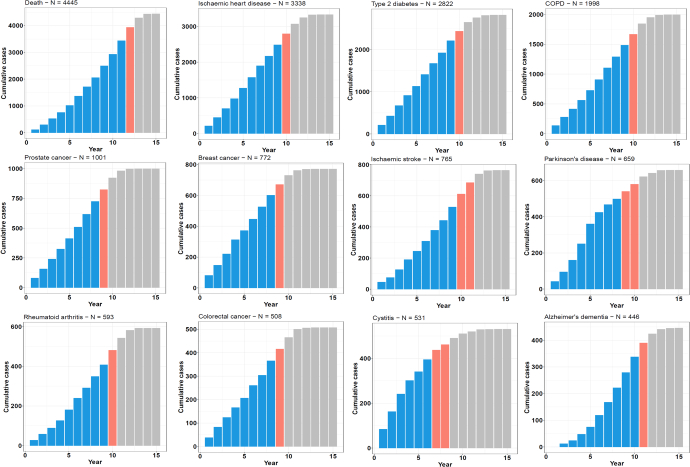
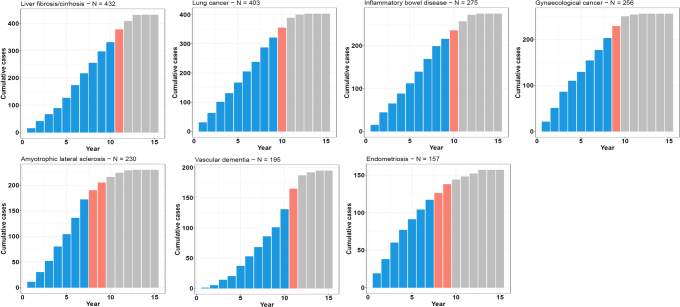
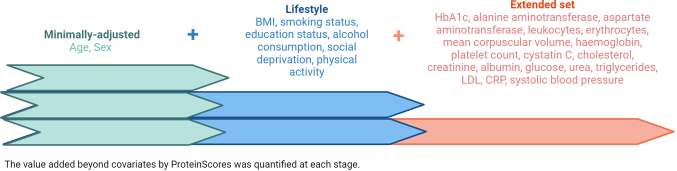
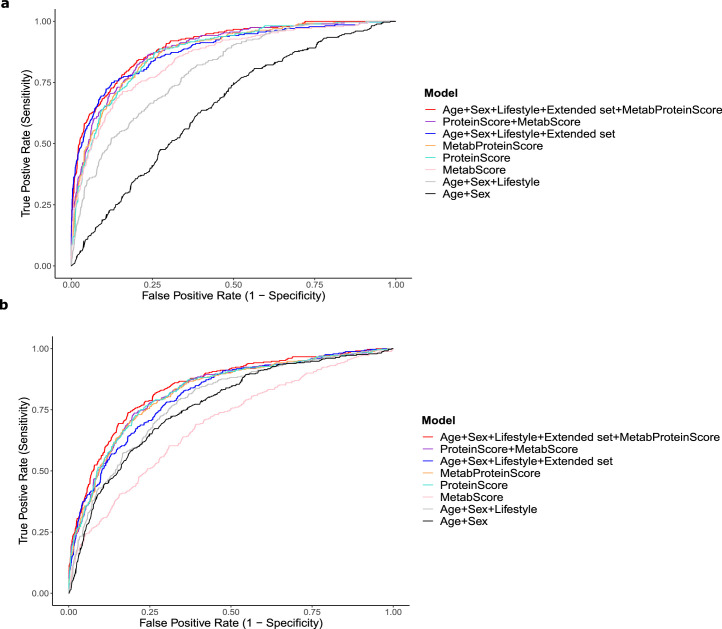
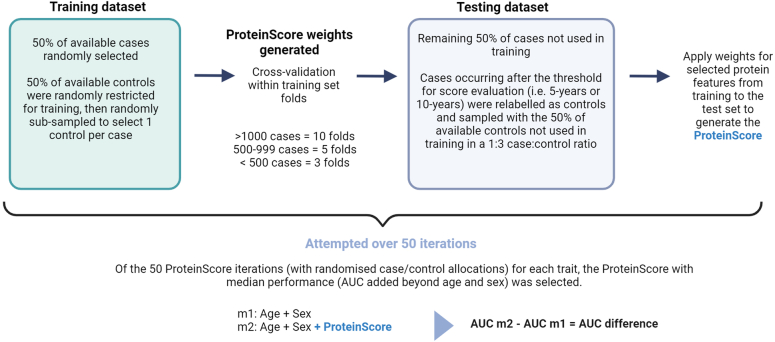
The circulating proteome offers insights into the biological pathways that underlie disease. Here, we test relationships between 1,468 Olink protein levels and the incidence of 23 age-related diseases and mortality in the UK Biobank (n = 47,600). We report 3,209 associations between 963 protein levels and 21 incident outcomes. Next, protein-based scores (ProteinScores) are developed using penalized Cox regression. When applied to test sets, six ProteinScores improve the area under the curve estimates for the 10-year onset of incident outcomes beyond age, sex and a comprehensive set of 24 lifestyle factors, clinically relevant biomarkers and physical measures. Furthermore, the ProteinScore for type 2 diabetes outperforms a polygenic risk score and HbA1c-a clinical marker used to monitor and diagnose type 2 diabetes. The performance of scores using metabolomic and proteomic features is also compared. These data characterize early proteomic contributions to major age-related diseases, demonstrating the value of the plasma proteome for risk stratification.


Conflict of interest statement

B.B.S., R.A., J.G., T.L., K.F. and H.R. are employed by Biogen. C.N.F., Z.K., D.A.G., M.D. and T.M. are employed by Optima Partners—a data consultancy agency employed by Biogen. D.A.G., R.F.H. and R.E.M. have received consultancy fees from Optima Partners. R.E.M. is an advisor to the Epigenetic Clock Development Foundation. R.F.H. has received consultancy fees from Illumina. The other authors declare no competing interests.

Figures

Fig. 1
Fig. 1. Individual protein associations with incident outcomes in the UK Biobank (n = 47,600).
a, Number of associations between protein analytes and time to onset for 21 outcomes that had P < 3.1 × 10−6 (Bonferroni-adjusted threshold) in both basic and fully adjusted Cox PH models. There were 3,209 associations in total involving 963 protein analytes. Two-sided tests were used in all cases. b, HR per 1 s.d. higher level of the transformed protein analytes (compared within individuals at baseline). Fifty-four protein analytes that were associated with eight or more outcomes in the individual Cox PH models are shown. Each association is represented by a rectangle. Cox PH models were adjusted for age, sex and six lifestyle factors (BMI, alcohol consumption, social deprivation, educational attainment, smoking status and physical activity). Every association identified for these proteins had HR > 1 (red), and associations are shaded based on the HR effect size (darkest coloration indicating a larger magnitude of effect). The largest HR shown is for the association between GDF15 levels and liver disease (HR = 3.7). Source data
Fig. 2
Fig. 2. Value offered by ProteinScores for incident outcomes in the UK Biobank.
a, Differences in AUC resulting from the addition of the 19 ProteinScores to models with increasingly extensive sets of covariates: minimally adjusted (age and sex in which traits were not sex-stratified) in green, minimally adjusted with the addition of a core set of six lifestyle covariates in blue, and further adjustment for an extended set of 18 covariates that are measured in clinical settings (physical and biochemical measures) in orange. AUC plots are ordered by increasing AUC differences in the minimally adjusted models. All ProteinScore performance statistics shown correspond to 10-year onset, except those for amyotrophic lateral sclerosis, endometriosis and cystitis, which were assessed for 5-year onset. Darker-shaded points indicate the base covariate model used, whereas lighter-shaded points connected by gray shading indicate the difference added by the addition of the ProteinScore into the model. b, A breakdown of the AUC values achieved by different combinations of risk factors with and without the ProteinScores is shown for the six incident outcomes whereby the ProteinScore contributed statistically significantly beyond a Cox PH model including all 24 minimal, lifestyle and extended set variables (ROC P < 0.0026, the Bonferroni-adjusted threshold). All six of the best-performing ProteinScores shown were assessed for the 10-year onset of the disease. Results that include the ProteinScore are shaded in orange, whereas results that do not are shaded in purple. Two-sided tests were used in all cases. Source data
Fig. 3
Fig. 3. Exploration of the type 2 diabetes ProteinScore.
a, Case (red) and control (blue) discrimination for HbA1c and the type 2 diabetes ProteinScore in the test set (1,105 cases and 3,264 controls, mean time to case onset 5.4 years (s.d. 3.0 years)). Both markers were rank-based inverse normalized and scaled to have a mean of 0 and s.d. of 1. b, HbA1c (mmol mol−1) per decile of the type 2 diabetes ProteinScore in the test set (1,105 cases and 3,264 controls, mean time to case onset 5.4 years (s.d. 3.0 years)). The shaded rectangle indicates the type 2 diabetes HbA1c screening threshold (42–47 mmol mol−1). Violin plots display the median and upper and lower quartiles as the three lines comprising the central rectangle, with minima and maxima points corresponding to those at the tips of the plot whiskers. c, ROC curves for incremental 10-year-onset models incorporating HbA1c, the type 2 diabetes ProteinScore and a PRS for type 2 diabetes individually and concurrently. Source data
Extended Data Fig. 1
Extended Data Fig. 1. Study design summary for protein assessment of leading incident diseases in the UK Biobank (N=47,600).
Individual Cox proportional hazards (PH) models were used to profile relationships between baseline protein analytes and incident diseases or death, over a maximum of 15 years of electronic health linkage pertaining to cases. Associations that had P < 3.1x10⁻⁶ (Bonferroni-adjusted threshold) in minimally-adjusted (age and sex) and lifestyle-adjusted models were retained. Proteins associated with multiple morbidities were identified and associations were explored by year of case follow-up. Next, proteomic predictors (ProteinScores) were trained using Cox PH elastic net regression for 19 of the incident outcomes with a minimum of 150 cases. All ProteinScores were developed for 10-year onset of disease, except endometriosis, cystitis and amyotrophic lateral sclerosis that had case distributions that were better-suited to 5-year assessment (80% of cases diagnosed by year 8 of follow-up). Of fifty ProteinScore iterations with randomly sampled train and test populations, the ProteinScore with median improvement in AUC beyond a minimally-adjusted model was selected. Improvements in AUC due to adding the ProteinScores into models with increasingly complex covariate structures were quantified. The type 2 diabetes trait was taken forward as a case study to explore the potential value ProteinScores may offer, in the context of HbA1c (a clinically used biomarker) and a polygenic risk score (PRS). Integration of metabolomics features for scoring was investigated for death and type 2 diabetes outcomes as case studies. Created with BioRender.com.
Extended Data Fig. 2
Extended Data Fig. 2. Summary of processing steps applied to the protein measurement data in UKB-PPP.
Related individuals were excluded, leaving a dataset containing 51,562 individuals with 1,474 Olink protein analytes measured. Next, 3,962 individuals that had >10% missing data were excluded, followed by four proteins that had >10% missing data. The remaining missing protein measurements (1% of total measurements) were imputed through K-nearest neighbours (Knn; k=10) imputation. The final dataset was comprised of 47,600 individuals and 1,468 Olink protein analytes. Protein levels were rank-based inverse normalised and scaled to have a mean of 0 and standard deviation of 1 prior to individual Cox PH analyses. Untransformed protein levels were fed into the model pipeline for ProteinScore development and were rank-based inverse normalised and scaled to have a mean of 0 and standard deviation of 1 in train and test sets separately once these were sampled for each outcome. Created with BioRender.com.
Extended Data Fig. 3
Extended Data Fig. 3. ProteinScore feature selection.
The total number of contributing protein analyte features selected for each ProteinScore. Incident outcomes that were assessed for 5-year onset (light blue) and 10-year onset (dark blue) are delineated. Source data
Extended Data Fig. 4
Extended Data Fig. 4. Cumulative time-to-onset for cases by outcome in the UK Biobank PPP sample.
Case counts are shown for each trait, with the number of cases by year of follow-up plotted cumulatively and the year that the proportion of cases diagnosed reached 80% (orange) and 90% (grey) demarcated. COPD: chronic obstructive pulmonary disease. Source data
Extended Data Fig. 5
Extended Data Fig. 5. Cumulative time-to-onset for cases by outcome in the UK Biobank PPP sample.
Case counts are shown for each trait, with the number of cases by year of follow-up plotted cumulatively and the year that the proportion of cases diagnosed reached 80% (orange) and 90% (grey) demarcated. Source data
Extended Data Fig. 6
Extended Data Fig. 6. Comprehensive covariates that were modelled to evaluate the value added by the ProteinScores beyond these covariates.
Three increasingly complex sets of covariates were considered: 1) age and sex (where traits had not been sex-stratified), 2) further adjustment for a core set of six lifestyle and health covariates (BMI, alcohol consumption, social deprivation, educational attainment, smoking status and physical activity) and 3) further adjustment for an extended set of 18 biochemistry and physical attributes that are measurable in clinical settings. Performance when using only the ProteinScores was also considered. When modelled alongside age and sex, 26 possible covariates were therefore used in maximally-adjusted models. Created with BioRender.com.
Extended Data Fig. 7
Extended Data Fig. 7. Comparison of metabolomic and proteomic feature performance for type 2 diabetes and all-cause mortality traits.
ROC curves for 10-year onset scores developed in the subsets of the training and test populations that had metabolomics and proteomics available. A Metabolomic score (MetaboScore), ProteinScore and a joint omics score (MetaboProteinScore) are modelled individually and concurrently and benchmarked against either age and sex, six lifestyle factors, or an ‘extended set’ including these variables in addition to a further 18 clinically relevant covariates. a, ROC curve comparison for type 2 diabetes. b, ROC curve comparison for all-cause mortality. Full summary statistics are available in Supplementary Table 16. Source data
Extended Data Fig. 8
Extended Data Fig. 8. Summary of the ProteinScore development pipeline.
ProteinScores were developed across fifty randomised iterations. For each iteration, 50% of available cases were randomly allocated to the training set and 50% of controls were randomly sampled to obtain a 1:3 case:control ratio. Cox PH elastic net regression with cross-fold validation across folds of the training sample was used to derive weighting coefficients. The 50% of cases that were not included in the training set were allocated to the test set. If cases in the test set occurred after the threshold for onset evaluation (that is 5-year or 10-year), they were relabelled as controls and randomly sampled with the 50% of controls not considered during training, to obtain a 1:3 case:control ratio. Of the fifty ProteinScore iterations tested, the ProteinScore that yielded the median incremental difference to the Area Under the Curve (AUC) beyond a minimally-adjusted model was identified. If no features were selected for an iteration, it was weighted with a performance of 0 in median AUC selection. If features were selected for an iteration but the randomly sampled test set included no cases at or beyond the onset threshold (precluding extraction of baseline hazard at this point for AUC calculation) these models were excluded from the median ProteinScore selection. Created with BioRender.com.

References

    1. Yao C, et al. Genome-wide mapping of plasma protein QTLs identifies putatively causal genes and pathways for cardiovascular disease. Nat. Commun. 2018;9:3268. doi: 10.1038/s41467-018-05512-x. - DOI - PMC - PubMed
    1. Ferkingstad E, et al. Large-scale integration of the plasma proteome with genetics and disease. Nat. Genet. 2021;53:1712–1721. doi: 10.1038/s41588-021-00978-w. - DOI - PubMed
    1. Pietzner M, et al. Mapping the proteo-genomic convergence of human diseases. Science. 2021;374:eabj1541. doi: 10.1126/science.abj1541. - DOI - PMC - PubMed
    1. Sun BB, et al. Genomic atlas of the human plasma proteome. Nature. 2018;558:73–79. doi: 10.1038/s41586-018-0175-2. - DOI - PMC - PubMed
    1. Gudmundsdottir V, et al. Circulating protein signatures and causal candidates for type 2 diabetes. Diabetes. 2020;69:1843–1853. doi: 10.2337/db19-1070. - DOI - PMC - PubMed

LinkOut - more resources