. 2024 Sep;19(9):1344-1353.
doi: 10.1038/s41565-024-01711-4. Epub 2024 Jul 10.

Graphene oxide electrodes enable electrical stimulation of distinct calcium signalling in brain astrocytes

Affiliations

Graphene oxide electrodes enable electrical stimulation of distinct calcium signalling in brain astrocytes

Roberta Fabbri et al. Nat Nanotechnol. 2024 Sep.

Erratum in

Abstract

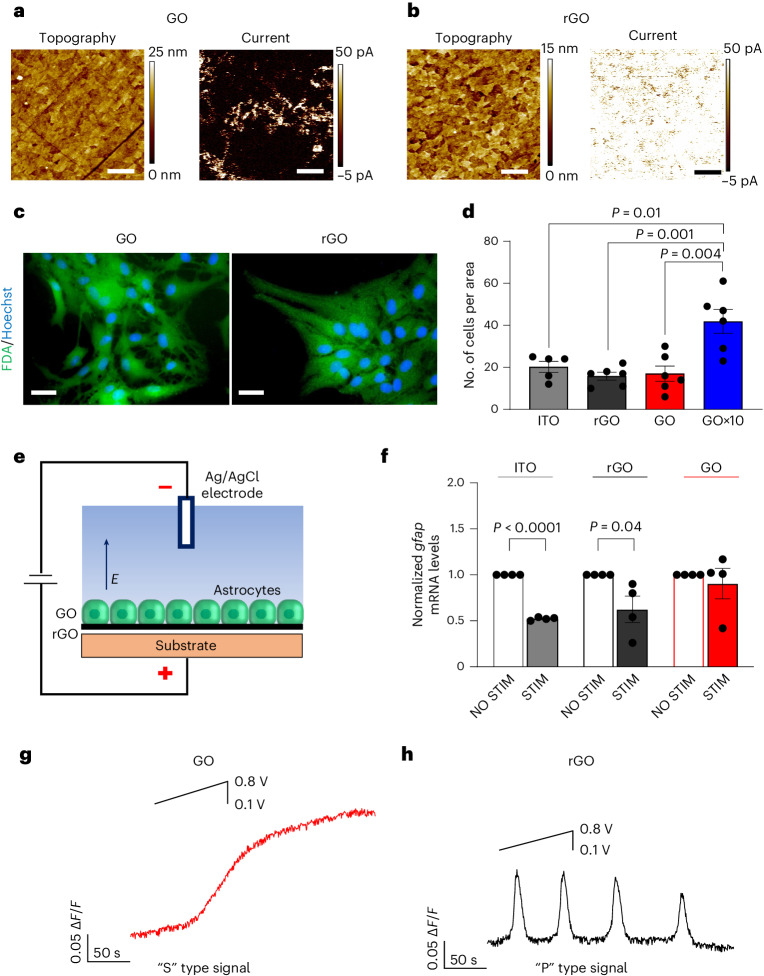
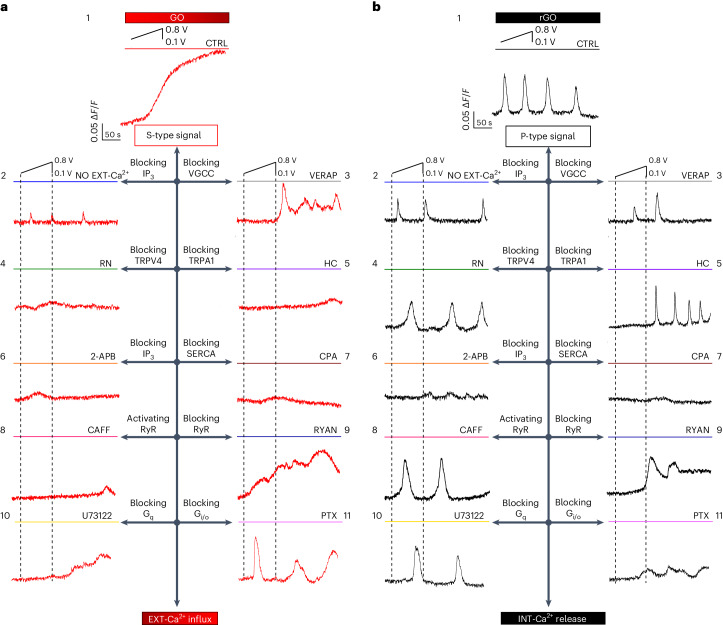
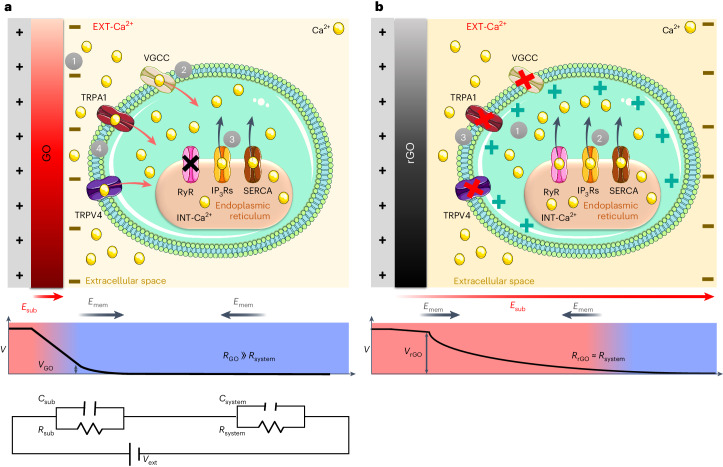
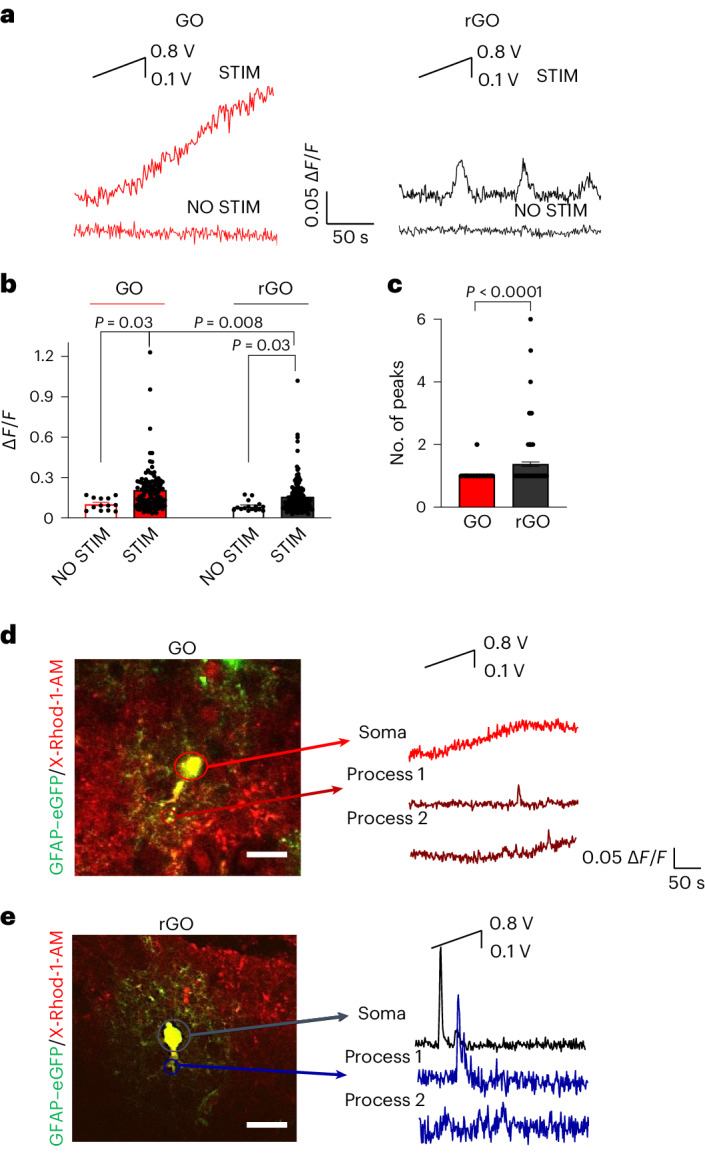
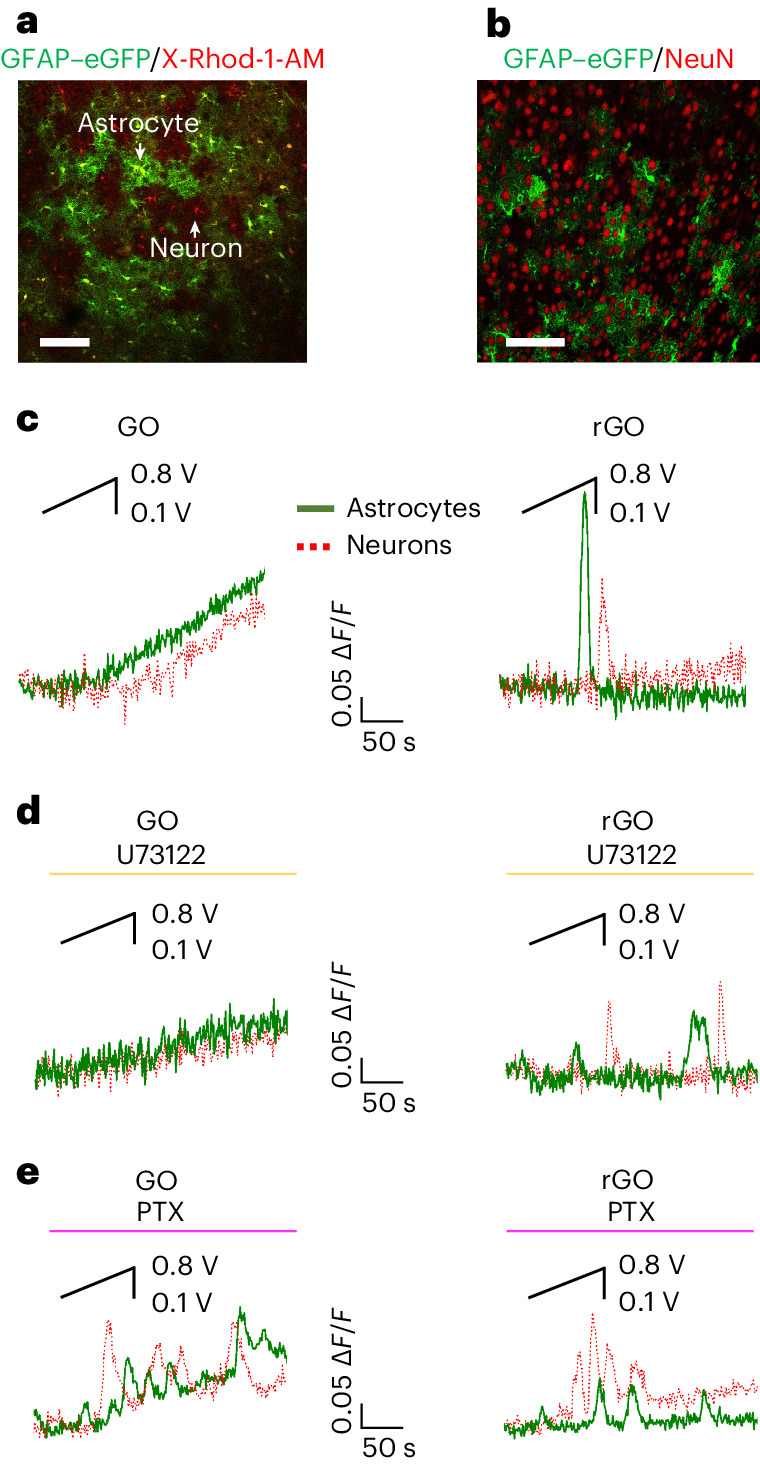
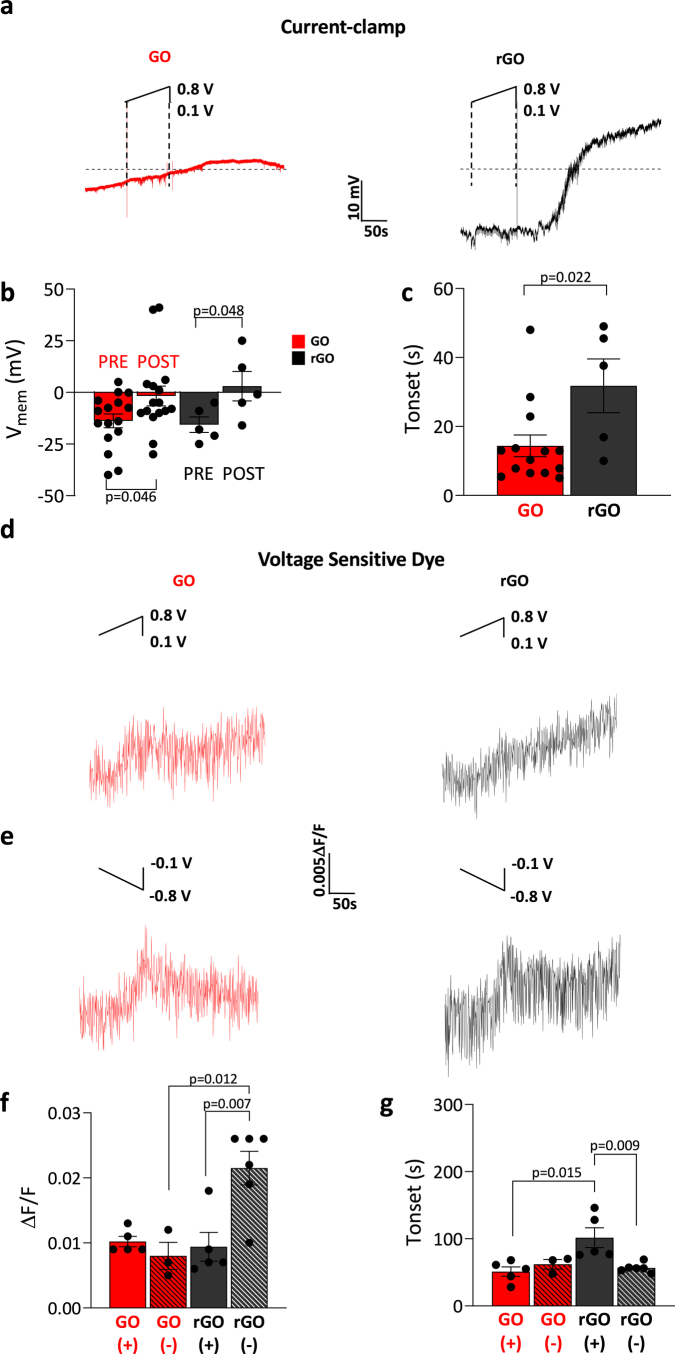
Astrocytes are responsible for maintaining homoeostasis and cognitive functions through calcium signalling, a process that is altered in brain diseases. Current bioelectronic tools are designed to study neurons and are not suitable for controlling calcium signals in astrocytes. Here, we show that electrical stimulation of astrocytes using electrodes coated with graphene oxide and reduced graphene oxide induces respectively a slow response to calcium, mediated by external calcium influx, and a sharp one, exclusively due to calcium release from intracellular stores. Our results suggest that the different conductivities of the substrate influence the electric field at the cell-electrolyte or cell-material interfaces, favouring different signalling events in vitro and ex vivo. Patch-clamp, voltage-sensitive dye and calcium imaging data support the proposed model. In summary, we provide evidence of a simple tool to selectively control distinct calcium signals in brain astrocytes for straightforward investigations in neuroscience and bioelectronic medicine.


Conflict of interest statement

The authors declare no competing interests.

Figures

Fig. 1
Fig. 1. GO- and rGO-coated electrodes enable the electrical stimulation of calcium signalling in astrocytes.
a,b, AFM characterization of GO and rGO coatings. Topography (left panels) and corresponding PeakForce TUNA current (right panels) images of GO- (a) and rGO-coated ITO electrodes (b). The current image is taken with a voltage bias Vb = 1 V. The scale bars are all 1 µm. c, Fluorescent images of astrocytes stained with fluorescein diacetate (FDA) and Hoechst 33342 for GO (left panel) and rGO (right panel). Scale bars, 25 μm. d, Bar–dot graph reporting the number of cells per area counted on the different samples. Data are presented as mean ± s.e.m. For ITO, n = 5, N = 3, no. of cells/area = 20.2 ± 2.6. For rGO, n = 6, N = 3, no. of cells/area = 15.8 ± 1.9. For GO, n = 6, N = 3, no. of cells/area = 17 ± 3.7. For GO×10, n = 6; N = 3, no. of cells/area = 41.8 ± 5.7. n, number of analysed images, N, number of experiments. Statistical significance was calculated via one-way analysis of variance (ANOVA) with Bonferroni post-test. P values are reported in the graph when P ≤ 0.05, which was considered significant. No statistically significant differences were observed between ITO and rGO (P = 0.2), GO and rGO (P = 0.8) or ITO and GO (P = 0.5). e, Scheme of the experimental set-up for the electrical stimulation, showing the direction of the applied electric field (E). Electrical stimulus was delivered by ramping up the substrate voltage using as a reference an Ag/AgCl grounded electrode immersed in the same saline solution as the sample. The applied voltage protocol was low enough to provide an electrical field suitable for cell stimulation. The voltage protocol consisted in a continuous voltage ramp increasing from 0.1 to 0.8 V in 85 s at a rate of 8.24 mV s−1. The total length of the experiment was 300 s, and the voltage stimulus was applied 25 s after the start of the recording. f, Bar–dot graph reporting transcript levels of the inflammatory marker gfap in astrocytes plated on ITO, rGO and GO before (NO STIM) and after (STIM) electrical stimulation. The y value corresponds to the levels of expression of gfap mRNA normalized with respect to the relative values for β-actin. Data are presented as mean ± s.e.m. N = 4 per condition, in triplicate (pooled). Normalized gfap mRNA levels are for ITO NO STIM 1 ± 0, for ITO STIM 0.5 ± 0.01, for rGO NO STIM 1 ± 0, for rGO STIM 0.6 ± 0.1, for GO NO STIM 1 ± 0 and for GO STIM 0.9 ± 0.2. Statistical significance was calculated via one-way ANOVA with Bonferroni post-test. P values are reported in the graph when P ≤ 0.05, which was considered significant. No statistically significant difference was observed between GO NO STIM and GO STIM (P = 0.6). g,h, Typical [Ca2+]i variations observed in the majority of astrocytes grown respectively on GO- (g) and rGO-coated electrodes (h), in an external standard solution containing Ca2+, when stimulated according to the protocol described above (inset). Sustained S-type signal observed in astrocytes on GO (g) and P-type signal observed on rGO (h). Source data
Fig. 2
Fig. 2. Stimulation by GO/rGO coatings elicits distinct EXT-Ca2+ and INT-Ca2+ dynamics.
a,b, Representative traces of Ca2+ imaging observed after positive voltage bias stimulation of astrocytes, starting at time t ≈ 25 s from the beginning of the experiment (insets to panels 1) plated on GO–ITO- (a) and on rGO–ITO-coated electrodes (b). Different panels refer to the different conditions of the cells exposed to standard bath solution (CTRL, 1) and solution without extracellular Ca2+ (NO EXT-Ca2+, 2) and in the presence of VGCC inhibitor verapamil (VERAP, 25 μM, 3), TRPV4 inhibitor RN-1734 (RN, 10 μM, 4), TRPA1 inhibitor HC-030031 (HC, 40 μM, 5), IP3 receptor pathway inhibitor 2-aminoethoxy diphenyl borate (2-APB, 100 μM, 6), SERCA inhibitor cyclopiazonic acid (CPA, 10 μM, 7), RyR activator caffeine (CAFF, 20 mM, 8), RyR inhibitor ryanodine (RYAN, 50 μM, 9), Gq–PLC inhibitor U73122 (0.5 μM, 10) and Gi/o inhibitor pertussis toxin (PTX, 500 ng ml−1, 11).
Fig. 3
Fig. 3. Bioelectrical model of GO/rGO–astrocyte interface.
a,b, Schematic representation of the proposed mechanism taking place during GO (a) and rGO (b) stimulation and of the consequent cellular response. Upper panels: a, In the case of GO, charge accumulation at the GO–cell interface (1) causes depolarization of the membrane, which promotes opening of VGCCs or TRPA1 and EXT-Ca2+ influx (2). 3, Ca2+ entry leads to calcium-induced calcium release via IP3 or SERCA but not RyR. 4, The IP3 path potentiates the Ca2+ influx mediated by TRPV4 via the calcium-induced calcium increase mechanism,. The entrance of further external Ca2+ into the cell causes a steady increase of cytoplasmic Ca2+ (S-type signal). TRPA1 might be involved in this process as a cooperative channel promoting either maintenance of basal Ca2+ levels or potentiation of the Ca2+ influx over time,. IP3Rs, IP3 receptors. b, In the case of rGO, charge accumulation occurs at the cell–solution interface, inducing depolarization of the cell membrane at the electrolyte–cell interface (1) which might stimulate directly electrically/mechanically the endoplasmic reticulum (2) causing the release of INT-Ca2+ from the stores. 3, The above-mentioned electric field might repulse cations at the cell–electrolyte interface, thus hampering the EXT channel in mediating Ca2+ influx. Lower panels: the potential drop across the substrate (GO, a, and rGO, b), and the direction of electric fields created by the potential applied to the substrate (Esub). The electric fields created on the cell walls by the membrane potential (Emem), pointing inside the cell, are also shown. Bottom panel: the scheme of the equivalent electric circuit, as described in the text.
Fig. 4
Fig. 4. Electrical stimulation by GO/rGO elicits S-type and P-type Ca2+ signalling in astrocytic soma and process in brain slices.
a, Representative traces of Ca2+ imaging experiments performed on brain slices lying on GO (left) and rGO devices (right), using the same voltage protocol as described before (inset). b,c, Bar–dot graphs of maximal averaged fluorescence variation (ΔF/F, b) and number of peaks (c), measured on GO and rGO devices. Data are presented as mean ± s.e.m. For GO, N = 6, s = 13, n = 108, ΔF/F = 0.20 ± 0.02, no. of peaks = 1.02 ± 0.01. For rGO, N = 4, s = 9, n = 142, ΔF/F = 0.16 ± 0.01, no. of peaks = 1.37 ± 0.07. For GO NO STIM, N = 2, s = 2, n = 13, ΔF/F = 0.10 ± 0.01. For rGO NO STIM, N = 2, s = 2, n = 16, ΔF/F = 0.09 ± 0.01. n, number of analysed cells; s, number of slices. Statistical significance was calculated via one-way ANOVA with Bonferroni post-test. P values are reported in the graph when P ≤ 0.05, which was considered significant. d,e, Representative traces of [Ca2+]i over time (right) performed with high magnification on X-Rhod-1/GFAP–eGFP-labelled astrocytes (merged images, left) for slices on GO (d) and on rGO (e), analysed in astrocytic soma and in astrocytic processes. Source data
Fig. 5
Fig. 5. Effects of GO and rGO stimulation on astrocyte and neuron GPCR signalling ex vivo.
a, Confocal fluorescence microscopy image of GFAP–eGFP/X-Rhod-1-AM-labelled cells revealing the co-presence of astrocytes (yellow cells) and neurons (red cells). b, Immunohistochemical image of GFAP–eGFP-labelled astrocytes (green cells) and neuronal cell protein marker (NeuN)-positive neurons (red cells) in brain slice. ce, Representative traces of Ca2+ imaging experiments performed on brain slices lying on GO and rGO, analysed in neurons and astrocytes, recorded in control saline (c) and after exposure to U73122 (4 μM) (d) and Gi/o–GPCR inhibitor PTX (7.5 μg ml−1) (e).
Extended Data Fig. 1
Extended Data Fig. 1. Electrical stimulation by GO and rGO-coated electrodes induces depolarization of astrocytes with different onsets.
a, Typical patch-clamp current clamp traces, showing Voltage membrane variations over time, recorded before, during and after the application of the same voltage protocol of Ca2+ experiments (insets). b, Bar–dot graph reporting the averaged variation of voltage membrane (Vmem (mV)), before the stimulation (PRE) and at the maximal value recorded after the stimulation (POST) of astrocytes plated on GO (red bar) and rGO (black bar) devices. Data are presented as mean ± Standard Error of the mean. n=number of analysed cells, N=number of experiments. For GO: n = 16, N = 4, Vmem PRE (mV)=-13.8 ± 3.3, Vmem POST (mV) =-1.75 ± 4.7. For rGO, n = 11, N = 4, Vmem PRE (mV)=-15.3 ± 3.7, Vmem POST (mV)=-3 ± 7. Statistical significance was calculated via one-way ANOVA with Bonferroni post-test. p values are reported in the graph when p ≤ 0.05, which was considered significant. No significant differences were observed between Vmem PRE GO and Vmem PRE rGO (p = 0.8) and between Vmem POST GO and Vmem POST rGO (p = 0.6). c, Bar–dot graph reporting the time point of the onset (Tonset(s)) of the response for astrocytes plated on GO (red bar) and rGO devices (black bar) devices. Data are presented as mean ± Standard Error of the mean. n=number of analysed cells, N=number of experiments. For GO: n = 14, N = 4, Tonset (s)= 14.4 ± 3.1. For rGO: n = 5, N = 4, Tonset (s)=31.8 ± 7.8. Statistical significance was calculated via one-way ANOVA with Bonferroni post-test. p values are reported in the graph when p ≤ 0.05, which was considered significant. d, e, Typical ΔF/F over time of Fluovolt VSD imaging, observed in response to the same voltage stimulations protocols applied for Ca2+ imaging experiments, on astrocytes plated on GO (d, e, left panels, red traces) and on rGO (d, e, right panels, black traces) before, during and after the stimulation with positive (d) and negative biases (e). Positive voltage protocol (d) is the same described in Fig. 1, negative voltage protocol had the same duration but inverted polarity (e, V from -0.1 V to -0.8 V). f, g, Bar–dot graphs of fluorescence variation measurements performed on GO and rGO: f) maximal averaged fluorescence variation after the stimulation (ΔF/F), g) onset time of the response (Tonset (s)), measured using positive (+) and negative (-) voltage protocols for astrocytes stimulation. Data are presented as mean ± Standard Error of the mean. nROI= number of Regions Of Interest, N=number of experiments. For GO (+): n ROI = 270, N = 5, ΔF/F = 0.010 ± 0.0008, Tonset (s)=51.2 ± 7. For rGO (+): n ROI = 335, N = 5, ΔF/F = 0.009 ± 0.002, Tonset (s)=101.6 ± 14.7. For GO (-): nROI=156, N = 3, ΔF/F = 0.008 ± 0.002, Tonset (s)=62 ± 7. For rGO (-): nROI=367, N = 6, ΔF/F = 0.022 ± 0.003, Tonset (s)=56.5 ± 2.8. Statistical significance was calculated via one-way ANOVA with Bonferroni post-test. p values are reported in the graph when p ≤ 0.05, which was considered significant. No significant differences were observed between ΔF/F GO (+) and ΔF/F GO (-) (p = 0.3), between ΔF/F GO (+) and ΔF/F rGO (+) (p = 0.7), between Tonset (s) GO (+) and Tonset (s) GO (-) (p = 0.3). Source data

References

    1. Verkhratsky, A. & Nedergaard, M. Physiology of astroglia. Physiol. Rev.98, 239–389 (2018). - PMC - PubMed
    1. Goenaga, J., Araque, A., Kofuji, P. & Herrera Moro Chao, D. Calcium signalling in astrocytes and gliotransmitter release. Front. Synaptic Neurosci.15, 1138577 (2023). - PMC - PubMed
    1. Bazargani, N. & Attwell, D. Astrocyte calcium signalling: the third wave. Nat. Neurosci.19, 182–189 (2016). - PubMed
    1. de Ceglia, R. et al. Specialized astrocytes mediate glutamatergic gliotransmission in the CNS. Nature622, 120–129 (2023). - PMC - PubMed
    1. Lia, A. et al. Calcium signals in astrocyte microdomains, a decade of great advances. Front. Cell Neurosci.15, 673433 (2021). - PMC - PubMed

LinkOut - more resources