

Effects of different energy levels in low-protein diet on liver lipid metabolism in the late-phase laying hens through the gut-liver axis
- PMID: 38987834
- PMCID: PMC11238517
- DOI: 10.1186/s40104-024-01055-y
Effects of different energy levels in low-protein diet on liver lipid metabolism in the late-phase laying hens through the gut-liver axis
Abstract
Background: The energy/protein imbalance in a low-protein diet induces lipid metabolism disorders in late-phase laying hens. Reducing energy levels in the low-protein diet to adjust the energy-to-protein ratio may improve fat deposition, but this also decreases the laying performance of hens. This study investigated the mechanism by which different energy levels in the low-protein diet influences liver lipid metabolism in late-phase laying hens through the enterohepatic axis to guide feed optimization and nutrition strategies. A total of 288 laying hens were randomly allocated to the normal-energy and normal-protein diet group (positive control: CK) or 1 of 3 groups: low-energy and low-protein diet (LL), normal-energy and low-protein diet (NL), and high-energy and low-protein diet (HL) groups. The energy-to-protein ratios of the CK, LL, NL, and HL diets were 0.67, 0.74, 0.77, and 0.80, respectively.
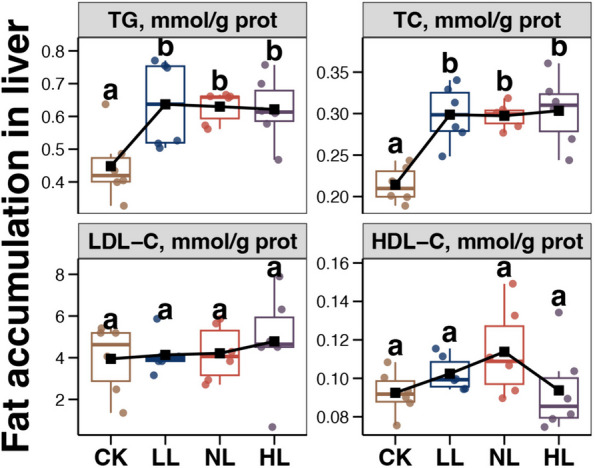
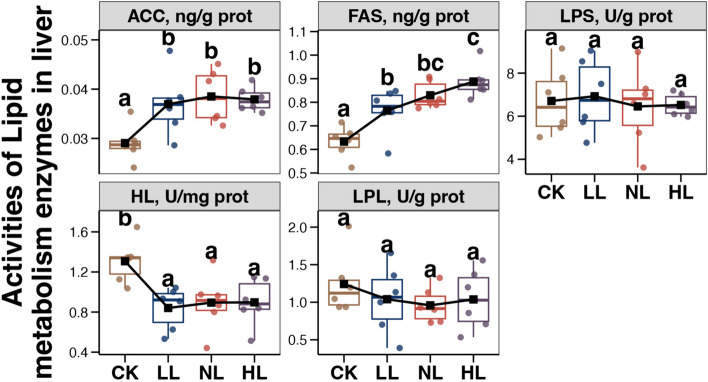
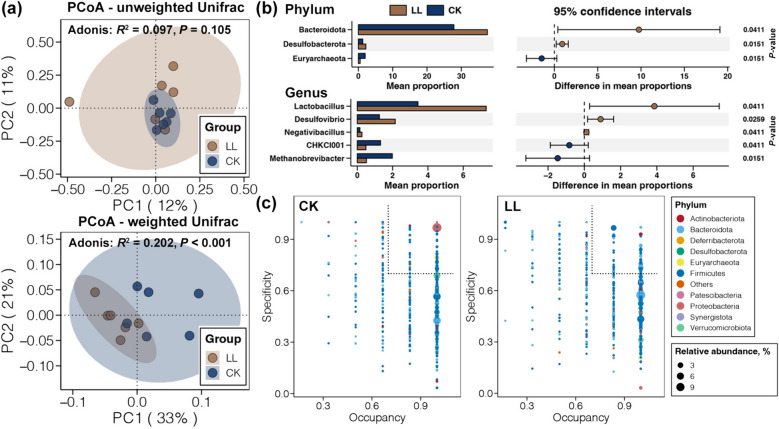
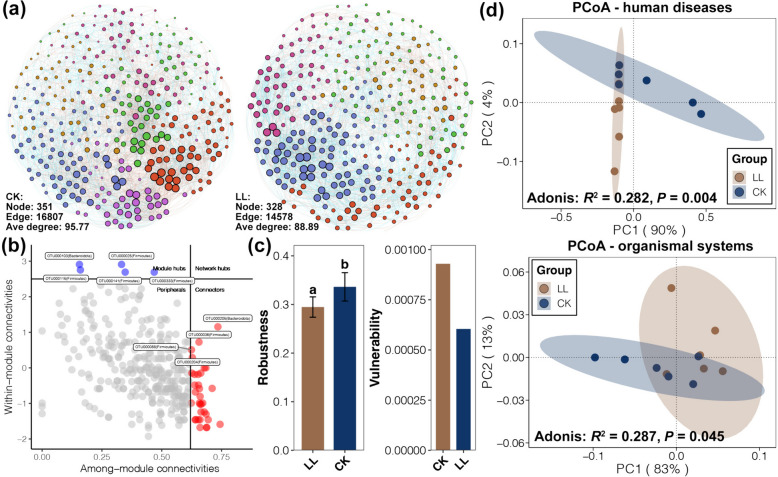
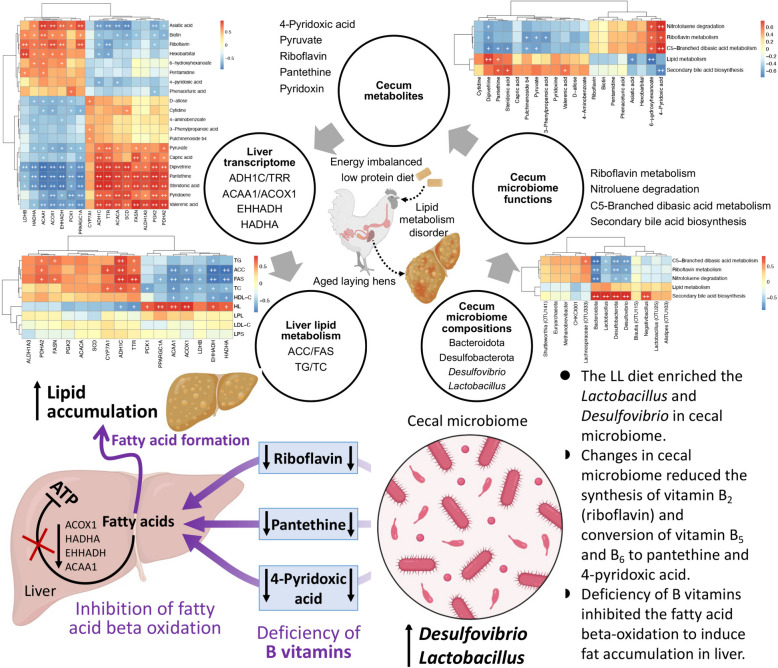
Results: Compared with the CK group, egg quality deteriorated with increasing energy intake in late-phase laying hens fed low-protein diet. Hens fed LL, NL, and HL diets had significantly higher triglyceride, total cholesterol, acetyl-CoA carboxylase, and fatty acid synthase levels, but significantly lower hepatic lipase levels compared with the CK group. Liver transcriptome sequencing revealed that genes involved in fatty acid beta-oxidation (ACOX1, HADHA, EHHADH, and ACAA1) were downregulated, whereas genes related to fatty acid synthesis (SCD, FASN, and ACACA) were upregulated in LL group compared with the CK group. Comparison of the cecal microbiome showed that in hens fed an LL diet, Lactobacillus and Desulfovibrio were enriched, whereas riboflavin metabolism was suppressed. Cecal metabolites that were most significantly affected by the LL diet included several vitamins, such as riboflavin (vitamin B2), pantethine (vitamin B5 derivative), pyridoxine (vitamin B6), and 4-pyridoxic acid.
Conclusion: A lipid metabolism disorder due to deficiencies of vitamin B2 and pantethine originating from the metabolism of the cecal microbiome may be the underlying reason for fat accumulation in the liver of late-phase laying hens fed an LL diet. Based on the present study, we propose that targeting vitamin B2 and pantethine (vitamin B5 derivative) might be an effective strategy for improving lipid metabolism in late-phase laying hens fed a low-protein diet.
Keywords: Cecal microbiome; Energy/protein imbalance; Late-phase laying hens laying hens; Liver lipid metabolism; Low-protein diet; Multi-omics.
© 2024. The Author(s).
Conflict of interest statement
The authors have declared that they have no competing interests.
Figures


References
-
- Underwood G, Andrews D, Phung T. Advances in genetic selection and breeder practice improve commercial layer hen welfare. Anim Prod Sci. 2021;61(10):856–866. doi: 10.1071/AN20383. - DOI
-
- Alzarah MI, Alaqil AA, Abbas AO, Nassar FS, Mehaisen GM, Gouda GF, et al. Inclusion of Citrullus colocynthis seed extract into diets induced a hypoli-pidemic effect and improved layer performance. Agriculture. 2021;11(9):808. doi: 10.3390/agriculture11090808. - DOI
-
- Such N, Pál L, Strifler P, Horváth B, Koltay IA, Rawash MA, et al. Effect of feeding low protein diets on the production traits and the nitrogen composition of excreta of broiler chickens. Agriculture. 2021;11(8):781. doi: 10.3390/agriculture11080781. - DOI
Grants and funding
- CARS-40-S25/China Agriculture Research System
- 2022YFD1601905/National Key R&D Program of China
- XDYC-CYCX-2022-0029/the Industrial Innovation Talent Project of the "Xing Dian Talent Support Program" of Yunnan Province in 2022
- 2023/the Young Talent Project of the "Xing Dian Talent Support Program" of Yunnan Province
LinkOut - more resources
Full Text Sources
Research Materials
Miscellaneous
