. 2024 May-Jun;49(3):318-338.
doi: 10.1002/col.22918. Epub 2024 Jan 3.

Color sorting and color term evolution

Affiliations

Color sorting and color term evolution

Delwin T Lindsey et al. Color Res Appl. 2024 May-Jun.

Abstract

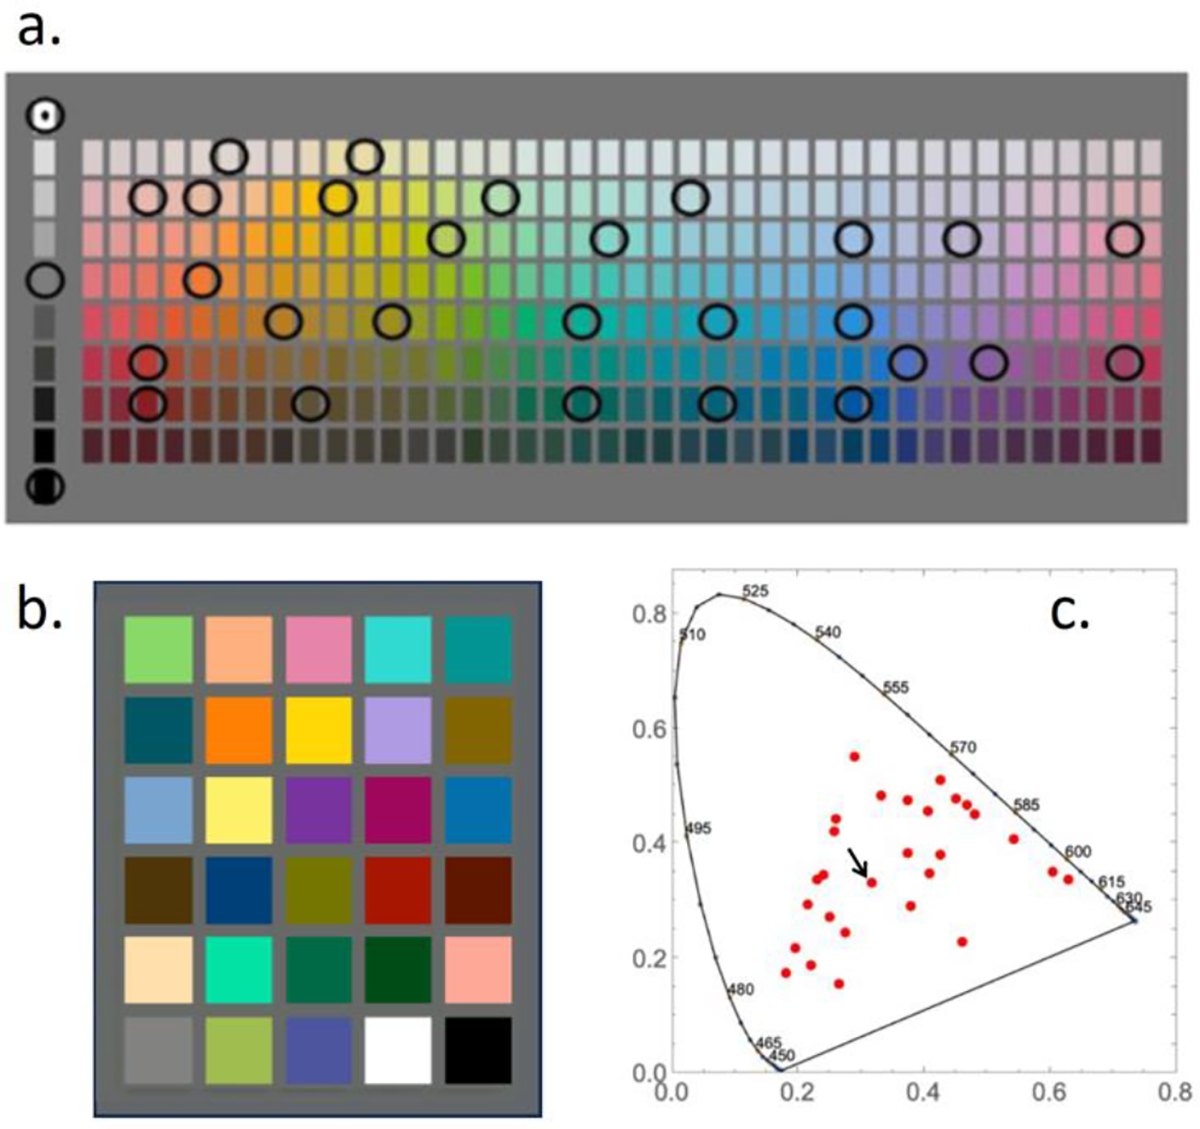
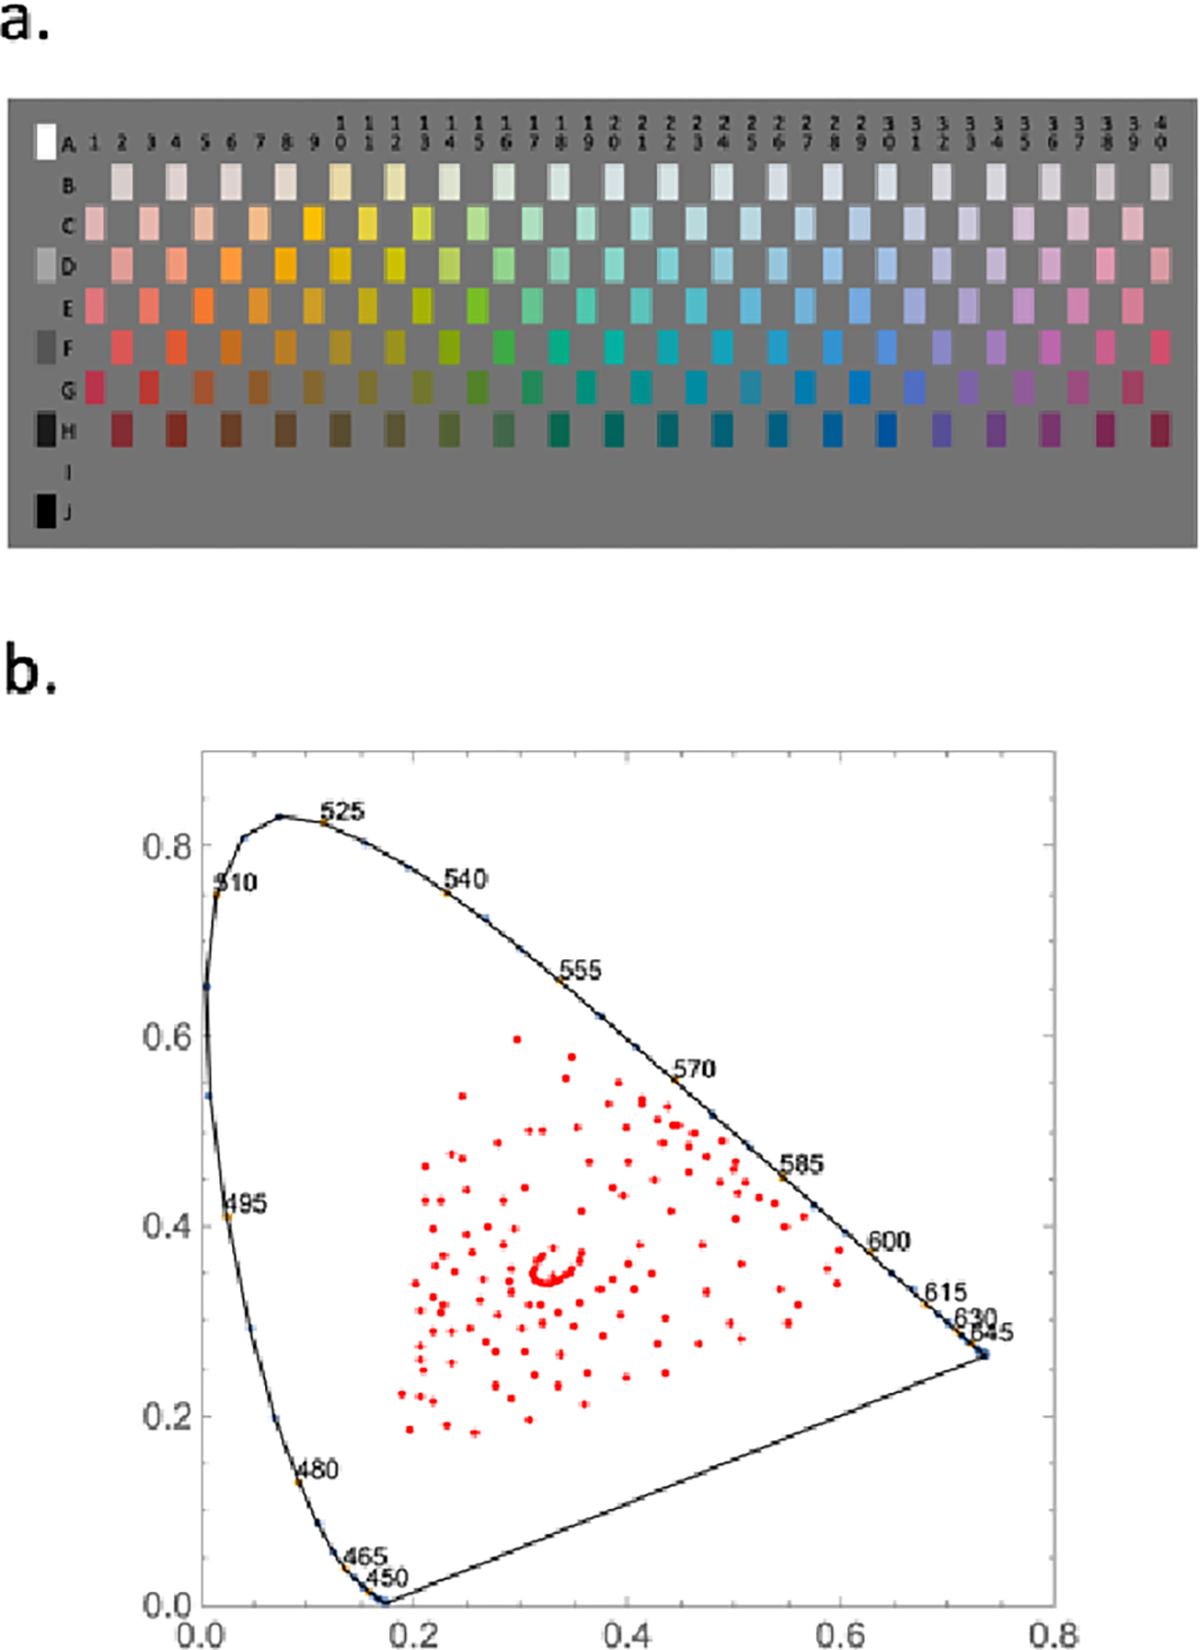
When participants sort color samples into piles, Boster showed that their color groupings can resemble the "stages" of Kay & McDaniel's model of color term evolution. Boster concluded that both the unfolding of color piles in a sequential color sorting task and the unfolding of color terms according to Kay & McDaniel's model reveal how human beings understand color. If this is correct, then: (1) pile sorts should be reasonably robust across variations in the palette of colors to be sorted, as long as the palette contains good examples of Berlin & Kay's universal color categories, and (2) pile-sorting should be more related to lexical effects and less related to perceptual processes governed by similarity judgments alone. We report three studies on English speakers and Somali speakers (Study 1 only), where participants sorted colors into 2…6 piles. The three studies used varying numbers of palette colors (25, 30, or 145 colors) and varying chromaticity schemes (mainly hue, widely-separated in hue and lightness, or densely distributed at high chroma). We compared human sorting behavior to Kay & McDaniel's model and to the "optimal" patterns of color sorting predicted by Regier's well-formedness statistic, which quantifies the perceived similarity between colors. Neither hypothesis is confirmed by the results of our studies. Thus, we propose that color sorts are determined by pragmatic influences based on heuristics that are inspired by the palette of colors that are available and the task that the viewer is asked to perform.


Conflict of interest statement

CONFLICT OF INTEREST STATEMENT The authors declared no potential conflicts of interest with respect to the research, authorship and publication of this article.

Figures

Fig A.III.1.
Fig A.III.1.
Selected individual results from Study 1. Inset idendifiers are subject numbers from that study. Top row: examples from English participants. S43: approximate hierarchy of Kay & McDaniel (1978). S42: light-dark 2-sort. S29: alternative 2-sort. S13: some n-sorts of some English-speaking subjects were not easily interpretable. Bottom row of examples are from Somali participants. S19: warm/cool 2-sort. S9: light/dark 2-sort. S5: alternative 2-sort parallels that of English S29 example above. S6: some Somali n-sorts were not easily interpretable.
Fig. A.III.2.
Fig. A.III.2.
Selected individual data from Study 2, with the individuals as columns and n-sort levels as rows. Like the group results, the individual results are not obviously linked to the predictions of Kay & McDaniel (1978). These data show cyan emerging early (S16, S21), yellow emerging late (S21, S56), brown emerging instead of yellow and occurring without green (S18), and purely lightness-based, achromatic 2-sorts (S82, S18, S56, S85) that persisted until 5-sort (S56) or throughout all five sort levels (S85). Note that S24’s n-sorts switched between chromatic and achromatic patterns.
Fig. A.III.3.
Fig. A.III.3.
Selected individual data from Study 3. Individuals (rows) often showed orderly progression (columns) similar to the sequence of Kay & McDaniel. Some individuals divided warm from cool at n=2 (S16, S2, S12, S35). By n=4, they had divided warm into red and either brown or yellow and cool into blue and green. The final division was in generally good agreement with the predictions. Other individuals started by dividing light from dark (S7 and S36). By n=4, they had defined red, yellow, and cool categories, and they had divided cool into blue and green at n=6. S14 created only a chromatic category and an achromatic category at n=2, but followed the general pattern of S7 and S36, defining warm, cool, yellow, and achromatic at n=4, and creating a data set of red, yellow, green, blue, purple, and achromatic at n=6. Note also in the sidebars of these seven individual data sets the often idiosyncratic assignments of the achromatic samples to piles in the various n-sorts.
Figure 1.
Figure 1.
Correspondence between (a) Boster’s (1986) binary sort paradigm and (b) Kay & McDaniel’s model of color term evolution. Roman numerals above the binary sort patterns in panel a are keyed to the stages in panel b. Blue arrows in panel a show how an existing pile at one sort level is partitioned into to two piles at the next sort level, as predicted by Kay & McDaniel. Color categories in panel b: W=white, R=red, Y= yellow, G=green, Bu=blue, Bk=black, Brn=brown, Pnk=pink, Pur=purple, Or=orange, Gry=gray. Thus, for example, at Stage I, the two categories are one comprised of white, red, yellow and orange and another comprised of black, green, blue, and purple.
Figure 2.
Figure 2.
Study 1 stimuli. a. Red filled circles: 25 color-sort samples plotted in CIE 1931 chromaticity space. Sample colors were chosen to conform approximately to Munsell value 5/. Coordinates for hues of 5/8 value/chroma (blue polygon) are shown for reference. Black dot: display white point. Upper right inset: the 25-sample color wheel used to depict n-sorts. Black contour, relative lightness L* of the samples, compared to white dotted line at constant lightness. b. Screen shot of iPad display partway through a 3-sort. “Bins” into which participants placed colors during sort on left; the samples in the bins are taken from the randomized 5 x 5 arrangement of the 25 samples on right. See text for additional details.
Figure 3.
Figure 3.
Results of Study 1. Results grouped (top to bottom) by sort level n: 2, 3, 4, 5 and 6. Columns: N-sort categories derived from separate cluster analyses of English and Somali data using spectral clustering techniques. Column headings: nominal identifiers given to categories of sorting patterns. At each sort level n, four or five rows of color wheels (top to bottom): English cluster results for that n, Somali cluster results, English Control sort results (Con P and Con O: results for separate control 5-sorts containing purple and orange, respectively), and Optimal solution based on well-formedness, W. Brightness of colors within English and Somali color wheels: relative number of times palette color was a member of a color group assigned to that category by cluster analysis. Control color wheels: proportion of participants’ color groups that contained that palette color. Optimal color wheels: indicates palette colors assigned to that nominal sort category by maximizing well-formedness. See text for additional details.
Figure 4.
Figure 4.
Test palette colors for Study 2. a. Color diagram of the Munsell samples used in the WCS. The left column of colors are achromatic. The main array of colors shows the Munsell values 2—9 as the rows, and the 40 Munsell hues in order. Each sample is at or near the highest chroma available for its hue and value. Black circles: the approximate locations of the Study 2 test palette colors within the WCS color sample diagram. b. Samples from Study 2. c. Chromaticity plot showing (x, y) coordinates of Study 2 test palette colors. Black arrow: display white point.
Figure 5.
Figure 5.
Comparison of empirical and Optimal n-sort clusters for 30-color palette. Column headings: nominal identifiers given to each of 12 clusters of sorting patterns. Columns “lighter” through “brown” derived from Study 2 data using spectral cluster analysis. Columns “pink” and “purple” arise from solutions for optimality. Rows: results for each sort-level (2 – 6). Upper row at each sort level: results of cluster analysis. Lower row at each sort level: color groups derived from analysis of well-formedness, W. Dashed vertical lines: horizontal locations of centroids of corresponding English basic color categories: red, yellow, green, blue, brown, pink, and purple, plus teal (cyan), from Lindsey & Brown (2014). See main text for additional details.
Figure 6.
Figure 6.
Study 3 stimuli. a. “checkerboard” subset (filled rectangles) of 145 Munsell papers from the WCS color chart. Note, bottom row (I) of chromatic colors in WCS chart was not sampled. b. chromaticity plot showing (x,y) coordinates of Study 3 stimuli.
Figure 7.
Figure 7.
Comparison of empirical and theoretical n-sort clusters for 145-color WCS palette. Column headings: nominal identifiers given to each of 12 clusters of sorting patterns. Rows: organized as in Fig. 6. Dashed white vertical lines: as in Fig. 5. See main text for additional details.

References

    1. Berlin B, & Kay P (1969). Basic Color Terms: Their Universality and Evolution. Berkeley and Los Angeles: University of California Press.
    1. Boster J (1986). Can individuals recapitulate the evolutionary development of color lexicons? Ethnology, 25(1), 61–74.
    1. Brown AM, Isse A, & Lindsey DT (2016). The color lexicon of the Somali language. Journal of Vision, 16(5). doi:10.1167/16.5.14 - DOI - PubMed
    1. Brown AM, & Lindsey DT (2023). The color communication game. Scientific Reports, 13(1), 16006. doi:10.1038/s41598-023-42834-3 - DOI - PMC - PubMed
    1. Claidière N, Jraissati Y, & Chevallier C (2008). A colour sorting task reveals the limits of the universalist/relativist dichotomy: colour categories can be both language specific and perceptual. Journal of Cognition and Culture, 8(3–4), 211–233.

LinkOut - more resources