Exploring links between personality traits and their social and non-social environments in wild poison frogs
- PMID: 38989132
- PMCID: PMC7616156
- DOI: 10.1007/s00265-022-03202-9
Exploring links between personality traits and their social and non-social environments in wild poison frogs
Abstract
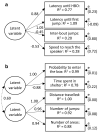
An animal's behavioral phenotype comprises several traits, which are hierarchically structured in functional units. This is manifested in measured behaviors often being correlated, partly reflecting the need of a coordinated functional response. Unfortunately, we still have limited understanding whether consistent differences in animal behaviors are due to underlying physiological constraints or a result of plastic adaptation to their current environment. Therefore, characterizing the spatial distribution of behaviors can provide important insights into causes and consequences of behavioral variation. In the present study, we quantified behaviors in a wild, free-ranging population of the Neotropical frog Allobates femoralis. We investigated how these behaviors were linked to the frogs' natural and social environment and quantified the extent to which these behaviors consistently differed among individuals (i.e., animal personality). We assessed levels of aggressiveness, exploration, and boldness by measuring several underlying behaviors expressed in a set of experimental assays, and found evidence for consistent among-individual differences along these axes. Contrary to our expectation, there was no relationship between individual behaviors and their natural environment, but we found a plastic response of males to changes in female density, which might reflect how individuals cope with their socio-ecological environment.
Significance statement: How are behavioral phenotypes distributed across space? Here, we studied an entire free-ranging population of poison frogs, and investigated if the personality traits aggressiveness, exploration, and boldness are linked to the frogs' natural or social environment. We found that behavioral traits were non-randomly distributed across the population, suggesting that the spatial arrangement of behavioral traits reflects how individuals cope with their complex natural and social environment.
Keywords: Animal personality; Behavioral variation; Environment; Non-random distribution; Poison frogs.
Conflict of interest statement
Competing interests The authors declare no competing interests.
Figures


Similar articles
-
The link between animal personality and habitat selection in males of the Neotropical poison frog Allobates femoralis.Behaviour. 2023 Jan 18;160:257-274. doi: 10.1163/1568539X-bja10202. Behaviour. 2023. PMID: 38989055 Free PMC article.
-
Behavioural consistency across metamorphosis in a neotropical poison frog.Evol Ecol. 2023 Oct 13;38:157-174. doi: 10.1007/s10682-023-10274-0. Evol Ecol. 2023. PMID: 38989472 Free PMC article.
-
Water-borne testosterone levels predict exploratory tendency in male poison frogs.Gen Comp Endocrinol. 2024 Jan 15;346:114416. doi: 10.1016/j.ygcen.2023.114416. Epub 2023 Nov 22. Gen Comp Endocrinol. 2024. PMID: 38000762
-
Sociability as a personality trait in animals: methods, causes and consequences.Biol Rev Camb Philos Soc. 2022 Apr;97(2):802-816. doi: 10.1111/brv.12823. Epub 2021 Dec 10. Biol Rev Camb Philos Soc. 2022. PMID: 34894041 Review.
-
Personality, foraging behavior and specialization: integrating behavioral and food web ecology at the individual level.Oecologia. 2016 Sep;182(1):55-69. doi: 10.1007/s00442-016-3648-8. Epub 2016 May 11. Oecologia. 2016. PMID: 27170290 Review.
Cited by
-
Regardless of personality, males show similar levels of plasticity in territory defense in a Neotropical poison frog.Sci Rep. 2023 Mar 1;13(1):3435. doi: 10.1038/s41598-023-30546-7. Sci Rep. 2023. PMID: 36859425 Free PMC article.
-
To eat or to care? Factors shaping parental or infanticidal behaviours in male poison frogs during territory takeover.Front Zool. 2025 Jul 2;22(1):12. doi: 10.1186/s12983-025-00567-1. Front Zool. 2025. PMID: 40605052 Free PMC article.
-
Odor cues rather than personality affect tadpole deposition in a neotropical poison frog.Curr Zool. 2024 Jul 18;70(3):332-342. doi: 10.1093/cz/zoad042/7274628. Epub 2023 Sep 15. Curr Zool. 2024. PMID: 39027420 Free PMC article.
-
Odor cues rather than personality affect tadpole deposition in a neotropical poison frog.Curr Zool. 2023 Sep 15;70(3):332-342. doi: 10.1093/cz/zoad042. eCollection 2024 Jun. Curr Zool. 2023. PMID: 39035761
-
The link between animal personality and habitat selection in males of the Neotropical poison frog Allobates femoralis.Behaviour. 2023 Jan 18;160:257-274. doi: 10.1163/1568539X-bja10202. Behaviour. 2023. PMID: 38989055 Free PMC article.
References
-
- AmphibiaWeb. AmphibiaWeb: information on amphibian biology and conservation. 2022
-
- Archard GA, Braithwaite VA. The importance of wild populations in studies of animal temperament. J Zool. 2010;281:149–160. doi: 10.1111/j.1469-7998.2010.00714.x. - DOI
Grants and funding
LinkOut - more resources
Full Text Sources
