. 2024 Aug;33(8):e5027.
doi: 10.1002/pro.5027.

MAGPIE: An interactive tool for visualizing and analyzing protein-ligand interactions

Affiliations

MAGPIE: An interactive tool for visualizing and analyzing protein-ligand interactions

Daniel C Pineda Rodriguez et al. Protein Sci. 2024 Aug.

Abstract

Quantitative tools to compile and analyze biomolecular interactions among chemically diverse binding partners would improve therapeutic design and aid in studying molecular evolution. Here we present Mapping Areas of Genetic Parsimony In Epitopes (MAGPIE), a publicly available software package for simultaneously visualizing and analyzing thousands of interactions between a single protein or small molecule ligand (the "target") and all of its protein binding partners ("binders"). MAGPIE generates an interactive three-dimensional visualization from a set of protein complex structures that share the target ligand, as well as sequence logo-style amino acid frequency graphs that show all the amino acids from the set of protein binders that interact with user-defined target ligand positions or chemical groups. MAGPIE highlights all the salt bridge and hydrogen bond interactions made by the target in the visualization and as separate amino acid frequency graphs. Finally, MAGPIE collates the most common target-binder interactions as a list of "hotspots," which can be used to analyze trends or guide the de novo design of protein binders. As an example of the utility of the program, we used MAGPIE to probe how different antibody fragments bind a viral antigen; how a common metabolite binds diverse protein partners; and how two ligands bind orthologs of a well-conserved glycolytic enzyme for a detailed understanding of evolutionarily conserved interactions involved in its activation and inhibition. MAGPIE is implemented in Python 3 and freely available at https://github.com/glasgowlab/MAGPIE, along with sample datasets, usage examples, and helper scripts to prepare input structures.

Keywords: biomolecular interactions; computational drug design; protein‐small molecule binding; protein–ligand interactions; protein–protein interactions.


Figures

FIGURE 1
FIGURE 1
MAGPIE framework. (a) The user compiles a set of protein complex structural models that share a target ligand, which can be a small molecule or a protein. The helper script MAPIE_input_prep.py cleans and processes the models. (b) The user can align the models on the target ligand using the helper scripts. The small molecule alignment script sorts the models into different conformer pools. (c) MAGPIE produces an interactive graph of protein binder interactions with amino acids (AAs) and heavy atoms (HAs) on the target ligand, which can be toggled to show hydrogen bond and salt bridge interactions, as well as distance‐defined hotspots colored by AA biochemical characteristics. MAGPIE also generates AA frequency graphs showing binder interactions with user‐defined target AAs or HAs.
FIGURE 2
FIGURE 2
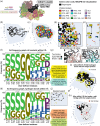
Protein–protein interactions: SARS‐CoV‐2 spike receptor‐binding domain binds a variety of antibody fragments. (a) Structural representation of the SARS‐CoV‐2 spike receptor‐binding domain (RBD, black) bound to 15 anti‐RBD binders (colors), from a set of 63 binders. (b) MAGPIE representation of the protein target main chain with two loops labeled as an epitope of interest. (c–e) MAGPIE representations of the RBD‐binder complexes showing all AAs from the binders within 8 Å of the RBD epitope. The RBD Cα are shown as black circles and the anti‐RBD binder Cα are shown as colored circles using the Amino color code as shown. The binder AAs are distinguishable in 3D space as the user zooms in. (f) AA frequency graph quantifying all neighboring AA for several RBD positions in both loops, as shown in the 3D visualization. The number of interactions and the RBD positions are listed in the x‐axis. (g) Structural models of two antibodies rendered in PyMOL (Schrödinger, Inc.) that bind the epitope of interest. Loop 1 interacts with serines and glycines in the antibodies in both examples, while larger hydrophobic residues are enriched in Loop 2. (h) AA frequency graph showing hydrogen bond partners for every position specified in the epitope. (i) 3D MAGPIE visualization of H bond partners within 8 Å of the RBD epitope. (j) Zoomed in Loop 2 H bond partners. (k) The 3D visualization can also highlight AAs in the binders that make salt bridges with the target ligand.
FIGURE 3
FIGURE 3
Binding hotspots and interface energies. (a) Default settings in MAGPIE's hotspot finding feature revealed that binder AAs neighboring two loops in the RBD organize into (b) five hotspot clusters. (c) MAGPIE finds PyRosetta‐calculated interface energies for protein binder AAs in protein–protein interactions and recolors the visualization to highlight energetically favorable and unfavorable interactions. The helper script MAGPIE_protein_relax.py allows for preparation of input structures for visualization of interface energies with MAGPIE.
FIGURE 4
FIGURE 4
Protein‐small molecule interactions: coenzyme A binds diverse proteins. (a) A subset of 199 complexes were randomly chosen from 608 CoA‐protein complexes in the PDB and sorted into 31 conformer pools. (b) Examples of conformer structures shown as sticks. (c) CoA conformer 1 shown as a ball‐and‐stick model in the MAGPIE 3D visualization. Conformer Pool 1 included 22 structures. (d–f) Binder AAs within 5 Å of CoA in Conformer Pool 1: (d) all interaction partners colored by the Amino code; (e) H bond partners, yellow; (f, g) hotspots. (h) AA frequency graph showing nearest neighbors for CoA Conformer 1 atoms labeled in (c).
FIGURE 5
FIGURE 5
MAGPIE input structure preparation pipeline for case study 3. (a) MAGPIE input structures were prepared and filtered using a structural bioinformatics and modeling pipeline. Phylum distribution at various filtering steps is shown in the pie charts. (b) Distribution of RMSD and TM‐score calculated by US‐align for PEP and ADP. (c) Rosetta‐calculated ligand energies for PEP‐ and ADP‐bound bacterial PFK‐1 models used for a final filtering step of MAGPIE input structures. Structures with a positive ligand energy were excluded.
FIGURE 6
FIGURE 6
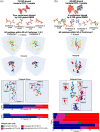
MAGPIE analysis of ligand‐protein binding interactions of the allosteric effectors of PFK‐1. (a) Feeding 72 PEP‐bound bacterial PFK‐1 models into MAGPIE resulted in four PEP conformer pools with similar hydrogen bonding partners and hotspots enriched in AAs with different biochemical characteristics. (b) 65 ADP‐bound bacterial PFK‐1 structures were separated into four conformer pools. Hydrogen bonding partners and hotspots are shown for the dominant conformer.

References

    1. Adasme MF, Linnemann KL, Bolz SN, Kaiser F, Salentin S, Haupt VJ, et al. PLIP 2021: expanding the scope of the protein–ligand interaction profiler to DNA and RNA. Nucleic Acids Res. 2021;49:W530–W534. - PMC - PubMed
    1. Alford RF, Leaver‐Fay A, Jeliazkov JR, O'Meara MJ, DiMaio FP, Park H, et al. The Rosetta all‐atom energy function for macromolecular modeling and design. J Chem Theory Comput. 2017;13:3031–3048. - PMC - PubMed
    1. Ashkenazy H, Abadi S, Martz E, Chay O, Mayrose I, Pupko T, et al. ConSurf 2016: an improved methodology to estimate and visualize evolutionary conservation in macromolecules. Nucleic Acids Res. 2016;44:W344–W350. - PMC - PubMed
    1. Bentley JL. Multidimensional binary search trees used for associative searching. Commun ACM. 1975;18:509–517.
    1. Brown BP, Mendenhall J, Meiler J. BCL::MolAlign: three‐dimensional small molecule alignment for pharmacophore mapping. J Chem Inf Model. 2019;59:689–701. - PMC - PubMed

LinkOut - more resources