. 2024 Oct;44(10):e243-e261.
doi: 10.1161/ATVBAHA.124.321085. Epub 2024 Jul 11.

Synergy Between NK Cells and Monocytes in Potentiating Cardiovascular Disease Risk in Severe COVID-19

Affiliations

Synergy Between NK Cells and Monocytes in Potentiating Cardiovascular Disease Risk in Severe COVID-19

Manuja Gunasena et al. Arterioscler Thromb Vasc Biol. 2024 Oct.

Abstract

Background: Evidence suggests that COVID-19 predisposes to cardiovascular diseases (CVDs). While monocytes/macrophages play a central role in the immunopathogenesis of atherosclerosis, less is known about their immunopathogenic mechanisms that lead to CVDs during COVID-19. Natural killer (NK) cells, which play an intermediary role during pathologies like atherosclerosis, are dysregulated during COVID-19. Here, we sought to investigate altered immune cells and their associations with CVD risk during severe COVID-19.

Methods: We measured plasma biomarkers of CVDs and determined phenotypes of circulating immune subsets using spectral flow cytometry. We compared these between patients with severe COVID-19 (severe, n=31), those who recovered from severe COVID-19 (recovered, n=29), and SARS-CoV-2-uninfected controls (controls, n=17). In vivo observations were supported using in vitro assays to highlight possible mechanistic links between dysregulated immune subsets and biomarkers during and after COVID-19. We performed multidimensional analyses of published single-cell transcriptome data of monocytes and NK cells during severe COVID-19 to substantiate in vivo findings.

Results: During severe COVID-19, we observed alterations in cardiometabolic biomarkers including oxidized-low-density lipoprotein, which showed decreased levels in severe and recovered groups. Severe patients exhibited dysregulated monocyte subsets, including increased frequencies of proinflammatory intermediate monocytes (also observed in the recovered) and decreased nonclassical monocytes. All identified NK-cell subsets in the severe COVID-19 group displayed increased expression of activation and tissue-resident markers, such as CD69 (cluster of differentiation 69). We observed significant correlations between altered immune subsets and plasma oxidized-low-density lipoprotein levels. In vitro assays revealed increased uptake of oxidized-low-density lipoprotein into monocyte-derived macrophages in the presence of NK cells activated by plasma of patients with severe COVID-19. Transcriptome analyses confirmed enriched proinflammatory responses and lipid dysregulation associated with epigenetic modifications in monocytes and NK cells during severe COVID-19.

Conclusions: Our study provides new insights into the involvement of monocytes and NK cells in the increased CVD risk observed during and after COVID-19.

Keywords: SARS-CoV-2; atherosclerosis; cardiovascular diseases; killer cells, natural; monocytes.


Conflict of interest statement

None.

Figures
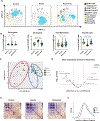
Figure 1:
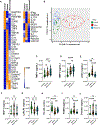
Figure 1:. Multiparametric flow cytometry analyses on fresh whole blood after red blood cell lysis characterizing immune cells subsets in Control (n = 17), Severe (n = 31), and Recovered (n = 29) individuals.
(A) Representative examples of the whole blood immunologic “atlas” of a control, a severe patient, and a recovered individual. T-distributed stochastic neighbor embedding (t-SNE) analysis of cell subsets gated on total viable CD45+CD3 CD19 cells. (B) Violin plots for each immune cell subset for control, severe and recovered individuals. Frequencies are represented within viable CD45+ cells. (C) Principal Component Analysis (PCA) for control, severe and recovered individuals. PCA was applied to control, severe and recovered groups to features identified via flowcytometry and plasma biomarker assays to identify immune signature changes. (D) Volcano plot of differentially expressed markers and subsets identified between the control, severe and recovered control groups. The blue dots denote upregulated marker expression, the red dots denote down-regulated marker expression in recovered group, and the black dots denote the marker expression without marked differences. (E) Correlogram generated using all flowcytometric and plasma biomarker data to visualize overall changes. (F) Density plot for Pearson correlation coefficients between control, severe and recovered individuals. *p < 0.05, **p < 0.01, ***p < 0.001 and ****p < 0.0001.
Figure 2:
Figure 2:. Elevated levels of cardiometabolic biomarkers during SARS CoV-2 infection.
(A) Heat map displaying relative concentrations of selected plasma biomarkers between the three groups. (B) Principal Component Analysis (PCA) for plasma biomarker data visualizing control, severe and Recovered individuals. Violin plots of (C) TIMP-1 (D)TIMP-2 (E) sCD14 (F) MCP-1 (G) LpPLA2 (H) Ox-LDL (I) FABP4 (J) D-Dimer biomarkers determined in control, severe and Recovered individuals *p < 0.05, **p < 0.01, ***p < 0.001 and ****p < 0.0001.
Figure 3:
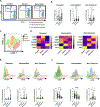
Figure 3:. Monocyte subset immune dysregulation associated with COVID-19 infection.
(A) Representative flowcytometry pseudocolor plots depicting gating strategy and subclassification of monocyte subsets stratified according to CD14 and CD16 expression. (B) Proportion of classical, non-classical and intermediate monocytes subsets within viable CD45+ cells. (C) tSNE figures are visualizing clustering of monocytes in the three cohorts. (D) Heatmaps generated using all flowcytometric data for monocytes to visualize relative receptor expression between the groups. Histograms and violin plots depicting (E) CXCR5 and (F) CD69 expression in monocyte subsets, between Control, Severe and Recovered individuals. Differences between groups were calculated using one way ANOVA followed by Dunn’s multiple comparison test for pairwise comparisons. *p < 0.05, **p < 0.01, ***p < 0.001 and ****p < 0.0001.
Figure 4:
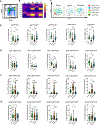
Figure 4:. Changes in phenotypic and functional characteristics among NK cell subsets between control, severe and recovered Individuals from COVID-19.
(A) Pseudocolor plot representing five NK cell subsets (B) Heatmap overview of relative receptor expression in five NK cell subsets. (C) Representative plots of a control, a severe patient and a recovered individual tSNE analysis of cell subsets gated on total NK cells. Box plots showing proportion of (D) NK cell subset frequency differences within viable CD45+ cells (E) CD27 (F) CD69 (G) HLADR expression differences in five NK cell subsets out of parent NK frequency. Differences between groups were calculated using one way ANOVA followed by Dunn’s multiple comparison test for pairwise comparisons. *p < 0.05, **p < 0.01, ***p < 0.001 and ****p < 0.0001.
Figure 5:
Figure 5:. Activated NK and monocyte subset correlations with plasma Ox-LDL levels.
Heatmap of Pearson correlation coefficients between (A) NK cell subsets and plasma Ox-LDL. Colors ranging from blue to red depict the strength of the correlation, with asterisks indicating the P values. Pearson correlation coefficient for severe group between plasma Ox-LDL and (B) CD69+ Total NK cell subsets, (C) CD69+ CD56 CD16dim NK cells (D) HLADR+ CD56dim CD16 NK cells (E) non-classical monocytes (F) classical monocytes (G) intermediate monocytes. Black dots indicate deceased patients. *p < 0.05.
Figure 6:
Figure 6:. Identification of differentially expressed genes (DEGs) & Gene ontology (GO) pathway analysis for their biological functions in NK cells and Monocytes for severe disease condition.
Heatmap of differentially expressed genes of (A) Monocytes and (B) NK cells in severe patients. GO Pathway analysis bar plots for (C) Monocytes and (D) NK cells. GO Pathway network analysis for (E) Monocytes and (F) NK cells visualized using Cytoscape software.
Figure 7:
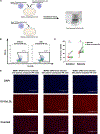
Figure 7:. Impact of NK cells in Ox-LDL uptake by Monocyte derived macrophages in vitro.
(A) Graphical representation of invitro experiment to observe the uptake of Dil dye-tagged Ox-LDL by macrophages both in the presence and absence of activated NK cells by autologous plasma. (B) Representative pseudocolor plots depicting uptake differences of Ox-LDL between the two conditions with and without activated NK cells. (C) percentage of cells with positive uptake for Dil-Ox-LDL (n=6). (D) Fluorescence microscope images of cells taken up Dil-Ox-LDL(Red) at 20x magnification. DAPI stain(blue) was used to visualize viable cells. Differences between two groups were calculated using Wilcoxon signed ranked test. *p < 0.05, **p < 0.01.

Comment in

References

    1. Kunutsor SK, Laukkanen JA. Cardiovascular complications in covid-19: A systematic review and meta-analysis. J Infect. 2020;81:e139–e141 - PMC - PubMed
    1. Vilaplana-Carnerero C, Giner-Soriano M, Dominguez A, Morros R, Pericas C, Alamo-Junquera D, Toledo D, Gallego C, Redondo A, Grau M. Atherosclerosis, cardiovascular disease, and covid-19: A narrative review. Biomedicines. 2023;11 - PMC - PubMed
    1. Makarova YA, Ryabkova VA, Salukhov VV, Sagun BV, Korovin AE, Churilov LP. Atherosclerosis, cardiovascular disorders and covid-19: Comorbid pathogenesis. Diagnostics (Basel). 2023;13. - PMC - PubMed
    1. Chaves SS, Nealon J, Burkart KG, Modin D, Biering-Sorensen T, Ortiz JR, Vilchis-Tella VM, Wallace LE, Roth G, Mahe C, et al. Global, regional and national estimates of influenza-attributable ischemic heart disease mortality. EClinicalMedicine. 2023;55:101740. - PMC - PubMed
    1. Kapellos TS, Bonaguro L, Gemund I, Reusch N, Saglam A, Hinkley ER, Schultze JL. Human monocyte subsets and phenotypes in major chronic inflammatory diseases. Front Immunol. 2019;10:2035. - PMC - PubMed

Publication types

MeSH terms