. 2024 Sep;44(9):2118-2135.
doi: 10.1161/ATVBAHA.124.321000. Epub 2024 Jul 11.

Macrophage Migration Inhibitory Factor Promotes Thromboinflammation and Predicts Fast Progression of Aortic Stenosis

Affiliations

Macrophage Migration Inhibitory Factor Promotes Thromboinflammation and Predicts Fast Progression of Aortic Stenosis

Karin Anne Lydia Mueller et al. Arterioscler Thromb Vasc Biol. 2024 Sep.

Abstract

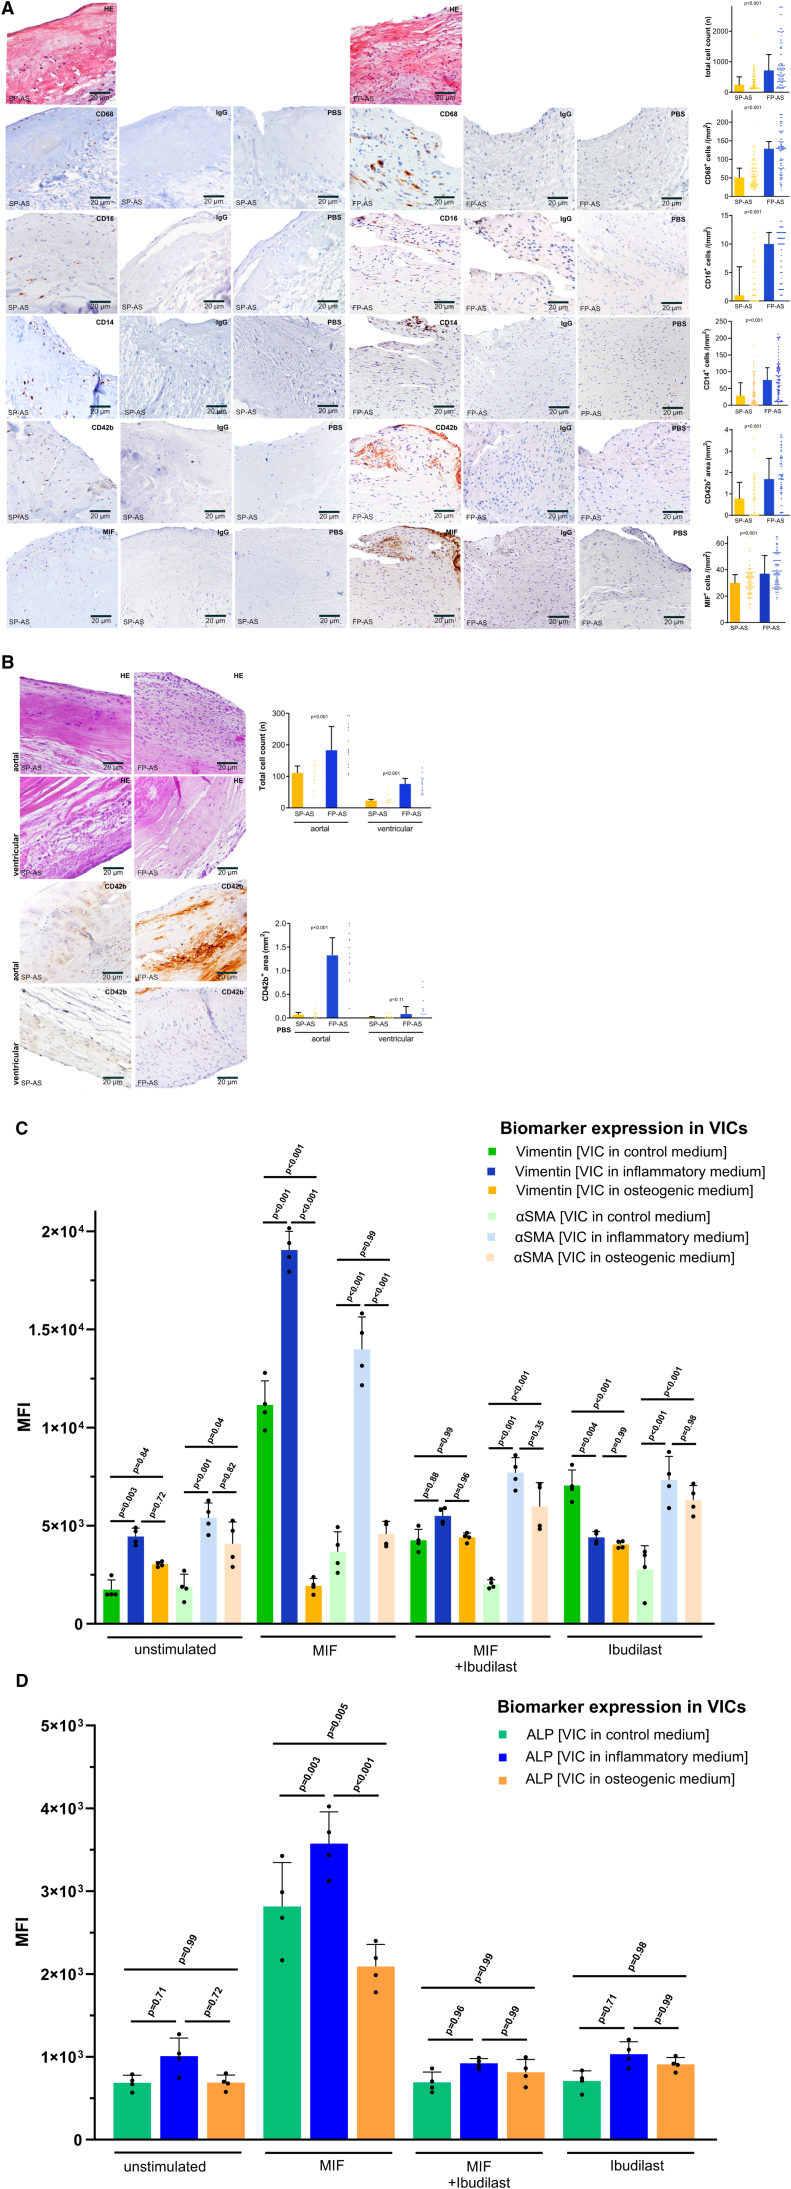
Background: Aortic stenosis (AS) is driven by progressive inflammatory and fibrocalcific processes regulated by circulating inflammatory and valve resident endothelial and interstitial cells. The impact of platelets, platelet-derived mediators, and platelet-monocyte interactions on the acceleration of local valvular inflammation and mineralization is presently unknown.

Methods: We prospectively enrolled 475 consecutive patients with severe symptomatic AS undergoing aortic valve replacement. Clinical workup included repetitive echocardiography, analysis of platelets, monocytes, chemokine profiling, aortic valve tissue samples for immunohistochemistry, and gene expression analysis.

Results: The patients were classified as fast-progressive AS by the median ∆Vmax of 0.45 m/s per year determined by echocardiography. Immunohistological aortic valve analysis revealed enhanced cellularity in fast-progressive AS (slow- versus fast-progressive AS; median [interquartile range], 247 [142.3-504] versus 717.5 [360.5-1234]; P<0.001) with less calcification (calcification area, mm2: 33.74 [27.82-41.86] versus 20.54 [13.52-33.41]; P<0.001). MIF (macrophage migration inhibitory factor)-associated gene expression was significantly enhanced in fast-progressive AS accompanied by significantly elevated MIF plasma levels (mean±SEM; 6877±379.1 versus 9959±749.1; P<0.001), increased platelet activation, and decreased intracellular MIF expression indicating enhanced MIF release upon platelet activation (CD62P, %: median [interquartile range], 16.8 [11.58-23.8] versus 20.55 [12.48-32.28], P=0.005; MIF, %: 4.85 [1.48-9.75] versus 2.3 [0.78-5.9], P<0.001). Regression analysis confirmed that MIF-associated biomarkers are strongly associated with an accelerated course of AS.

Conclusions: Our findings suggest a key role for platelet-derived MIF and its interplay with circulating and valve resident monocytes/macrophages in local and systemic thromboinflammation during accelerated AS. MIF-based biomarkers predict an accelerated course of AS and represent a novel pharmacological target to attenuate progression of AS.

Keywords: aortic valve stenosis; biomarkers; blood platelets; chemokines; inflammation.


Conflict of interest statement

None.

Figures

Figure 1.
Figure 1.
Study design and histological characteristics of valvular phenotypes in slow-progressive aortic stenosis (SP-AS) and fast-progressive aortic stenosis (FP-AS). A, Study flowchart. B, Morphological analysis of patients with either SP-AS (n=22) or FP-AS (n=23) in gross pathology regarding the degree of mineralization and calcification. C, Spearman correlation analysis of SP-AS (n=238) and FP-AS (n=237). D, Representative histological stainings of SP-AS (n=110) and FP-AS (n=108) showing calcification area (mm2) and collagen area (mm2). E, Oil red O–positive area (%, mm2) in SP-AS (n=32) and FP-AS (n=32), respectively. Plotted: median±interquartile range; statistics: Mann-Whitney U test. HE indicates hematoxylin and eosin.
Figure 2.
Figure 2.
Fast-progressive aortic stenosis (FP-AS) and slow-progressive aortic stenosis (SP-AS) show typical valvular expression patterns of valve infiltrating inflammatory cells, platelets, and macrophage MIF (macrophage migration inhibitory factor). A, Representative immunohistological stainings of SP-AS (n=110) and FP-AS (n=108) to calculate the total aortic valve cell count (n), CD68+ macrophages, CD16+ monocytes, CD14+ monocytes, CD42b+ platelets, and MIF+ staining in matching areas of consecutive aortic valve (AV) tissue sections. Plotted: median±interquartile range (IQR); statistics: Mann-Whitney U test. B, Representative immunohistological stainings comparing aortal and ventricular aortic valve side in SP-AS (n=11) and FP-AS (n=14) to analyze the cell count (n) and CD42b+ positive areas in the aortal and the ventricular side of the AV. Plotted: median±IQR; statistics: Kruskal-Wallis test. C, In vitro analysis of cell culture of valvular interstitial cells (VICs) in control, proinflammatory, and pro-osteogenic medium. Vimentin and αSMA expression on VICs in control, proinflammatory, and pro-osteogenic medium without stimulation, under stimulation with MIF, coincubation with MIF and its antagonist ibudilast, and under inhibition by ibudilast. Plotted: mean±SD, n=4; statistics: 1-way ANOVA. Tukey multiple comparison test (P<0.05) was used to correct for multiple comparisons. D, ALP (alkaline phosphatase) expression on VICs in control, proinflammatory, and pro-osteogenic medium without stimulation, understimulation with MIF, coincubation with MIF and its antagonist ibudilast, and under inhibition by ibudilast. Proinflammatory and pro-osteogenic medium mimic an inflammatory (FP-AS) or calcifying (SP-AS) valvular and systemic phenotype as described before. Plotted: mean±SD, n=4; statistics: 1-way ANOVA. Tukey multiple comparison test (P<0.05) was used to correct for multiple comparisons. HE indicates hematoxylin and eosin.
Figure 3.
Figure 3.
MIF (macrophage migration inhibitory factor)-associated gene and protein expression in fast-progressive aortic stenosis (FP-AS). A, Hierarchical clustering analysis of the top 50 differentially expressed genes of NanoString mRNA profiling including MIF and TGF-β1 (transforming growth factor-β1), Z scores of means indicating upregulation in FP-AS (blue, n=8) or slow-progressive aortic stenosis (SP-AS; orange, n=7). Scatter plot (B) and volcano plot (C) displaying significant (P<0.05) alterations in SP-AS (n=7) and FP-AS (n=8). D, Heatmap with row-wise comparisons of Nanostring data in patients with FP-AS (blue) and SP-AS (orange). Z scores of MIF (purple) and TGF-β1–associated pathways (yellow) according to PathCards online database. E, The top 10 significantly enriched Kyoto Encyclopedia of Genes and Genomes pathways subsuming the 25 significantly regulated genes in FP-AS were plotted. F, A term-gene-graph highlights subnetworks and regulations of significantly regulated genes and the referring pathway in FP-AS displaying MIF interactions with significantly (P<0.01) enriched Gene Ontology (GO) pathways. G, Representative immunohistological stainings of SP-AS (n=110) and FP-AS (n=108) show MIF+ and TGF-β1+ cells. Plotted: median±interquartile range (IQR); statistics: Mann-Whitney U test. H, Analysis of aortal and ventricular aortic valve side in SP-AS (n=11) and FP-AS (n=14). Plotted: median±IQR; statistics: Kruskal-Wallis test. I, Spearman correlation analysis of SP-AS and FP-AS (n=218). FC indicates fold change; and Th, T helper.
Figure 4.
Figure 4.
Immunophenotyping and high-dimensional analysis of platelets in fast-progressive aortic stenosis (FP-AS). A, Plasmatic inflammatory cytokines/chemokines in slow-progressive aortic stenosis (SP-AS; n=98) and FP-AS (n=95). B, Platelets in flow cytometry of SP-AS (n=142) and FP-AS (n=150) showing platelet count, median CD41/CD31, and frequency of CD62P+/MIF+. C, Platelet subpopulations determined by PhenoGraph algorithm for unsupervised clustering of patient samples (n=270). Left plot represents an overlay of platelets from SP-AS and FP-AS followed by individual plots of platelets from SP-AS and FP-AS of all clusters. The lower row shows only significantly different clusters. D, Clustered heatmap of significant different clusters P35, P38, P24, P03, and P06 from C shows median expression of indicated markers of SP-AS compared with FP-AS. Abundancy of cells in each cluster for each patient is shown as box plots stratified into SP-AS and FP-AS. Plots were generated using the OMIQ data analysis software. MIF indicates macrophage migration inhibitory factor; and umap, uniform manifold approximation and projection.
Figure 5.
Figure 5.
Expression of MIF (macrophage migration inhibitory factor) in monocyte subsets in fast-progressive aortic stenosis (FP-AS) and slow-progressive aortic stenosis (SP-AS). A, Flow cytometry of monocytes of SP-AS (n=142) and FP-AS (n=150) to analyze monocyte subsets. B, Intracellular MIF expression (median) by monocyte subsets. C, Spearman correlation analysis of SP-AS and FP-AS. D, Monocyte subpopulation analyzed by PhenoGraph algorithm for unsupervised clustering of patient samples (n=260). Left plot shows overlay of monocytes from SP-AS and FP-AS followed by individual plots of monocytes from SP-AS and FP-AS of all clusters. Lower plots represent only significant different clusters. E, Clustered heatmap of significant different clusters from D shows median expression of indicated markers for comparison of SP-AS and FP-AS. Abundancy of cells in each cluster for each patient is shown as box plots stratified into SP-AS and FP-AS. Plots were generated using the OMIQ data analysis software. CCR7 indicates C-C chemokine receptor type 7; CXCL, chemokine (C-X-C motif) ligand; CXCR, C-X-C chemokine receptor; HLA-DR, human leukocyte antigen-DR isotype; max, maximum; min, minimum; umap, uniform manifold approximation and projection; and WBC, white blood cell.
Figure 6.
Figure 6.
Plasmatic and platelet-MIF (macrophage migration inhibitory factor) correlate with valvular phenotype in fast-progressive aortic stenosis (FP-AS). A, Correlation matrix by corrplot R package displays correlations of clinical parameters alongside ex vivo assays. Significant (P<0.05) correlations of clinical baseline parameters and important in vitro, ex vivo, and clinical data including flow cytometry, immunohistochemistry, and immunoassay in patients with fast- and slow-progressive aortic stenosis (SP-AS) are illustrated. B, Spearman correlation analysis of SP-AS (n=238) and FP-AS (n=237) to evaluate associations with valvular phenotypes characteristic for either SP-AS or FP-AS. C, Synopsis of important findings in this study is displayed by chord diagram using R package circlize. Significant (P<0.05) changes of clinical parameters and ex vivo data, as well as differentially expressed gene pathways between patients with fast-progressive aortic stenosis (FP-AS; purple) and slow-progressive aortic stenosis (SP-AS; yellow) are illustrated and colored according to the performed assays as indicated in the figure caption. Thus, patients with FP-AS showed a significantly altered risk profile (orange), as well as MIF and TGF (transforming growth factor) expression levels using Nanostring analyses (red), ELISA (purple), immunohistochemical analyses (blue), and flow cytometry (black) analyses.

References

    1. Pawade TA, Newby DE, Dweck MR. Calcification in aortic stenosis: the skeleton key. J Am Coll Cardiol. 2015;66:561–577. doi: 10.1016/j.jacc.2015.05.066 - PubMed
    1. Surendran A, Edel A, Chandran M, Bogaert P, Hassan-Tash P, Kumar Asokan A, Hiebert B, Solati Z, Sandhawalia S, Raabe M, et al. . Metabolomic signature of human aortic valve stenosis. JACC Basic Transl Sci. 2020;5:1163–1177. doi: 10.1016/j.jacbts.2020.10.001 - PMC - PubMed
    1. Chan KL, Teo K, Dumesnil JG, Ni A, Tam J; ASTRONOMER Investigators. Effect of lipid lowering with rosuvastatin on progression of aortic stenosis: results of the aortic stenosis progression observation: measuring effects of rosuvastatin (astronomer) trial. Circulation. 2010;121:306–314. doi: 10.1161/CIRCULATIONAHA.109.900027 - PubMed
    1. Yilmaz MB, Guray U, Guray Y, Cihan G, Caldir V, Cay S, Kisacik HL, Korkmaz S. Lipid profile of patients with aortic stenosis might be predictive of rate of progression. Am Heart J. 2004;147:915–918. doi: 10.1016/j.ahj.2003.11.011 - PubMed
    1. Mateos N, Gomez M, Homar A, Garcia-Elias A, Yáñez L, Tajes M, Molina L, Ble M, Cladellas M, Roqueta C, et al. . Plasmatic pcsk9 levels are associated with very fast progression of asymptomatic degenerative aortic stenosis. J Cardiovasc Transl Res. 2022;15:5–14. doi: 10.1007/s12265-021-10138-4 - PubMed

Publication types

MeSH terms

Substances