. 2025 Jan;80(1):161-180.
doi: 10.1111/all.16220. Epub 2024 Jul 11.

Allergen-specific B cell responses in oral immunotherapy-induced desensitization, remission, and natural outgrowth in cow's milk allergy

Affiliations

Allergen-specific B cell responses in oral immunotherapy-induced desensitization, remission, and natural outgrowth in cow's milk allergy

Pattraporn Satitsuksanoa et al. Allergy. 2025 Jan.

Abstract

Background: Antigen-specific memory B cells play a key role in the induction of desensitization and remission to food allergens in oral immunotherapy and in the development of natural tolerance (NT). Here, we characterized milk allergen Bos d 9-specific B cells in oral allergen-specific immunotherapy (OIT) and in children spontaneously outgrowing cow's milk allergy (CMA) due to NT.

Methods: Samples from children with CMA who received oral OIT (before, during, and after), children who naturally outgrew CMA (NT), and healthy individuals were received from Stanford biobank. Bos d 9-specific B cells were isolated by flow cytometry and RNA-sequencing was performed. Protein profile of Bos d 9-specific B cells was analyzed by proximity extension assay.

Results: Increased frequencies of circulating milk allergen Bos d 9-specific B cells were observed after OIT and NT. Milk-desensitized subjects showed the partial acquisition of phenotypic features of remission, suggesting that desensitization is an earlier stage of remission. Within these most significantly expressed genes, IL10RA and TGFB3 were highly expressed in desensitized OIT patients. In both the remission and desensitized groups, B cell activation-, Breg cells-, BCR-signaling-, and differentiation-related genes were upregulated. In NT, pathways associated with innate immunity characteristics, development of marginal zone B cells, and a more established suppressor function of B cells prevail that may play a role in long-term tolerance. The analyses of immunoglobulin heavy chain genes in specific B cells demonstrated that IgG2 in desensitization, IgG1, IgA1, IgA2, IgG4, and IgD in remission, and IgD in NT were predominating. Secreted proteins from allergen-specific B cells revealed higher levels of regulatory cytokines, IL-10, and TGF-β after OIT and NT.

Conclusion: Allergen-specific B cells are essential elements in regulating food allergy towards remission in OIT-received and naturally resolved individuals.

Keywords: Bos d 9 (Bos taurus domestic 9 or αS1‐casein); RNA sequencing; allergen‐specific B cells; cow's milk allergy; natural tolerance; oral immunotherapy (OIT).


Conflict of interest statement

C.A.A reports research grants from Allergopharma, Idorsia, GlaxoSmithKline, Novartis Research Institutes, AstraZeneca, Swiss National Science Foundation, Christine Kühne‐Center for Allergy Research and Education, grant from European Commission Horizon 2020 Framework Programme, Cure, advisory role in Sanofi/Regeneron, and SciBase, Sweden. M.S. reports research grants from the Swiss National Science Foundation (No. 310030_189334/1), GSK and Novartis and a speaker's fee from AstraZeneca. S.D.B. has consulted for Regeneron, Sanofi, Genent and Novartis on topics unrelated to this study, owns stock in Ab Cellera Biologics, has received grant support from the U.S. National Institutes of Health and the Bill and Melinda Gates Foundation, and has an endowment from the Crown Family Foundation. M.A has received research grants from the Swiss National Science Foundation (310,030_201,053/1), European Union (EU CURE, EU Syn‐Air‐G), is the Co‐Chair for EAACI Scientific Program; is on the Advisory Boards of Stanford University Sean Parker Asthma Allergy Center (CA, USA), LEO Foundation Skin Immunology Research Center Copenhagen, Denmark. W.V. has consulted for Mabylon AG on topics unrelated to this study and has received grant support from the Promedica foundation, Novartis Freenovation and the EoE foundation.

Figures
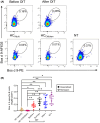
FIGURE 1
FIGURE 1
The frequency of Bos d 9‐specific B cells increased after OIT in allergic patients and natural tolerance compared to healthy individuals. (A) Representative flow cytometry plots of data obtained from the 4 groups: before OIT, after OIT, HC, and NT. (B) Frequencies of Bos d 9‐specific B cells analyzed by one‐way ANOVA, *p < .05, **p < .01; ***p < .001, ****p < .0001; values (means ± SEM), bold dots represent “desensitized” and empty dots represent “remission” (n Healthy control(HCAdult) = 9, (n HCChildren = 12) n before OIT = 9, n during OIT = 9, n after OIT = 13, n natural tolerance (NT) = 9).
FIGURE 2
FIGURE 2
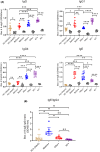
Specificity of Bos d 9‐specific immunoglobulin detection in allergic patients undergoing OIT versus natural tolerance and healthy controls. (A) Detection of Bos d 9‐specific immunoglobulins in undiluted supernatants of Bos d 9‐specific and non‐specific immortalized B cells (500,000 cells/well) at Day 3; sIgG, sIgG1, sIgG4, sIgE. Positive (+) and negative ( −) in each group refers to Bos d 9‐specific and non‐specific immortalized B cell fraction from each donor in the different groups, respectively. (B) Bos d 9‐specific sIgE/sIgG4 ratios. Statistical comparisons were performed by one‐way ANOVA, *p < .05, **p < .01, ***p < .001, ****p < .0001; values are given as means ± SEM, bold dots represent “desensitized” and empty dots represent “remission” (n HCAdult = 9, n before OIT = 9, n after OIT = 13, n natural tolerance (NT) = 9).
FIGURE 3
FIGURE 3
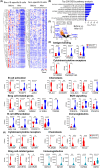
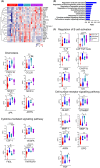
DEGs signatures in Bos d 9‐specific and non‐specific B cells before and after OIT (desensitized & remission). (A) Heatmap of the top 200 most DEGs in Bos d 9‐specific and non‐specific B cells from before and after OIT, n before OIT = 7, n after OIT (desensitized) = 4, n after OIT (remission) = 5 (B) Top 200 DEGs B cell‐related pathways analysis (C) Volcano plot shows differentially expressed genes with top 20 significant genes (p < .05) between before vs after OIT. Violin plots of differentially expressed genes in eight different gene groups; antigen‐binding, cytokines/cytokine receptors, B cell activation, chemotaxis, Breg cell‐related genes, BCR signaling, B cell differentiation, and immunoglobulins; (D) before OIT versus desensitized and (E) before OIT versus remission, *p < .05, **p < .01, ***p < .001, ****p < .0001.
FIGURE 4
FIGURE 4
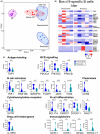
DEGs signatures in Bos d 9‐specific B cells from after OIT (desensitized vs remission). (A) PCA plot of 200 DEGs separating allergic groups: before OIT versus after OIT (desensitized and remission) versus NT groups. (B) Heatmap of the most significant DEGs of Bos d 9‐specific B cells after OIT; desensitized versus remission, n before OIT = 6 and n NT = 6 (C) Violin plots of differentially expressed genes in eight different gene groups; antigen‐binding, BCR signaling, B cell activation, chemotaxis, cytokines/cytokine receptors, B cell differentiation, Breg cell‐related genes, and immunoglobulins, *p < .05, **p < .01, ***p < .001, ****p < .0001.
FIGURE 5
FIGURE 5
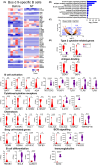
DEGs signatures in Bos d 9‐specific B cells from before OIT versus NT. (A) Heatmap showing top significant DEGs of Bos d 9‐specific B cells from before OIT and NT, n before OIT = 6 and n NT = 6. (B) Top 200 DEGs B cell‐related pathways analysis (C) Volcano plot shows differentially expressed genes (p < .05). (D) Violin plots of differentially expressed genes in nine different gene groups: Type 2 cytokine‐related genes, antigen‐binding, B cell activation, cytokines/cytokine receptors, chemotaxis, Breg cell‐related genes, BCR signaling, B cell differentiation, and immunoglobulins, *p < .05, **p < .01, ***p < .001, ****p < .0001.
FIGURE 6
FIGURE 6
DEGs signatures in Bos d 9‐specific B cells from after OIT (remission) versus NT. (A) Heatmap of the top significant DEGs of Bos d 9‐specific B cells from after OIT (remission) vs NT, n after OIT (remission) = 5, n NT OIT = 6, (B) Top B cell‐related pathways analysis (C) Volcano plot shows differentially expressed genes with top 20 significant genes (p < .05). (D) Venn‐diagram of differentially expressed genes from remission vs NT groups (p < .05). Violin plots of differentially expressed genes in seven different gene groups; B cell activation, antigen‐binding, cytokines/cytokine receptors, Breg cell‐related genes, B cell differentiation, BCR signaling, and immunoglobulins; (E) remission versus NT, *p < .05, **p < .01, ***p < .001, ****p < .0001.
FIGURE 7
FIGURE 7
Protein expression in Bos d 9‐specific B cell cultures from before OIT, after OIT (desensitized & remission), and NT using proximity extension assay (OLINK). (A) Heatmap depicts significant differentially secreted proteins from Bos d 9‐specific B cell supernatants before OIT vs desensitized vs remission versus NT measured by proximity extension assay. (B) Ratio of 23 significant proteins, for different GO Biological processes, to all proteins in the OLINK inflammation panel. (C) Violin plots of differentially secreted proteins: IL10, TGF‐β, TNFRSF9, AXIN, uPA, STAMBP, OPG, MMP‐1, IL7, FlT3L, CASP‐8, 4E‐BP1, ADA, CXCL10, CCL20, VEGF‐A, MCP‐1, MCP‐4, TNF, MMP‐10, ARTN, CSF‐1, and IL6, *p < .05, **p < .01, ***p < .001, ****p < .0001.

References

    1. Gupta RS, Warren CM, Smith BM, et al. The public health impact of parent‐reported childhood food allergies in the United States. Pediatrics. 2018;142(6):e20181235. doi:10.1542/peds.2018-1235 - DOI - PMC - PubMed
    1. Sicherer SH, Sampson HA. Food allergy: a review and update on epidemiology, pathogenesis, diagnosis, prevention, and management. J Allergy Clin Immunol. 2018;141(1):41‐58. doi:10.1016/j.jaci.2017.11.003 - DOI - PubMed
    1. Flom JD, Sicherer SH. Epidemiology of cow's milk allergy. Nutrients. 2019;11(5):1051. doi:10.3390/nu11051051 - DOI - PMC - PubMed
    1. Lifschitz C, Szajewska H. Cow's milk allergy: evidence‐based diagnosis and management for the practitioner. Eur J Pediatr. 2015;174(2):141‐150. doi:10.1007/s00431-014-2422-3 - DOI - PMC - PubMed
    1. Nurmatov U, Dhami S, Arasi S, et al. Allergen immunotherapy for IgE‐mediated food allergy: a systematic review and meta‐analysis. Allergy. 2017;72(8):1133‐1147. doi:10.1111/all.13124 - DOI - PubMed