. 2024 Jul 11:13:RP92426.
doi: 10.7554/eLife.92426.

Human DDX6 regulates translation and decay of inefficiently translated mRNAs

Affiliations

Human DDX6 regulates translation and decay of inefficiently translated mRNAs

Ramona Weber et al. Elife. .

Abstract

Recent findings indicate that the translation elongation rate influences mRNA stability. One of the factors that has been implicated in this link between mRNA decay and translation speed is the yeast DEAD-box helicase Dhh1p. Here, we demonstrated that the human ortholog of Dhh1p, DDX6, triggers the deadenylation-dependent decay of inefficiently translated mRNAs in human cells. DDX6 interacts with the ribosome through the Phe-Asp-Phe (FDF) motif in its RecA2 domain. Furthermore, RecA2-mediated interactions and ATPase activity are both required for DDX6 to destabilize inefficiently translated mRNAs. Using ribosome profiling and RNA sequencing, we identified two classes of endogenous mRNAs that are regulated in a DDX6-dependent manner. The identified targets are either translationally regulated or regulated at the steady-state-level and either exhibit signatures of poor overall translation or of locally reduced ribosome translocation rates. Transferring the identified sequence stretches into a reporter mRNA caused translation- and DDX6-dependent degradation of the reporter mRNA. In summary, these results identify DDX6 as a crucial regulator of mRNA translation and decay triggered by slow ribosome movement and provide insights into the mechanism by which DDX6 destabilizes inefficiently translated mRNAs.

Keywords: CCR4-NOT complex; DDX6; biochemistry; chemical biology; chromosomes; codon optimization; gene expression; human; mRNA decay; ribosome stalling.


Conflict of interest statement

RW, CC No competing interests declared

Figures

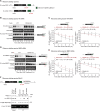
Figure 1.
Figure 1.. DDX6 functions as a sensor of rare codon-triggered mRNA decay in human cells.
(A) Schematic representation of the reporters used in panels (B, D). (B) Wild-type (WT) and DDX6 KO HEK293T cells were transfected with indicated reporter plasmids. After 48 hr, cells were treated with actinomycin D (ActD) and harvested at the indicated time points. Reporter mRNA levels were analyzed by northern blotting. 18 S rRNA ethidium bromide staining shows equal loading. (C) Relative reporter mRNA levels from panel B at time point zero (before ActD addition) were defined as 100%. Relative reporter mRNA levels were plotted as a function of time. Circles represent the mean value and error bars the standard deviation (SD) (n=3). The decay curves were fitted to an exponential decay with a single component (dotted lines). R2 values are indicated for each curve. The half-life of each mRNA in WT and DDX6 KO cells is represented as the mean ± SD. (D) HEK293T cells were transfected with MBP or POP2 dominant negative mutant (POP2 DE-AA) and indicated reporter plasmids. After 48 hr, cells were treated with ActD and harvested at the indicated time points. Reporter mRNA levels were analyzed by northern blotting. 18 S rRNA ethidium bromide staining shows equal loading. (E) Relative reporter mRNA levels from panel D at time point zero (before ActD addition) were defined as 100%. Relative reporter mRNA levels were plotted as a function of time. Circles represent the mean value and error bars the SD (n=3). The decay curves were fitted to an exponential decay with a single component (dotted lines). R2 values are indicated for each curve. The half-life of each reporter mRNA in WT and POP2 DE-AA overexpressing cells is represented as the mean ± SD.
Figure 1—figure supplement 1.
Figure 1—figure supplement 1.. Characterization of HEK293T DDX6 KO cells.
(A) Immunoblots were probed with antibodies recognizing DDX6 and Tubulin. (B) Sanger sequencing of the DDX6 genomic region targeted by the DDX6 sgRNA. Frameshift mutations were detected in exon 3 of both alleles. These generate premature STOP codons (PTC) and deletions in DDX6. (C) Northern blot analysis of CNOT3 tethered to an R-LUC reporter mRNA in HEK293T WT or DDX6 KO cells. Indicated cells were transfected with a mixture of three plasmids: 1. expressing the Renilla luciferase (R-LUC) containing 5BoxB reporter, 2. expressing the Firefly luciferase (F-LUC) as a transfection control, and 3. expressing the λN-HA peptide (−) or λN-HA-CNOT3 (+).
Figure 2.
Figure 2.. DDX6 interacts with ribosomal proteins in human cells.
(A) The interaction between the recombinant NusA-Strep-DDX6 and purified human ribosomal proteins was analyzed by SDS-PAGE and stained with Coomassie blue. Input lysate (1%) and bound fractions (20%) were loaded. (B) Western blot showing the interaction between GFP-tagged DDX6 full-length/N-ter/C-ter with HA-tagged RPL22 and endogenous RPS3A in human HEK293T cells. GFP-tagged MBP served as a negative control. For the GFP-tagged proteins, the HA-tagged RPL22, and the endogenous RPS3A, 1% of the input and 20% of the immunoprecipitate were loaded. N-ter: N-terminus; C-ter: C-terminus. (C) Immunoprecipitation assay showing the interaction of GFP-tagged DDX6 (wild-type or the indicated mutants) with HA-tagged RPL22 or endogenous CNOT1 in HEK293T cells. Samples were analyzed as described in B. (D) DDX6 KO HEK293T cells were transfected with the control Renilla luciferase (R-LUC) reporter or a reporter containing 30 x rare codons and GFP-tagged DDX6 wild-type or mutants. After treating cells with ActD for 8 hr R-LUC mRNA levels were analyzed by northern blotting. 18 S rRNA ethidium bromide staining shows equal loading. (E) Relative control reporter mRNA levels from panel D were defined as 100%. Relative 30 x rare codon reporter mRNA levels were plotted. Bars represent the mean value and error bars the standard deviation (n=3). (F) Immunoblot illustrating the expression of proteins used in the assay shown in panel D.
Figure 2—figure supplement 1.
Figure 2—figure supplement 1.. Multidimensional scaling analysis of Ribo-Seq and RNA-Seq and the ribosome footprints on mRNA read distribution in DDX6 KO Cells.
(A, B) Multidimensional scaling (MDS) analysis for the Ribo-Seq (A) and RNA-Seq (B) replicate libraries from HEK293T wild-type (WT) and DDX6 KO cells. The Ribo-Seq and RNA-Seq experiments were reproducible as replicates clustered together. (C) Ribosome footprints (RFP) and total mRNA (RNA) reads distribution along DDX6 mRNA in wild-type (WT) and DDX6 KO cells. Of note, RFP and total RNA counts for DDX6 are drastically reduced in the knockout KO cells.
Figure 3.
Figure 3.. DDX6 controls mRNA abundance and translational efficiency in human cells.
(A) Comparative analysis of translational efficiency (TE) in wild-type (WT) HEK293T and DDX6 KO cells. Genes with significantly (FDR <0.005) increased (n=1707 genes) and decreased (n=1484 genes) mRNA abundance are colored in red and blue, respectively. (B) Comparative analysis of TE in WT HEK293T and DDX6 KO cells. Genes with significantly (FDR <0.005) increased (n=260 genes) and decreased (n=38 genes) TE are highlighted in salmon and cyan, respectively. The top 20 (total 89) of translationally upregulated zinc finger transcription factors in DDX6 KO cells are highlighted. (C) Pie charts indicating the fractions and absolute numbers of significantly (FDR <0.005) differentially expressed mRNAs in HEK293T WT and DDX6 KO cells as determined by RNA-seq. (D) Pie charts indicating the fractions and absolute numbers of significantly (FDR <0.005) differentially translated mRNAs in HEK293T WT and DDX6 KO cells as determined by Ribo-seq/RNA-seq. (E) Gene ontology of the biological processes associated with upregulated transcripts in DDX6 KO cells. Bar graph shows log10 q-values for each overrepresented category. Values and circles indicate the % of genes within each category. (F) Gene ontology of the biological processes associated with translationally upregulated transcripts in DDX6 KO cells. Bar graph shows log10 q-values for each overrepresented category. Values and circles indicate the % of genes within each category. (G) Ridgeline plots of predicted mRNA stability (Diez et al., 2022) of translationally upregulated unchanged/downregulated transcripts in DDX6 KO cells. Statistical significance was calculated with the one-sided Wilcoxon rank sum test. (H) qPCR analysis of AR and BMP2 mRNA levels in HEK293T WT and DDX6 KO and rescued with GFP-tagged DDX6 (wild-type or the indicated mutants). log2FC values for each transcript as determined by the RNA-seq experiments are indicated. (I) Immunoblot depicting the expression of proteins used in the assay shown in panel G.
Figure 3—figure supplement 1.
Figure 3—figure supplement 1.. Characterization of DDX6 target mRNAs.
(A–C) Ridgeline plots illustrating the GC content (A), coding sequence (CDS) length (B), and translational efficiency (TE) (C) of translationally regulated DDX6 target mRNAs. Statistical significance was calculated with the one-sided Wilcoxon rank sum test.
Figure 3—figure supplement 2.
Figure 3—figure supplement 2.. Identification of DDX6 target mRNAs.
(A) Schematic representation of the experimental strategy to identify mRNAs targeted by DDX6 for translational repression and decay. (B–G) Ribosome footprints (RFP) and total mRNA (RNA) reads distribution along DDX6 target mRNAs in wild-type (WT) and DDX6 KO cells. Potential ribosome stalling sites are indicated in red dotted boxes.
Figure 3—figure supplement 3.
Figure 3—figure supplement 3.. Validation of DDX6 target mRNAs.
(A) qPCR analysis of LGALS1, DLX5, ENO2, and PSMB9 mRNA levels in HEK293T wild-type (WT) and DDX6 KO and rescued with GFP-tagged DDX6 (wild-type or the indicated mutants). log2FC values for each transcript as determined by the RNA-seq experiments are indicated.
Figure 4.
Figure 4.. DDX6 is required for ribosome-stalling mRNA degradation.
(A) Schematic representation of the reporters used in panels (B, C). (B) Representative northern blots showing the decay of androgen receptor (AR) reporter mRNAs in HEK293T wild-type (WT) or DDX6 KO cells. Cells were transfected with indicated reporter plasmids and monitored after the inhibition of transcription using actinomycin D (ActD) for the indicated time. 18 S rRNA ethidium bromide staining shows equal loading. (C) Relative reporter mRNA levels from panel B at time point zero (before ActD addition) were defined as 100%. Relative reporter mRNA levels were plotted as a function of time. Circles represent the mean value and error bars the standard deviation (SD) (n=3). The decay curves were fitted to an exponential decay with a single component (dotted lines). R2 values are indicated for each curve. The half-life of each mRNA in WT and DDX6 KO cells is represented as the mean ± SD. (D) Representative northern blots showing the decay of BMP2 reporter mRNAs in HEK293T WT or DDX6 KO cells. Cells were transfected with indicated reporter plasmids and monitored after the inhibition of transcription using ActD for the indicated time. 18 S rRNA ethidium bromide staining shows equal loading. (E) Relative reporter mRNA levels from panel D at time point zero (before ActD addition) were defined as 100%. Relative reporter mRNA levels were plotted as a function of time. Circles represent the mean value and error bars the standard deviation (SD) (n=3). The decay curves were fitted to an exponential decay with a single component (dotted lines). R2 values are indicated for each curve. The half-life of each mRNA in WT and DDX6 KO cells is represented as the mean ± SD. (F) HEK293T cells were transfected with indicated R-LUC reporters containing 6xMS2 binding sites, HA-tagged RPL22, and SBP-tagged MBP-MS2 plasmids. RNA bound to V5-SBP-MBP-MS2 was immunoprecipitated with Streptavidin beads. The presence of HA-tagged RPL22 in the immunoprecipitates was determined by western blotting. V5-SBP-MBP-MS2 protein level and RT-PCR of R-LUC reporter RNA levels served as a loading control.

Update of

  • doi: 10.1101/2023.10.30.564346
  • doi: 10.7554/eLife.92426.1
  • doi: 10.7554/eLife.92426.2

Similar articles

Cited by

References

    1. Absmeier E, Chandrasekaran V, O’Reilly FJ, Stowell JAW, Rappsilber J, Passmore LA. Specific recognition and ubiquitination of translating ribosomes by mammalian CCR4-NOT. Nature Structural & Molecular Biology. 2023;30:1314–1322. doi: 10.1038/s41594-023-01075-8. - DOI - PMC - PubMed
    1. Aviner R, Lee TT, Masto VB, Gestaut D, Li KH, Andino R, Frydman J. Ribotoxic collisions on CAG expansions disrupt proteostasis and stress responses in huntington’s disease. bioRxiv. 2022 doi: 10.1101/2022.05.04.490528. - DOI - PubMed
    1. Bazzini AA, Del Viso F, Moreno-Mateos MA, Johnstone TG, Vejnar CE, Qin Y, Yao J, Khokha MK, Giraldez AJ. Codon identity regulates mRNA stability and translation efficiency during the maternal-to-zygotic transition. The EMBO Journal. 2016;35:2087–2103. doi: 10.15252/embj.201694699. - DOI - PMC - PubMed
    1. Belin S, Hacot S, Daudignon L, Therizols G, Pourpe S, Mertani HC, Rosa-Calatrava M, Diaz JJ. Purification of ribosomes from human cell lines. Current Protocols in Cell Biology. 2010;Chapter 3:Unit 3.40. doi: 10.1002/0471143030.cb0340s49. - DOI - PubMed
    1. Boël G, Letso R, Neely H, Price WN, Wong KH, Su M, Luff J, Valecha M, Everett JK, Acton TB, Xiao R, Montelione GT, Aalberts DP, Hunt JF. Codon influence on protein expression in E. coli correlates with mRNA levels. Nature. 2016;529:358–363. doi: 10.1038/nature16509. - DOI - PMC - PubMed

MeSH terms

Associated data