

Progressive Choriocapillaris Changes on Optical Coherence Tomography Angiography Correlate With Stage Progression in AMD
- PMID: 38990069
- PMCID: PMC11246100
- DOI: 10.1167/iovs.65.8.21
Progressive Choriocapillaris Changes on Optical Coherence Tomography Angiography Correlate With Stage Progression in AMD
Abstract
Purpose: We investigated the association between inner choroid flow deficit percentage (IC-FD%) using swept-source optical coherence tomography angiography (SS-OCTA) and progression of AMD.
Methods: Retrospective, observational study including 64 eyes (42 participants) with early or intermediate AMD at baseline. Participants had two or more consecutive swept-source optical coherence tomography angiography covering a period of at least 18 months. Demographics, visual acuity, and AMD staging based on Beckman classification were reviewed. OCT was analyzed for hyperreflective foci, subretinal drusenoid deposits, hyporeflective drusen cores, and subfoveal choroidal thickness. IC-FD% was measured within the central 3- and 6-mm using a 16-µm slab, after compensation and binarization (Phansalkar method). Mixed-effects Cox regression models assessed the association between imaging biomarkers and AMD progression.
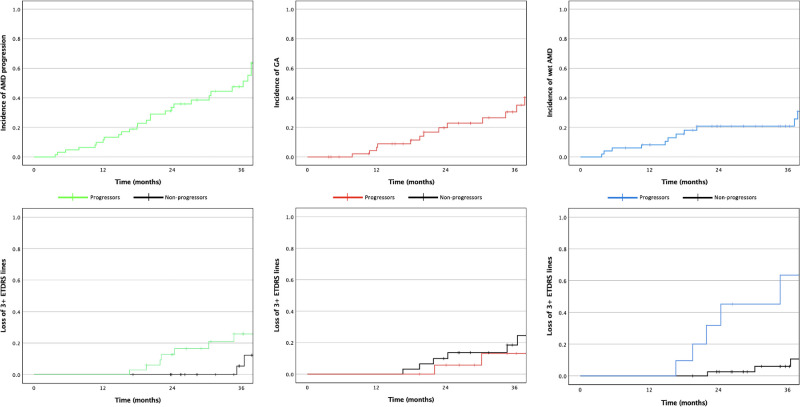
Results: During follow-up (37 ± 9 months), 4 eyes with early AMD (31%) progressed to intermediate AMD and 30 (59%) eyes with intermediate AMD developed late AMD (19 geographic atrophy; 11 wet AMD). Baseline hyporeflective drusen core was associated with geographic atrophy development (P < 0.01), whereas greater IC-FD% (3-mm) was associated with wet AMD (P = 0.03). Time-varying analysis showed that faster subfoveal choroidal thickness reduction and IC-FD% (6-mm) increase were associated with geographic atrophy onset (P < 0.05), whereas IC-FD% (3-mm) increase was associated with wet AMD (P = 0.03). Notably, greater IC-FD% increases in the 3 mm (area under the curve = 0.72) and 6 mm (area under the curve = 0.89) were better predictive of wet AMD and geographic atrophy development, respectively.
Conclusions: Our longitudinal IC-FD% assessment emphasizes the role of progressive choriocapillaris changes as a biomarker for AMD progression. Our findings support that widespread choriocapillaris alterations (6 mm) may precede progression to geographic atrophy, whereas more central choriocapillaris loss (3 mm) may provide an ischemic stimulus for wet AMD.
Conflict of interest statement
Disclosure:
Figures


Similar articles
-
Decreased Macular Choriocapillaris Perfusion Correlates with Contrast Sensitivity Function in Dry Age-Related Macular Degeneration.Ophthalmol Retina. 2024 Dec;8(12):1140-1150. doi: 10.1016/j.oret.2024.06.005. Epub 2024 Jun 13. Ophthalmol Retina. 2024. PMID: 38878897
-
Choriocapillaris impairment in dry AMD: insights from swept-source OCT angiography and associations with structural biomarkers.Br J Ophthalmol. 2025 Aug 20;109(9):1020-1027. doi: 10.1136/bjo-2024-326416. Br J Ophthalmol. 2025. PMID: 40360203
-
Associations Between Contrast Sensitivity, Optical Coherence Tomography Features and Progression From Intermediate to Late Age-related Macular Degeneration.Am J Ophthalmol. 2025 Mar;271:175-187. doi: 10.1016/j.ajo.2024.11.006. Epub 2024 Nov 25. Am J Ophthalmol. 2025. PMID: 39603315
-
Structural OCT and OCT angiography biomarkers associated with the development and progression of geographic atrophy in AMD.Graefes Arch Clin Exp Ophthalmol. 2024 Nov;262(11):3421-3436. doi: 10.1007/s00417-024-06497-8. Epub 2024 Apr 30. Graefes Arch Clin Exp Ophthalmol. 2024. PMID: 38689123 Free PMC article. Review.
-
Morphologic features of large choroidal vessel layer: age-related macular degeneration, polypoidal choroidal vasculopathy, and central serous chorioretinopathy.Graefes Arch Clin Exp Ophthalmol. 2018 Dec;256(12):2309-2317. doi: 10.1007/s00417-018-4143-1. Epub 2018 Sep 27. Graefes Arch Clin Exp Ophthalmol. 2018. PMID: 30259090 Review.
Cited by
-
Antioxidants in Age-Related Macular Degeneration: Lights and Shadows.Antioxidants (Basel). 2025 Jan 27;14(2):152. doi: 10.3390/antiox14020152. Antioxidants (Basel). 2025. PMID: 40002339 Free PMC article. Review.
-
Dicer Loss in Müller Glia Leads to a Defined Sequence of Pathological Events Beginning With Cone Dysfunction.Invest Ophthalmol Vis Sci. 2025 Mar 3;66(3):7. doi: 10.1167/iovs.66.3.7. Invest Ophthalmol Vis Sci. 2025. PMID: 40035725 Free PMC article.
-
Assessment of Choriocapillaris in Healthy and Diseased Eyes Using 3-Dimensional Topographic Maps Based on OCT Angiography.Ophthalmol Sci. 2025 May 17;5(6):100828. doi: 10.1016/j.xops.2025.100828. eCollection 2025 Nov-Dec. Ophthalmol Sci. 2025. PMID: 40778359 Free PMC article.
References
-
- Miller JW. Age-related macular degeneration revisited–piecing the puzzle: the LXIX Edward Jackson memorial lecture. Am J Ophthalmol. 2013; 155(1): 1–35.e13. - PubMed
Publication types
MeSH terms
LinkOut - more resources
Full Text Sources
