. 2024 Sep 2;156(9):e202313518.
doi: 10.1085/jgp.202313518. Epub 2024 Jul 11.

The C-terminus of Rad is required for membrane localization and L-type calcium channel regulation

Affiliations

The C-terminus of Rad is required for membrane localization and L-type calcium channel regulation

Garrett Elmore et al. J Gen Physiol. .

Abstract

L-type CaV1.2 current (ICa,L) links electrical excitation to contraction in cardiac myocytes. ICa,L is tightly regulated to control cardiac output. Rad is a Ras-related, monomeric protein that binds to L-type calcium channel β subunits (CaVβ) to promote inhibition of ICa,L. In addition to CaVβ interaction conferred by the Rad core motif, the highly conserved Rad C-terminus can direct membrane association in vitro and inhibition of ICa,L in immortalized cell lines. In this work, we test the hypothesis that in cardiomyocytes the polybasic C-terminus of Rad confers t-tubular localization, and that membrane targeting is required for Rad-dependent ICa,L regulation. We introduced a 3xFlag epitope to the N-terminus of the endogenous mouse Rrad gene to facilitate analysis of subcellular localization. Full-length 3xFlag-Rad (Flag-Rad) mice were compared with a second transgenic mouse model, in which the extended polybasic C-termini of 3xFlag-Rad was truncated at alanine 277 (Flag-RadΔCT). Ventricular cardiomyocytes were isolated for anti-Flag-Rad immunocytochemistry and ex vivo electrophysiology. Full-length Flag-Rad showed a repeating t-tubular pattern whereas Flag-RadΔCT failed to display membrane association. ICa,L in Flag-RadΔCT cardiomyocytes showed a hyperpolarized activation midpoint and an increase in maximal conductance. Additionally, current decay was faster in Flag-RadΔCT cells. Myocardial ICa,L in a Rad C-terminal deletion model phenocopies ICa,L modulated in response to β-AR stimulation. Mechanistically, the polybasic Rad C-terminus confers CaV1.2 regulation via membrane association. Interfering with Rad membrane association constitutes a specific target for boosting heart function as a treatment for heart failure with reduced ejection fraction.


Conflict of interest statement

Disclosures: The authors declare no competing interests exist.

Figures

Figure 1.
Figure 1.
Generation of Flag-Rad knock-in mice. (A) Graphical representation of the RRAD gene engineering strategy. Two transgenic mouse models were generated with CRISPR/Cas9 targeting the endogenous RRAD gene in this study. First, a 3xFlag epitope was inserted at the N-terminus of RRAD, generating 3xFlag-Rad mice. Subsequent CRISPR/Cas9 engineering of 3xFlag-Rad embryo introduced a stop codon at amino acid position 277, removing a large portion of the polybasic C-terminus of Rad important for membrane anchoring in cultured cells (Flag-RadΔCT). Created with BioRender.com. (B) Validation of stop codon knock-in showing the location of base changes (upper) and stop codon insertion in place of Ala277 (lower). (C) Western blot for Rad and Flag-Rad expression in protein lysates from wildtype (WT), Flag-Rad, and Flag-RadΔCT whole heart lysates. Note that total Rad protein levels are not significantly changed in either transgenic model. Source data are available for this figure: SourceData F1.
Figure 2.
Figure 2.
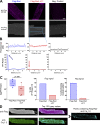
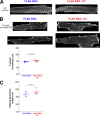
The C-terminus tail of Rad is necessary for t-tubular expression in adult murine ventricular cardiomyocytes. (A) SR SIM maximum intensity projections of fixed adult murine cardiomyocytes stained with anti-Flag to visualize Flag tagged Rad in two transgenic mice, full-length Flag-Rad, and C-terminus ablated Flag-RadΔCT. A no primary antibody control image is provided using the same acquisition and brightness and contrast settings. Scale bar, 5 μm; magnification is the same for all images. (B) Confocal micrographs of adult murine cardiomyocytes from Flag-Rad or Flag-RadΔCT. As a negative control for Flag immunofluorescence, a cardiomyocyte from a Rad knockout mouse is shown (right panel). Scale bar, 5 μm. Fluorescence intensity profiles of regions of interest from the representative images and their FFT power spectrums. (C) Fundamental peak power of anti-Flag immunostaining that represents a signal with periodicity consistent with t-tubular expression. The FFT peak power median of Flag-Rad 40.9 (IQR: 20.4-87.6; N = 6 mice, n = 41 cells, 93 images) was significantly 476% higher than Flag-RadΔCT 7.1 (IQR: 2.6-20.6; N = 6 mice, n = 41 cells, 92 images). Statistical significance was determined by a linear mixed model, nesting cells into the random factor mouse. Genotype as a main effect was significantly different (P = 0.002, F = 16.502). The estimated marginal means contrast with P value adjustment (Holm) for multiple comparisons (see Fig. 5) between the Flag-Rad and Flag-RadΔCT cells untreated was significantly different (P = 0.001). Boxes are interquartile ranges and whiskers, min to max. 76% of Flag-Rad versus 22% of Flag-RadΔCT cells had FFT power >10. Blinded researchers identified 79% of Flag cells and 7% of Flag-RadΔCT cells as having Flag-staining in an organized t-tubular pattern in at least one region of the cell. Two to four technical replicate images’ FFT power was averaged per cell. (D) A Flag-Rad cardiomyocyte was stained for anti-Flag Rad and anti-CaV1.2. The top 15% gray value intensities are highlighted in cyan in both micrographs. The last micrograph shows pixels that contain both anti-Flag and anti-CaV1.2 staining if that pixel was in the top 15% of gray values in both channels. Scale bar, 5 μm; magnification is the same for all images.
Figure S1.
Figure S1.
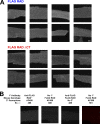
Confocal micrographs of fixed adult murine ventricular cardiomyocytes immunostained with anti-Flag antibody to detect Flag-Rad localization. (A) Cells were β-adrenergic receptor agonist treated isolated from transgenic mice with full-length Flag-Rad (N = 3 mice, n = 8 cells displayed) or Flag-RadΔCT (N = 3 mice, n = 8 cells displayed), representative of a total of 6 and 6 mice, 41 and 41 cells, and 93 and 92 images. Note that the bottom right Flag-RadΔCT image showing t-tubular expression is from the same cell in Fig. 2, representative of the observation that 7% of Flag-RadΔCT cells show t-tubular like expression in at least one region, but not regularly throughout the entire cell (0%). Scale bar, 5 µm; magnification is the same for all images. (B) Confocal microscopy controls were imaged and stained with the same protocols and with the same visualization background and contrast adjustments. For controls of the anti-Flag Rad antibody, a cardiomyocyte from a Rad knockout mouse (Rad−/−) was imaged along with a Flag-Rad cardiomyocyte incubated with no primary antibody imaged with the same settings used for anti-Flag-Rad acquisition. Additionally, a Flag-Rad cardiomyocyte was incubated with no secondary antibody (no fluorophore) and imaged. Lastly, as a control for the commercial CaV1.2 antibody (image presented in Fig. 2 C), a no primary anti-CaV1.2 antibody incubated Flag-Rad cardiomyocyte was imaged the same settings used for CaV1.2 imaging.
Figure S2.
Figure S2.
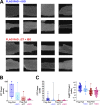
Confocal micrographs of fixed adult murine ventricular cardiomyocytes treated with 1 µM ISO for 3 min and immunostained with anti-Flag antibody to detect Flag-Rad localization. (A) Cells were isolated from the hearts of transgenic mice expressing full-length Flag-Rad (N = 6 mice, n = 8 cells displayed) or Flag-RadΔCT (N = 6 mice, n = 8 cells displayed), representative of 6 and 6 mice, 29 and 32 cells, and 64 and 62 images. Scale bar, 5 µm; magnification is the same for all images. (B) Fundamental peak power of anti-Flag immunostaining that represents a signal with periodicity consistent with t-tubular expression of both genotypes and ±ISO. In A and Fig. 5 B, the data is plotted on a linear y-axis here instead of log10. (C) The individual cell data points are shown that were averaged for the mouse data, both in linear and log10 scale. A line in both graphs at FFT Power 10 is denoted, corresponding to the proportions of cells over 10 shown in Fig. 2 C and Fig. 5 E. Note that for cells, the 75th percentile of both Flag-RadΔCT groups are below this threshold of 10 FFT Power.
Figure 3.
Figure 3.
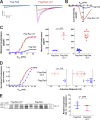
Modulated ICa,L in adult Flag-RadΔCT murine cardiomyocytes. (A) Representative family of ICa,L currents. Voltage protocol schematic above current traces. (B) Current density–voltage relationship for peak ICa,L from Flag-Rad and Flag-RadΔCT ex vivo cardiomyocytes. (C) Conductance transforms of the current–voltage curve. Smooth curves are Boltzmann distribution fitted to data. Mean maximal conductance was significantly increased 5.2-fold in Flag-RadΔCT (614.8, 95% CI 528.4, 701.2) compared with Flag-Rad (118.0, 95% CI 30.7, 205.2) (estimated marginal means). Statistical significance was determined by a linear mixed model, nesting cells into the random factor mouse. Genotype as a main effect was significantly different (P = 0.002, F = 62.856). (D) To highlight the shift in activation midpoint, the conductance–voltage curves were normalized to maximum conductance. The mean activation midpoint was significantly shifted negatively at 11.3 mV in Flag-RadΔCT (−14.2, 95% CI −17.6, −10.9) relative to Flag-Rad (−3.0, 95% CI −5.9, 0.02) (estimated marginal means). Statistical significance was determined by a linear mixed model, nesting cells into the random factor mouse. Genotype as a main effect was significantly different (P = 0.018, F = 24.419). Mice are shown to the left and cells to the right. For mice, means and SEM are plotted; for cells, medians, and IQR. For Flag-Rad (N = 3 mice, n = 13 cells); for Flag-RadΔCT (N = 3 mice, n = 14 cells). (E) Western blot for CaV1.2 expression in protein lysates from Flag-Rad and Flag-RadΔCT whole heart lysates. Median relative expression of CaV1.2 (normalized to total protein) was not significantly different (Mann–Whitney U test, P = 0.5476, U = 6). Source data are available for this figure: SourceData F3.
Figure 4.
Figure 4.
Flag-RadΔCT cardiomyocytes display faster ICa,L decay kinetics. (A) Representative ICa,L current recorded for Vhold = −80 mV stepped to Vtest = 0 mV, normalized to maximum peak current to highlight kinetic differences between Flag-Rad and Flag-RadΔCT. Black stars indicate the remaining current 30 ms after the peak current; black diamonds, 150 ms after the peak current. (B) Percent remaining current 30 ms after peak. Flag-RadΔCT had significantly less remaining current/faster decay (linear mixed model; genotype P = 0.002, F = 55.5362; voltage P = 0.058, genotype × voltage P = 0.002, F = 109.422). The remaining current was on average reduced 25% in Flag-RadΔCT (51% remaining current) relative to Flag-Rad (68%). (C) Percent remaining current 150 ms after peak across various test potentials. Flag-RadΔCT had significantly less remaining current/faster decay (linear mixed model; genotype P = 0.001, F = 80.672; voltage P < 0.001; interaction P < 0.001, F = 81.684). The remaining current was on average reduced 55% in Flag-RadΔCT (11% remaining current) relative to Flag-Rad (25%). For Flag Rad (N = 3 mice, n = 13 cells); for Flag-RadΔCT (N = 3 mice, n = 14 cells). Means of mice with SEM shown. Data points of individual cells and individual mice are in Fig. S3.
Figure S3.
Figure S3.
Flag-RadΔCT cardiomyocytes display faster ICa,L decay kinetics. (A and B) Confidence intervals of differences between genotypes at a given Vtest was calculated from cells for (A) percent remaining current 30 milliseconds after peak current and (B) current 150 ms after peak current. Individual mice and cell data points are plotted that represent the averages shown in Fig. 4, B and C.
Figure S4.
Figure S4.
T-tubule integrity in Flag-Rad and Flag-RadΔCT cardiomyocytes. (A) Representative α-actinin staining of Flag-Rad and Flag-RadΔCT cardiomyocytes. Scale bar, 10 μm; magnification is the same for both panels. (B) Live cardiomyocyte di-8-ANEPPS staining of representative cardiomyocytes. FFT analysis of t-tubule periodicity did not vary significantly between genotypes (mean spacing 1.78 [SEM = 0.008] and 1.81 [SEM = 0.012] µm, for Flag-Rad and Flag-RadΔCT, respectively) (linear mixed model, nesting cells into mice, genotype F = 3.058, P = 0.133, N = 8 mice, n = 127 cells). Scale bar, 10 μm; magnification is the same for all panels. (C) FFT analysis of resting sarcomere length from brightfield microscopy of live cells did not vary significantly between genotype (mean spacing 1.87 [SEM = 0.0385] and 1.93 [SEM = 0.0388] µm, for Flag-Rad and Flag-RadΔCT) (linear mixed model, nesting cells into mice, genotype F = 0.958, P = 0.372, N = 7 mice, n = 122 cells).
Figure 5.
Figure 5.
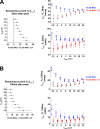
Flag-Rad adult murine cardiomyocytes treated with β-adrenergic agonists show modulated ICa,L that phenocopies untreated Flag-RadΔCT and reduced t-tubular expression. (A) Flag-Rad cardiomyocytes with 300 nM β-adrenergic receptor agonist ISO show an increase of ICa,L. Black traces (baseline). Cyan (Flag-Rad) and pink (Flag-RadΔCT) show sweeps after the addition of β-adrenergic receptor agonist. Ramp protocol (above current sweeps) repeated at 3 s inter-pulse interval. (B) Diary plot of fold change of mean peak ICa,L recorded during continuous recordings (sweeps) relative to initial peak current of sweep 1. (C) The fold change in ICa,L after application of ISO (after steady state was reached). ICa,L of Flag-Rad cardiomyocytes significantly increased 2.9-fold from a mean −2.8 (95% CI, −3.5, −2.2) to −8.2 (95% CI, −10.0, −6.4) pA/pF (linear mixed model, ISO treatment P = 0.024, F = 51.001, N = 3 mice, n = 13 cells). ICa,L of Flag-RadΔCT cardiomyocytes significantly changed 0.7-fold from mean −11.1 (95% CI, −13.1, −9.1) to −7.5 pA/pF (linear mixed model, ISO treatment P = 0.018, F = 6.491, N = 3 mice, n = 12 cells). (D) Confocal micrographs of adult cardiomyocytes treated with 1 µM β-adrenergic receptor agonist ISO from Flag-Rad or Flag-RadΔCT mice. Scale bar, 5 μm. Fluorescence intensity profiles of regions of interest from the representative images and their FFT power spectrums. (E) FFT data of untreated cardiomyocytes (data from Fig. 2) were analyzed together with ISO-treated cells to consider for both genotype and drug treatment as fixed factors with a linear mixed model (nesting cells into mice and accounting for cells untreated or treated originated from the same mouse). Data of untreated cells shown in Fig. 2 is repeated for clarity. The drug treatment main effect (P = 0.032, F = 5.147) was significant and, as reported in Fig. 2, the genotype main effect was significant (P = 0.002, F = 16.502); the interaction term was not (P = 0.255, F = 1.360). The FFT peak power median of Flag-Rad treated with β-adrenergic receptor agonist 15.4 (IQR: 5.8-42.9; N = 6 mice, n = 30 cells, 64 images) was significantly reduced 62% of untreated Flag-Rad 40.9 (IQR: 20.4–87.6) but still significantly 115 and 140% higher than untreated Flag-RadΔCT 7.1 (IQR: 2.6–20.6) and ISO-treated Flag-RadΔCT 6.4 (IQR: 4.1–9.5; N = 6 mice, 33 cells, 62 images). The P values of pairwise comparisons were corrected for multiple comparisons using Holm adjustment of estimated marginal means. 76% of Flag-Rad and 66% of Flag-Rad + ISO whereas 22 and 19% of Flag-RadΔCT ± ISO had a fundamental peak with power >10. Blinded researchers classified 79 and 60% of Flag-Rad ± ISO and 7 and 0% of Flag-RadΔCT ± ISO cells as having organized t-tubular expression in at least one region of the cell. Two to four technical replicate images’ FFT power were averaged per cell. The total sampling size was 12 mice, 143 cells, and 311 images.
Figure 6.
Figure 6.
Flag-RadΔCT hearts show elevated function under basal conditions. Heart function was evaluated by echocardiography. (A) Representative M-mode recordings from Flag-Rad (left) and Flag-RadΔCT mice (right). The upper panel shows recording prior to ISO injection and lower panel shows same mice 1–3-min after ISO injection. (B) Ejection fraction (%) for male (left) and female mice (right) was significantly different between genotypes in the basal condition and significantly different in Flag-RAD after ISO. Sex as a main effect was not statistically significant (three-way repeated measures ANOVA, F = 1.050, P = 0.3113). Repeated measures two-way ANOVA’s were performed considering repeated measures basal versus acute ISO treatment and genotype (male: treatment F = 78.13, P < 0.0001; genotype F = 0.3790, P = 0.5435; interaction F = 62.75 P < 0.0001) (female: treatment F = 134.1, P < 0.0001; genotype F = 0.2705, P = 0.6101; interaction F = 95.04, P < 0.0001). Scale bar = 200 ms.
Figure 7.
Figure 7.
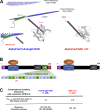
Computational modeling predicts a basic amphipathic α-helix motif in the C-terminus anchors Rad to the plasma membrane. (A) AlphaFold prediction of M. musculus Rad full-length (Uniprot accession no. O88667) was input to the PPM 3.0 web server tool for computational modeling of Rad with a mammalian membrane. The inset image focuses on the predicted embedded residues that are amino acids in the predicted helix 8 (H8) and highlights the alanine which was replaced with a stop codon in the Flag-RadΔCT mouse model. AlphaFold was then used to predict a structure for RadΔCT. Modelling RadΔCT (1–276) with PPM 3.0 predicts low probability of membrane interaction. (B) Abbreviated protein schematic of full length Rad and RadΔCT. The GTPase core is shown with its putative interaction with the L-type calcium channel CaVβ subunit. The amino acids of the predicted amphipathic α-helix basic residues are highlighted in green. Helices 7 (black) and 8 (green) correspond to the colored H7 and H8 in the Rad proteins in A. (C) Tabular results of PPM 3.0 predictions. Full-length Rad ΔGtransfer was increased 160% relative to RadΔCT. The RadΔCT ΔGtransfer of −2.8 kcal/mol is relatively low, suggesting a low probability for hydrophobic surfaces involved in protein–membrane interactions. The predicted residues (152 and 154) for RadΔCT reside in the GTPase core that is known to interact with CaVβ.

References

    1. Ahern, B.M., Levitan B.M., Veeranki S., Shah M., Ali N., Sebastian A., Su W., Gong M.C., Li J., Stelzer J.E., et al. . 2019. Myocardial-restricted ablation of the GTPase RAD results in a pro-adaptive heart response in mice. J. Biol. Chem. 294:10913–10927. 10.1074/jbc.RA119.008782 - DOI - PMC - PubMed
    1. Ahern, B.M., Sebastian A., Levitan B.M., Goh J., Andres D.A., and Satin J.. 2021. L-type channel inactivation balances the increased peak calcium current due to absence of Rad in cardiomyocytes. J. Gen. Physiol. 153:e202012854. 10.1085/jgp.202012854 - DOI - PMC - PubMed
    1. Béguin, P., Nagashima K., Gonoi T., Shibasaki T., Takahashi K., Kashima Y., Ozaki N., Geering K., Iwanaga T., and Seino S.. 2001. Regulation of Ca2+ channel expression at the cell surface by the small G-protein kir/Gem. Nature. 411:701–706. 10.1038/35079621 - DOI - PubMed
    1. Béguin, P., Mahalakshmi R.N., Nagashima K., Cher D.H., Takahashi A., Yamada Y., Seino Y., and Hunziker W.. 2005. 14-3-3 and calmodulin control subcellular distribution of Kir/Gem and its regulation of cell shape and calcium channel activity. J. Cell Sci. 118:1923–1934. 10.1242/jcs.02321 - DOI - PubMed
    1. Béguin, P., Mahalakshmi R.N., Nagashima K., Cher D.H., Ikeda H., Yamada Y., Seino Y., and Hunziker W.. 2006. Nuclear sequestration of beta-subunits by Rad and Rem is controlled by 14-3-3 and calmodulin and reveals a novel mechanism for Ca2+ channel regulation. J. Mol. Biol. 355:34–46. 10.1016/j.jmb.2005.10.013 - DOI - PubMed