. 2024 Jul;12(7):e1339.
doi: 10.1002/iid3.1339.

Integrative gene expression analysis and animal model reveal immune- and autophagy-related biomarkers in osteomyelitis

Affiliations

Integrative gene expression analysis and animal model reveal immune- and autophagy-related biomarkers in osteomyelitis

Xiangwen Shi et al. Immun Inflamm Dis. 2024 Jul.

Abstract

Background: Osteomyelitis (OM) is recognized as a significant challenge in orthopedics due to its complex immune and inflammatory responses. The prognosis heavily depends on timely diagnosis, accurate classification, and assessment of severity. Thus, the identification of diagnostic and classification-related genes from an immunological standpoint is crucial for the early detection and tailored treatment of OM.

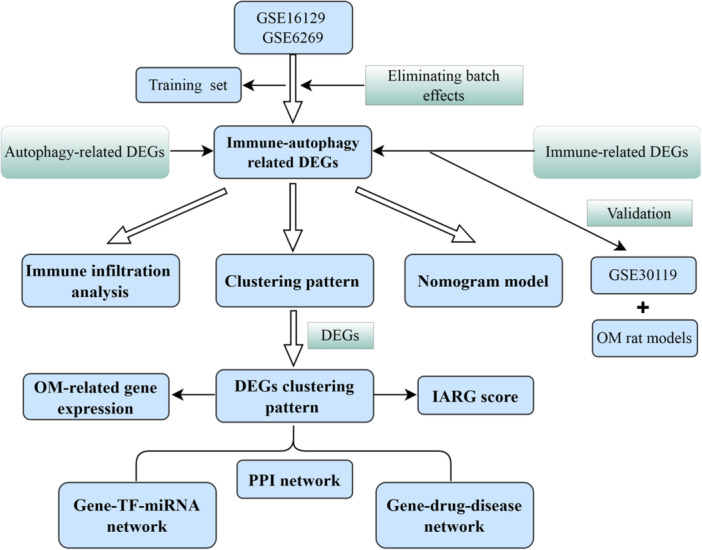
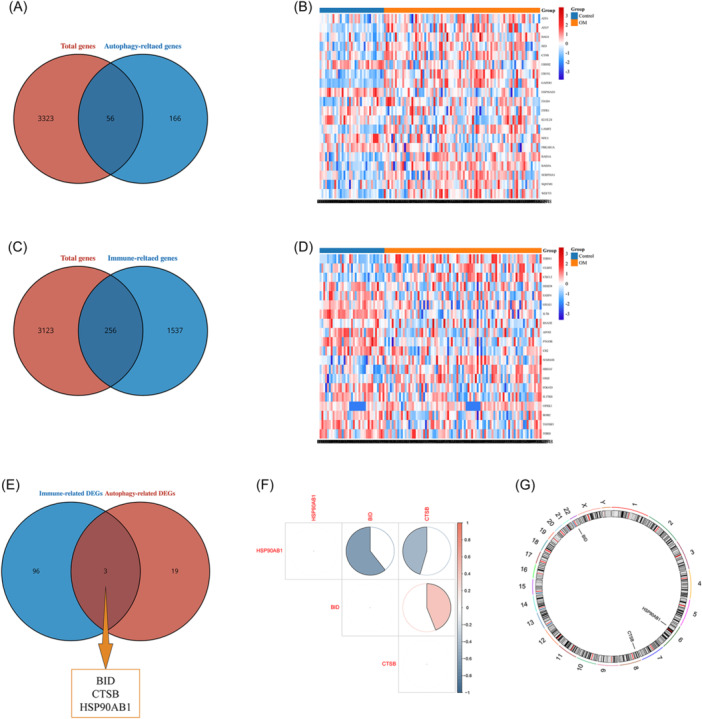
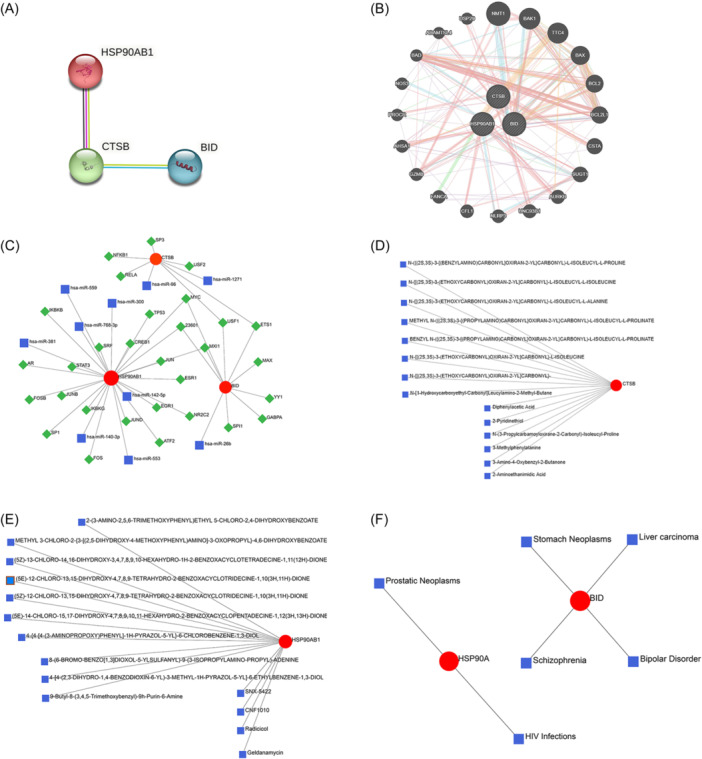
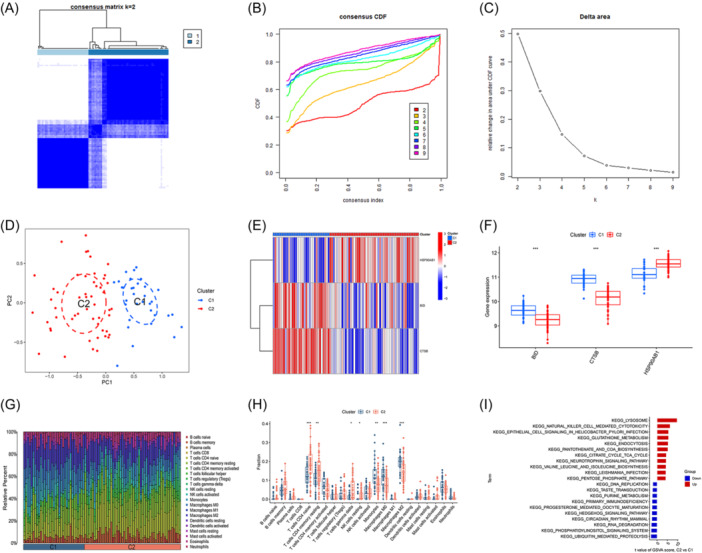
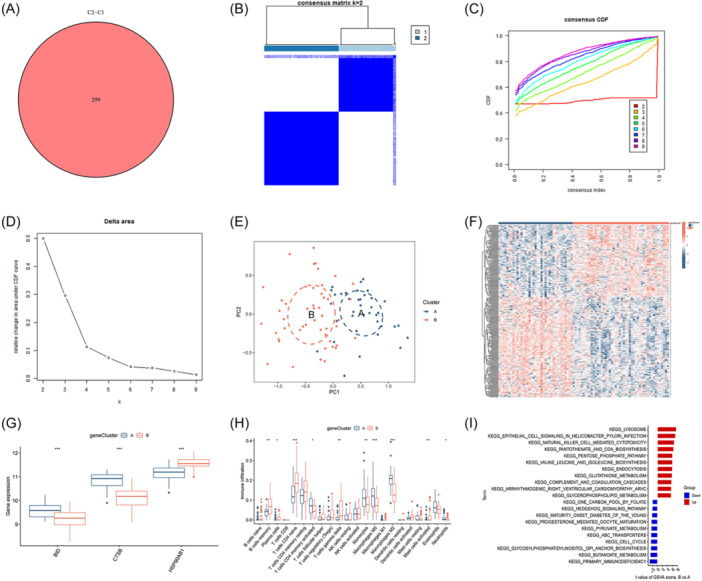
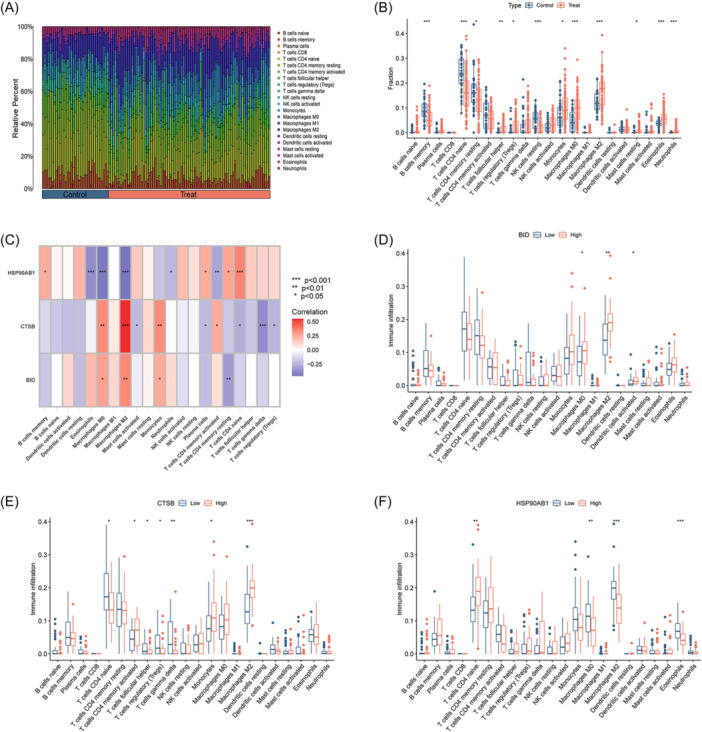
Methods: Transcriptomic data for OM was sourced from the Gene Expression Omnibus (GEO) database, leading to the identification of autophagy- and immune-related differentially expressed genes (AIR-DEGs) through differential expression analysis. Diagnostic and classification models were subsequently developed. The CIBERSORT algorithm was utilized to examine immune cell infiltration in OM, and the relationship between OM clusters and various immune cells was explored. Key AIR-DEGs were further validated through the creation of OM animal models.

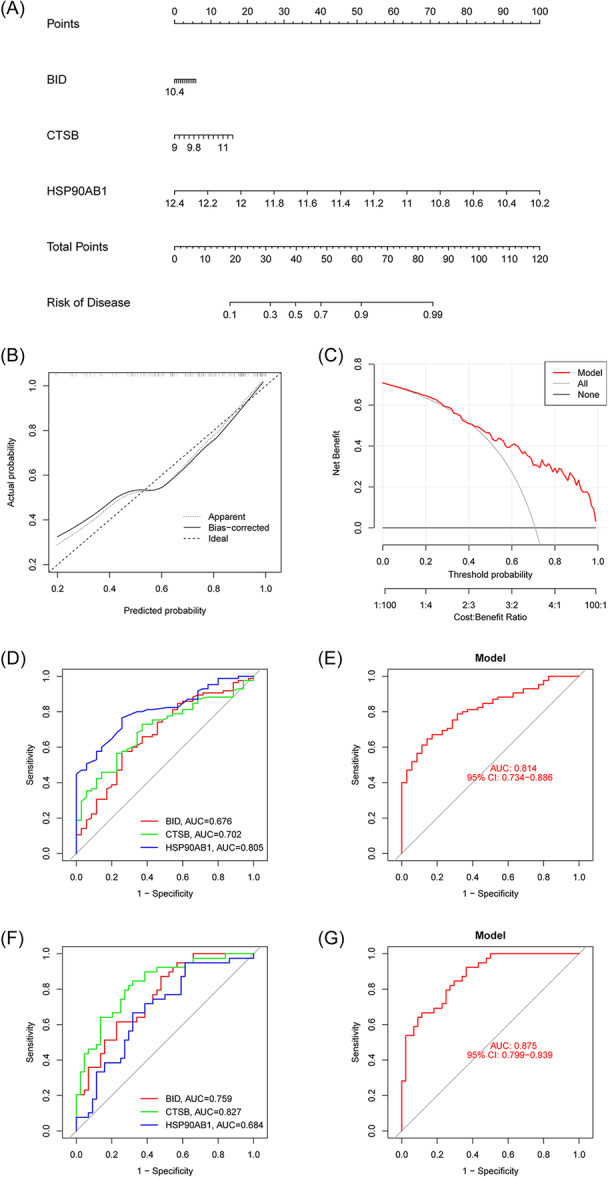
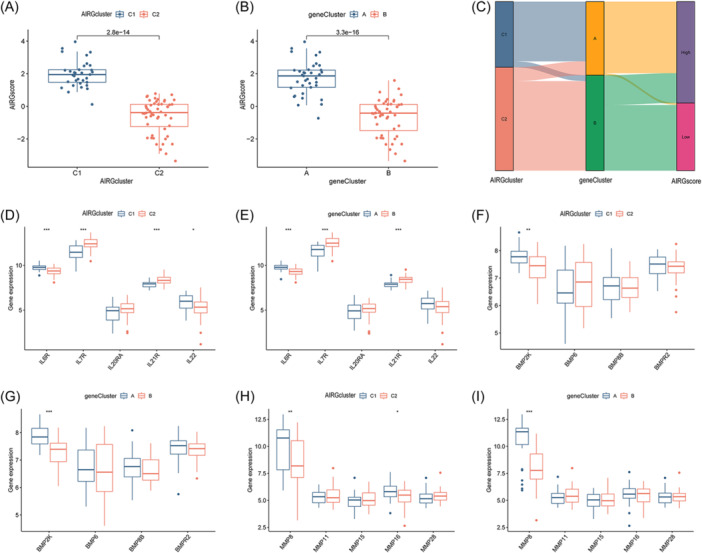
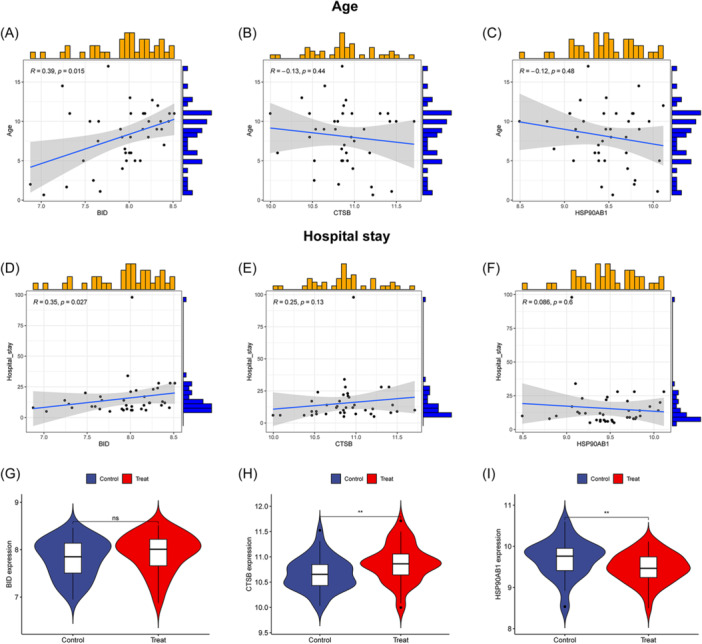
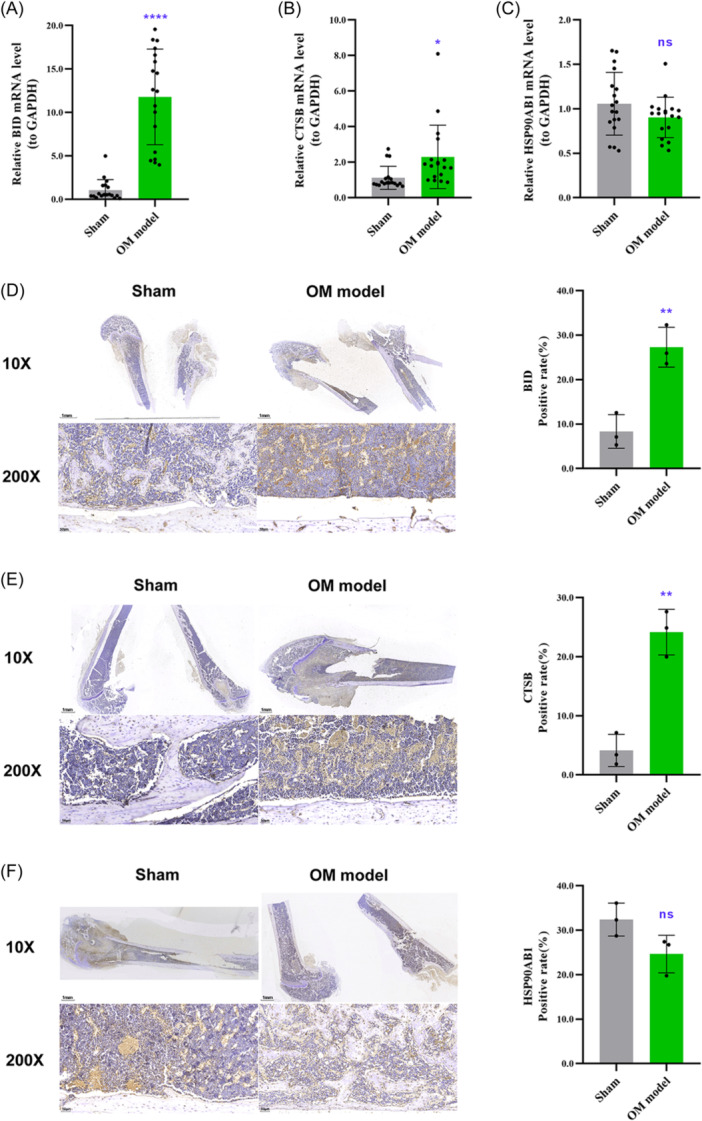
Results: Analysis of the transcriptomic data revealed three AIR-DEGs that played a significant role in immune responses and pathways. Nomogram and receiver operating characteristic curve analyses were performed, demonstrating excellent diagnostic capability for differentiating between OM patients and healthy individuals, with an area under the curve of 0.814. An unsupervised clustering analysis discerned two unique patterns of autophagy- and immune-related genes, as well as gene patterns. Further exploration into immune infiltration exhibited notable variances across different subtypes, especially between OM cluster 1 and gene cluster A, highlighting their potential role in mitigating inflammatory responses by regulating immune activities. Moreover, the mRNA and protein expression levels of three AIR-DEGs in the animal model were aligned with those in the training and validation data sets.

Conclusions: From an immunological perspective, a diagnostic model was successfully developed, and two distinct clustering patterns were identified. These contributions offer a significant resource for the early detection and personalized immunotherapy of patients with OM.

Keywords: autophagy; clustering pattern; diagnosis; immune; immune infiltration; osteomyelitis.


Conflict of interest statement

The authors declare no conflict of interest.

Figures

Figure 1
Figure 1
The workflow diagram of this study.
Figure 2
Figure 2
Screening of autophagy‐ and immune‐related differentially expressed genes (AIR‐DEGs). (A) Screening of autophagy‐related genes (ARGs). Red indicates the total genes, and blue indicates the ARGs. (B) Heatmap of AR‐DEGs. Red represents upregulated DEGs, and blue represents downregulated DEGs. (C) Screening of immue‐related genes (IRGs). Red indicates the total genes, and blue indicates the IRGs. (D) Heatmap of IR‐DEGs. Red represents upregulated DEGs, and blue represents downregulated DEGs. (E) Venn diagram of AIR‐DEGs. Red represents the AR‐DEGs, and blue represents the IR‐DEGs. (F) Correlation heatmap of three AIR‐DEGs. Red represents positive correlation, blue represents negative correlation. (G) Chromosome location of three characteristic genes.
Figure 3
Figure 3
Construction of protein–protein interaction (PPI), gene–gene interaction and transcription factor (TF)–microRNA (miRNA) networks. (A) PPI network based on characteristic genes. (B) Gene–gene interaction network. (C) Gene‐TF‐miRNA network. (D) Gene–drug prediction based on CTSB. (E) Gene–drug prediction based on HSP90AB1. (F) Gene–disease network based on characteristic genes.
Figure 4
Figure 4
Diagnostic model and nomogram were identified for osteomyelitis (OM) patients based on three signature genes. (A) Establishment of nomogram model to predict the incidence of OM. (B) Calibration curve. (C) Clinical decision curve (DCA). (D) Receiver operating characteristic (ROC) curve of three signature genes in training set. (E). A logistic regression model based on three signature genes in training set. (F) ROC curve of three signature genes in validation set. (G) A logistic regression model based on three signature genes in validation set. ROC, receiver operating characteristic.
Figure 5
Figure 5
Identification of clusting pattern based on three signature genes. (A) Heatmap of two clusters (k = 2) based on signature genes. (B) Cumulative distribution function (CDF) of eight clusters. (C) The area under CDF curve of eight clusters. (D) Principal component analysis (PCA) analysis of the two clusters: blue indicates cluster 1 samples; red indicates cluster 2 samples. (E) Differential heatmap of three signature genes between two different cluster. Red represents high expression and blue represents low expression. (F) Differential boxplot of three signature genes between two different cluster. (G) Landscape of immune microenvironment between two different cluster. (H) Differential boxplot of infiltration abundance of 22 immune cell types between 2 different cluster. (I) GSVA‐KEGG pathway analysis between two different cluster (*p < .05; **p < .01; ***p < .001). GSVA, gene set variation analysis.
Figure 6
Figure 6
Identification of gene‐related clustering pattern. (A) Intersection‐DEGs between clusters 1 and 2. (B) Heatmap of two clusters (k = 2) based on signature genes. (C) Cumulative distribution function (CDF) of eight clusters. (D) The area under CDF curve of eight clusters. (E) Principal component analysis (PCA) analysis of the two clusters: blue indicates cluster A samples; red indicates cluster B samples. (F) Differential heatmap of 299 intersection‐DEGs between two different cluster. Red represents high expression and blue represents low expression. (G) Differential boxplot of three signature genes between two different cluster. (H) Differential boxplot of infiltration abundance of 22 immune cell types between two different cluster. (I) GSVA‐KEGG pathway analysis between two different cluster (*p < .05; **p < .01; ***p < .001). GSVA, gene set variation analysis.
Figure 7
Figure 7
Autophagy‐ and immune‐related gene (AIRG)‐related cluster and gene‐related cluster. (A) AIRG score between two different AIRG‐related clusters. (B) AIRG score between two different gene‐related clusters. (C) Sankey diagram among AIRG‐related cluster, gene‐related cluster, and AIRG score. (D) Differential expression analysis of interleukin family‐related genes between two different AIRG‐related clusters. (E) Differential expression analysis of interleukin family‐related genes between two different gene‐related clusters. (F) Differential expression analysis of bone morphogenetic protein (BMP) family‐related genes between two different AIRG‐related clusters. (G) Differential expression analysis of BMP family‐related genes between two different gene‐related clusters. (H) Differential expression analysis of matrix metalloproteinase (MMP) family‐related genes between two different AIRG‐related clusters. (I) Differential expression analysis of MMP family‐related genes between two different gene‐related clusters (*p < .05; **p < .01; ***p < .001).
Figure 8
Figure 8
Immune microenvironment analysis of osteomyelitis (OM) patients. (A) Landscape of immune microenvironment between OM patients and healthy controls. (B) Differential boxplot of infiltration abundance of 22 immune cell types between OM patients and healthy controls. (C) Correlation heatmap of 3 signature genes and infiltration abundance of 22 immune cells. (D) The infiltration abundance of 22 immune cells between BID high‐ and low‐expression group. (E) The infiltration abundance of 22 immune cells between CTSB high‐ and low‐expression group. (F) The infiltration abundance of 22 immune cells between HSP90AB1 high‐ and low‐expression group (*p < .05; **p < .01; ***p < .001).
Figure 9
Figure 9
Clinical correlation analysis and expression levels of three autophagy‐ and immune‐related differentially expressed genes (AIR‐DEGs) in osteomyelitis (OM) patients. Correlation analysis between BID (A), CTSB (B), and HSP90AB1 (C) and age of OM patients. Correlation analysis between BID (D), CTSB (E), and HSP90AB1 (F) and hospital stay of OM patients: R > 0 indicates the two variables are positively correlated; R < 0 indicates the two variables are negatively correlated; p < .05 represents that the two variables are significantly correlated. Expression levels of BID (G), CTSB (H), and HSP90AB1 (I) in the validation set (ns: p ≥ .05, no significant difference; **p < .01).
Figure 10
Figure 10
RT‐qPCR and immunohistochemistry validation. Following the establishment of rat models of osteomyelitis (OM), total RNA was extracted from the focal bone tissues of the OM group and the sham group. The mRNA expression levels of BID (A), CTSB (B), and HSP90AB1 (C) were measured. Immunohistochemical staining was performed on the fixed tibial tissues to evaluate the protein expression levels of BID (D), CTSB (E), and HSP90AB1 (F), with the microscopic positivity rate serving as the measurement index. ns: p ≥ .05, no significant difference; *p < .05; **p < .01; ****p < .001.

Similar articles

Cited by

References

    1. Lew DP, Waldvogel FA. Osteomyelitis. Lancet. 2004;364(9431):369‐379. - PubMed
    1. Momodu II, Savaliya V. Osteomyelitis. StatPearls. StatPearls Publishing Copyright © 2022, StatPearls Publishing LLC.; 2022.
    1. Walter G, Kemmerer M, Kappler C, Hoffmann R. Treatment algorithms for chronic osteomyelitis. Dtsch Arztebl Int. 2012;109(14):257‐264. - PMC - PubMed
    1. Hofstee MI, Muthukrishnan G, Atkins GJ, et al. Current concepts of osteomyelitis. Am J Pathol. 2020;190(6):1151‐1163. - PubMed
    1. Urish KL, Cassat JE. Staphylococcus aureus osteomyelitis: bone, bugs, and surgery. Infect Immun. 2020;88(7):e00932‐19. - PMC - PubMed

Publication types